Bitcoin Update 21/08/21: Road to $74k, but first break $51,068Bitcoin Update 21/08/21: Road to $74k is clear, but first Bitcoin has to break above $51,068 and flip this into support for the next leg up to the 78.60% Fibonacci level at $57,125. If Bitcoin can flip the 61.80% fibonacci level into support we could see bitcoin approaching the $60K region looking to push for a new ATH. The 61.80% fibonacci level is a key resistance level and a level where we previously saw large amount of whale accumulation in the previous run before the May crash. In another possible scenario we could see Bitcoin retracing and consolidating in the short term but when we look on the lower time frame 4H, the swing call script has just triggered a strong buy signal showing continued bullish momentum for Bitcoin. It is official the Bitcoin Bulls are back!! Please see previous analysis below. Happy Trading :)
Bitcoin Update 14/08/21: Update: Currently 4% Gain from this Short-term Swing Opportunity, stops just below $43,812, TP @ $51,068 at the 61.80% Fibs, additional TP at the 78.60% @ $57,125 (19% Gain from current price level). Please see previous analysis below. Happy Trading :)
The Bitcoin Bulls are Back! After setting a new ATH @ $64,841 in April, Bitcoin experienced its the first major sell (some may say manipulated) off in this Bull Run Cycle (-50% from the top). We have been closely watching the BTC chart for a strong trend reversal signal. From the ATH @ $64,841, Bitcoin formed a triple bottom in the $28-30k region, the last bottom experienced on the 21st July is confirmed as our bottom here. The Swing Call Script gave further confirmation of the strong trend reversal as a Buy signal was triggered on the 4H Chart on the 22 July and further on the 6th August showing strong signs of bullish momentum back into the market.
From here we expect BTC to retest the current ATH @ $64k which is a 40% Gain from the current price @ $45k. Further to this, we can expect some heavy resistance between the 61.80% - 78.60% fibonacci level. A clear break past the 78.60% fibonacci level see BTC setting a new ATH at the 127.20% fibonacci level. Please see previous analysis below. Happy Trading :)
BTC finally testing the 200 SMA and is showing strong signs of bullish momentum as we see the BTC Bulls coming back into the market 🚀. After 4 failed attempts of trying to break above the key resistance @ $38,595 BTC has finally broken above this key price level. Since the crash BTC found its Bottom tanking down -51% on the 19th May to $28,787 from $57,777 and had previous retraced from the ATH price @ $64,841 to $46,814 (-27%). BTC has been in a whale accumulation zone for the past 27 days from 19th May to 15th June. Our Swing Call Script triggered a strong buy signal for #BTC LONG when the 13 EMA crossed up above the 50 SMA on the 10th June; BTC has since increased over 10% in just over 5 days. From the current price level we have longs positioned and the current TP 1 is at the 127.20% Fibonacci level @ $74,647 (85% gain from current price level) and TP 2 at the 161.80% Fibonacci level @ $87,122 (116% from current price level). Note the price targets are for long term swings, we may be in this accumulation phase a little longer. Happy Trading :). See previous analysis below.
Bitcoin Update 02/04/21 Next Target @ $66,953 13% Gain New ATH in April
I've loved charting BTC last Month, analysis has been quite spot on just waiting on our new ATH now @$66,953 13% Gain from current price level. #Bitcoin has found key support around $58k price level. It looks like the Bitcoin Bulls are back in the market. Worst case scenario from here in the short-term could see the price test the 50SMA, and breaking below this level would see another test of the 200SMA before the anticipated move to the upside and our target of $66.953 at the 127.20% Fibonacci level. See previous analysis below. Happy trading :)
Update 29/03/21 Bitcoin next Target @ $66,953 21% Gain
Nice bounce from the whale accumulation zone at the 78.60% Fibonacci Level. Looks like the BTC Bulls are back in the market.
See previous analysis below.
BTC Monthly Outlook Update (23/03/2021) Approaching Whale Accumulation Zone at the 78.60% Fibonacci level @ $52,371. Interesting next few days from here as a bounce from the 200 SMA at the whale accumulation zone could finally see us break through the key resistance at the current ATH level from 14/03/21 @ $61,690. April is set to be a very interesting and pivotal month for the cryptocurrency space. See previous analysis and monthly outlook below. Happy Trading :) #whaleaccumulationzone
Update 21/03/21: Yesterday the Bulls failed to push the price higher and we had a small retracement down from $59.5k to $55.6 where we found some support of the current price level (-7%). From here the worst case scenario would find us in a key whale accumulation zone @ 78.60% Fibonacci level $52,371. However this scenario is unlikely to play out and as expected from the previous outlook before, we expect the Bulls to come back in the market, pushing as further to higher highs as we have been consolidating around this key price range between $54.5K to the current ATH @ $61.8k. If we fail to break past the previous ATH , the bearish scenario may see a test of the 200 SMA around the 78.60% Fibonacci level, otherwise the Bullish scenario is still in play. Note that from this current trend from 28th January we have only tested the 200 SMA once and a bounce from this level may signal a much stronger bullish move towards our price target $77,335 @ the 161.80% Fibonacci extension and further $107,340 @ the 261.80% Fibonacci level. So far great performance this month from £BTC as March is usually quite a bearish month looking back at the past. April looks ready for us to really fly, testing the 161.80% Fibonacci extension , but note this may not be a straight forward push but all the fundamentals are pointing towards the $70K as our next significant area of interest for the Bulls, currently a 16% gain from the current price level would see BTC reach $66,953 127.20% Fib extension. See previous analysis from 1st March 2021 below. Happy Trading :) $BTC #HODL
*Update 20/03/21
#BTC Monthly Outlook Update from 1st March 2021; 13 EMA crossing up 50 SMA showing strong bullish sentiment as we are about to enter the last week of the month, expect the bulls to come back and to push the price higher. Currently the 127.20% Fibonacci Target ($66,953) has not been tested yet, but we expect some big movement in price over the next few days and further going into the last week of the month (Yes, it has been March Madness), 13% Gain from the current price level @ $59,390 to $66,953 127.20% Fib extension. Our next target after this is $77,335 @ the 161.80% Fibonacci extension . From our analysis at the beginning of the month It looks like scenario 2 has been in play, see below previous analysis from 2nd March 2021.
In addition to previous price analysis, the Cryptocurrency 'Super Cycle' is in play as we are just at the brink of global adoption. 2017/18 was the hype era, we cannot continue to set targets based on the price movements during the cycle mainly fuelled by hyper and euphoria, it is now 4 years later and real development has been happening behind the scenes, a lot of people cannot quite comprehend the growth and the different cycle that we are now in as Moore's Law of exponential growth can only give us a hint at the growth that is about to be experienced over the next 4 year cycle. An increased influx of capital injection into this now trillion dollar market will only continue, as Defi takes its hold on current Global financial infrastructure, and yes history repeats itself, We call this the 'Roaring 20s' just like before at the end of WW1, the pandemic has only accelerated the current adoption rate of blockchain technology. As some are already aware, the best time to grow a million dollar portfolio was from 2009 to 2019 just after the housing market crash. The second best time in our lifetime is Now! from 2021 to 2029 after the pandemic market crash. We are still very much Bullish for BTC to reach our EOY Target of $356,000, See below key fundamentals which support our bullish sentiment.
*(March 02, 2021 Update)
BTC is currently consolidating at 61.80 Fibonacci Level. BTC outlook for the month ahead is still very much bullish . Although the sellers have been in control of the market since soaring to a new ATH on 21/02/21, BTC took a sharp retracement as expected at these new level of resistance as well as a new ATHof$58,792 on the Gemini Exchange. As from historic highs we see a lot of profit taking occurring after 3 weeks of setting new constant highs from the previous low of the last push wave which saw BTC setting a high of $42K and then sharply retracing down to $28,787 where we found the previous resistance and also the beginning of the last phase which saw one of the greatest run of Bitcoin in history, reaching the current ATH of $58,792.
With the current push phase now over we find ourselves asking how low can we go from here and when do we expect to break past a new ATH . This outlook is based on 2 possible scenarios which could both play out. We have seen the 50% Fibonacci retracement level respected on the last 2 Push phases which both set new ATHs, the first being $42K and latter, the recent high of $58K. As we have seen a strong retracement over the past 7 days back down to the 50% Fibonacci, it may be time for the BTC Bulls to regain control of the market as the current fundamentals point to the 50%-38.2% Fibonacci level of key resistance as well as a point of accumulation for the BTC whales, more importantly the $39,000 mark when looking left at the previous key resistance before the parabolic move to the $58k ATH .
With this in mind, from the current levels we could see the price of BTC sink further before the much expected move which could see BTC testing the previous High of $58k and further pushing to the 127.20% Fibonacci extension level setting a new ATH @ $66,953.
Scenario 2 would see the current push towards the ATH continue but may face some resistance, and further consolidation expected around $46k-$49k as they are the key Whale Supports towards the upside, so a further retracement could be in play, possibly testing the 50% Fibonacci level, as well as the 50 SMA , with a bounce confirming an explosive move to the upside which could see BTC easily smash past the 127.20% Fib extension level setting new fresh Highs between $67,000-$78,400+ by mid to late March. Use the buy zone indicated to map out your position as a possible 52% gain is achievable from the Buy zone. Stochastics showing an extremely oversold market condition. Happy Trading :) *
Key Supporting Fundamentals for BTC:
Strong Interest of Institutional Players
A survey of institutional investors and wealth managers who already engage with bitcoin reveals that 85 per cent plan to increase their investment in the cryptocurrency over the next two years.
The survey, which was commissioned by Nickel Digital Asset Management (Nickel), a regulated investment manager connecting traditional finance with the digital assets market, also reveals that between now and 2023, 72 per cent expect professional investors in general to invest in bitcoin for the first time or increase their exposure.
Current Economic Instability
The policy of the US Federal Reserve and the economic instability that has arisen as a result of the unprecedented emission of new dollars may further play a role in the growth of Bitcoin price...10% of the $380 billion stimulus money could be going directly into cryptocurrencies and Bitcoin .
Digital Gold
Crypto currencies certainly look as if they’re here to stay. It makes a lot of sense to have them in an increasingly digitised world. While bitcoin has a strong tendency to polarise opinion, it has now gained acceptance among some of the world’s largest financial institutions and payments companies. MasterCard, for instance, has said it will begin supporting crypto currencies on its network later this year. PayPal already allows eligible users to buy, sell and hold bitcoin in the US and expects to roll out its service in other territories soon.
The Case For Global Adoption and New Reserve Currency
Cryptocurrencies promise to help solve problems that are particularly acute in emerging markets (EM). Their governments are often centralized but relatively unreliable, which destabilizes currencies, opens the door to profiteering middlemen, and erodes public trust. Blockchain, the technology behind Bitcoin’s decentralized network, promises to cut out the grasping hands of governments and middlemen, and speed up transactions with more transparency and lower fees. It is offering what many EM customers are desperate for.
The Development and Extensions of Blockchain Technology
Due to the nature of blockchain technology’s ability to benefit all parties involved in different business operations. Since it was introduced in 2009 through the application of Bitcoin , blockchain technology continues to attract not just the financial institutions of the world, but also other fields and industries in insurance , law, entertainment and the Internet of Things ( IOT ) applications. Several scholars and advocates have also strongly suggested the use of the technology in voting systems globally, medical records and vehicle registrations by the state to further increase efficiency, simultaneously eradicating fraud in many areas. This technology does not only aim to improve conventional business operations but can also empower the greater society out of poverty as 1.7 billion adults in the world remain unbanked. The widespread adoption of a cryptocurrency like bitcoin running on the blockchain would mean that anyone with access to the internet can send and receive value from point A to B without the need of a third party.
Although many Banks were very hesitant and in fact spread fear in the markets due to cryptocurrencies being linked to nefarious activities on the dark web. A recent study by Goldman Sachs suggested that the adoption of blockchain technology in facilitating seamless cross border transactions without the worry of fraudulent transactions could save up to $6 billion a year; as the new models currently being developed by the bank would mean inefficient payment and accounting networks would be eradicated.
Bitcoinlongtermanalysis

Bitcoin Update 14/08/21: New ATH Target @ $77,335 The Bitcoin Bulls are Back! After setting a new ATH @ $64,841 in April, Bitcoin experienced its the first major sell (some may say manipulated) off in this Bull Run Cycle (-50% from the top). We have been closely watching the BTC chart for a strong trend reversal signal. From the ATH @ $64,841, Bitcoin formed a triple bottom in the $28-30k region, the last bottom experienced on the 21st July is confirmed as our bottom here. The Swing Call Script gave further confirmation of the strong trend reversal as a Buy signal was triggered on the 4H Chart on the 22 July and further on the 6th August showing strong signs of bullish momentum back into the market.
From here we expect BTC to retest the current ATH @ $64k which is a 40% Gain from the current price @ $45k. Further to this, we can expect some heavy resistance between the 61.80% - 78.60% fibonacci level. A clear break past the 78.60% fibonacci level see BTC setting a new ATH at the 127.20% fibonacci level. Please see previous analysis below. Happy Trading :)
BTC finally testing the 200 SMA and is showing strong signs of bullish momentum as we see the BTC Bulls coming back into the market 🚀. After 4 failed attempts of trying to break above the key resistance @ $38,595 BTC has finally broken above this key price level. Since the crash BTC found its Bottom tanking down -51% on the 19th May to $28,787 from $57,777 and had previous retraced from the ATH price @ $64,841 to $46,814 (-27%). BTC has been in a whale accumulation zone for the past 27 days from 19th May to 15th June. Our Swing Call Script triggered a strong buy signal for #BTC LONG when the 13 EMA crossed up above the 50 SMA on the 10th June; BTC has since increased over 10% in just over 5 days. From the current price level we have longs positioned and the current TP 1 is at the 127.20% Fibonacci level @ $74,647 (85% gain from current price level) and TP 2 at the 161.80% Fibonacci level @ $87,122 (116% from current price level). Note the price targets are for long term swings, we may be in this accumulation phase a little longer. Happy Trading :). See previous analysis below.
Bitcoin Update 02/04/21 Next Target @ $66,953 13% Gain New ATH in April
I've loved charting BTC last Month, analysis has been quite spot on just waiting on our new ATH now @$66,953 13% Gain from current price level. #Bitcoin has found key support around $58k price level. It looks like the Bitcoin Bulls are back in the market. Worst case scenario from here in the short-term could see the price test the 50SMA, and breaking below this level would see another test of the 200SMA before the anticipated move to the upside and our target of $66.953 at the 127.20% Fibonacci level. See previous analysis below. Happy trading :)
Update 29/03/21 Bitcoin next Target @ $66,953 21% Gain
Nice bounce from the whale accumulation zone at the 78.60% Fibonacci Level. Looks like the BTC Bulls are back in the market.
See previous analysis below.
BTC Monthly Outlook Update (23/03/2021) Approaching Whale Accumulation Zone at the 78.60% Fibonacci level @ $52,371. Interesting next few days from here as a bounce from the 200 SMA at the whale accumulation zone could finally see us break through the key resistance at the current ATH level from 14/03/21 @ $61,690. April is set to be a very interesting and pivotal month for the cryptocurrency space. See previous analysis and monthly outlook below. Happy Trading :) #whaleaccumulationzone
Update 21/03/21: Yesterday the Bulls failed to push the price higher and we had a small retracement down from $59.5k to $55.6 where we found some support of the current price level (-7%). From here the worst case scenario would find us in a key whale accumulation zone @ 78.60% Fibonacci level $52,371. However this scenario is unlikely to play out and as expected from the previous outlook before, we expect the Bulls to come back in the market, pushing as further to higher highs as we have been consolidating around this key price range between $54.5K to the current ATH @ $61.8k. If we fail to break past the previous ATH , the bearish scenario may see a test of the 200 SMA around the 78.60% Fibonacci level, otherwise the Bullish scenario is still in play. Note that from this current trend from 28th January we have only tested the 200 SMA once and a bounce from this level may signal a much stronger bullish move towards our price target $77,335 @ the 161.80% Fibonacci extension and further $107,340 @ the 261.80% Fibonacci level. So far great performance this month from £BTC as March is usually quite a bearish month looking back at the past. April looks ready for us to really fly, testing the 161.80% Fibonacci extension , but note this may not be a straight forward push but all the fundamentals are pointing towards the $70K as our next significant area of interest for the Bulls, currently a 16% gain from the current price level would see BTC reach $66,953 127.20% Fib extension. See previous analysis from 1st March 2021 below. Happy Trading :) $BTC #HODL
*Update 20/03/21
#BTC Monthly Outlook Update from 1st March 2021; 13 EMA crossing up 50 SMA showing strong bullish sentiment as we are about to enter the last week of the month, expect the bulls to come back and to push the price higher. Currently the 127.20% Fibonacci Target ($66,953) has not been tested yet, but we expect some big movement in price over the next few days and further going into the last week of the month (Yes, it has been March Madness), 13% Gain from the current price level @ $59,390 to $66,953 127.20% Fib extension. Our next target after this is $77,335 @ the 161.80% Fibonacci extension . From our analysis at the beginning of the month It looks like scenario 2 has been in play, see below previous analysis from 2nd March 2021.
In addition to previous price analysis, the Cryptocurrency 'Super Cycle' is in play as we are just at the brink of global adoption. 2017/18 was the hype era, we cannot continue to set targets based on the price movements during the cycle mainly fuelled by hyper and euphoria, it is now 4 years later and real development has been happening behind the scenes, a lot of people cannot quite comprehend the growth and the different cycle that we are now in as Moore's Law of exponential growth can only give us a hint at the growth that is about to be experienced over the next 4 year cycle. An increased influx of capital injection into this now trillion dollar market will only continue, as Defi takes its hold on current Global financial infrastructure, and yes history repeats itself, We call this the 'Roaring 20s' just like before at the end of WW1, the pandemic has only accelerated the current adoption rate of blockchain technology. As some are already aware, the best time to grow a million dollar portfolio was from 2009 to 2019 just after the housing market crash. The second best time in our lifetime is Now! from 2021 to 2029 after the pandemic market crash. We are still very much Bullish for BTC to reach our EOY Target of $356,000, See below key fundamentals which support our bullish sentiment.
*(March 02, 2021 Update)
BTC is currently consolidating at 61.80 Fibonacci Level. BTC outlook for the month ahead is still very much bullish . Although the sellers have been in control of the market since soaring to a new ATH on 21/02/21, BTC took a sharp retracement as expected at these new level of resistance as well as a new ATHof$58,792 on the Gemini Exchange. As from historic highs we see a lot of profit taking occurring after 3 weeks of setting new constant highs from the previous low of the last push wave which saw BTC setting a high of $42K and then sharply retracing down to $28,787 where we found the previous resistance and also the beginning of the last phase which saw one of the greatest run of Bitcoin in history, reaching the current ATH of $58,792.
With the current push phase now over we find ourselves asking how low can we go from here and when do we expect to break past a new ATH . This outlook is based on 2 possible scenarios which could both play out. We have seen the 50% Fibonacci retracement level respected on the last 2 Push phases which both set new ATHs, the first being $42K and latter, the recent high of $58K. As we have seen a strong retracement over the past 7 days back down to the 50% Fibonacci, it may be time for the BTC Bulls to regain control of the market as the current fundamentals point to the 50%-38.2% Fibonacci level of key resistance as well as a point of accumulation for the BTC whales, more importantly the $39,000 mark when looking left at the previous key resistance before the parabolic move to the $58k ATH .
With this in mind, from the current levels we could see the price of BTC sink further before the much expected move which could see BTC testing the previous High of $58k and further pushing to the 127.20% Fibonacci extension level setting a new ATH @ $66,953.
Scenario 2 would see the current push towards the ATH continue but may face some resistance, and further consolidation expected around $46k-$49k as they are the key Whale Supports towards the upside, so a further retracement could be in play, possibly testing the 50% Fibonacci level, as well as the 50 SMA , with a bounce confirming an explosive move to the upside which could see BTC easily smash past the 127.20% Fib extension level setting new fresh Highs between $67,000-$78,400+ by mid to late March. Use the buy zone indicated to map out your position as a possible 52% gain is achievable from the Buy zone. Stochastics showing an extremely oversold market condition. Happy Trading :) *
Key Supporting Fundamentals for BTC:
Strong Interest of Institutional Players
A survey of institutional investors and wealth managers who already engage with bitcoin reveals that 85 per cent plan to increase their investment in the cryptocurrency over the next two years.
The survey, which was commissioned by Nickel Digital Asset Management (Nickel), a regulated investment manager connecting traditional finance with the digital assets market, also reveals that between now and 2023, 72 per cent expect professional investors in general to invest in bitcoin for the first time or increase their exposure.
Current Economic Instability
The policy of the US Federal Reserve and the economic instability that has arisen as a result of the unprecedented emission of new dollars may further play a role in the growth of Bitcoin price...10% of the $380 billion stimulus money could be going directly into cryptocurrencies and Bitcoin .
Digital Gold
Crypto currencies certainly look as if they’re here to stay. It makes a lot of sense to have them in an increasingly digitised world. While bitcoin has a strong tendency to polarise opinion, it has now gained acceptance among some of the world’s largest financial institutions and payments companies. MasterCard, for instance, has said it will begin supporting crypto currencies on its network later this year. PayPal already allows eligible users to buy, sell and hold bitcoin in the US and expects to roll out its service in other territories soon.
The Case For Global Adoption and New Reserve Currency
Cryptocurrencies promise to help solve problems that are particularly acute in emerging markets (EM). Their governments are often centralized but relatively unreliable, which destabilizes currencies, opens the door to profiteering middlemen, and erodes public trust. Blockchain, the technology behind Bitcoin’s decentralized network, promises to cut out the grasping hands of governments and middlemen, and speed up transactions with more transparency and lower fees. It is offering what many EM customers are desperate for.
The Development and Extensions of Blockchain Technology
Due to the nature of blockchain technology’s ability to benefit all parties involved in different business operations. Since it was introduced in 2009 through the application of Bitcoin , blockchain technology continues to attract not just the financial institutions of the world, but also other fields and industries in insurance , law, entertainment and the Internet of Things ( IOT ) applications. Several scholars and advocates have also strongly suggested the use of the technology in voting systems globally, medical records and vehicle registrations by the state to further increase efficiency, simultaneously eradicating fraud in many areas. This technology does not only aim to improve conventional business operations but can also empower the greater society out of poverty as 1.7 billion adults in the world remain unbanked. The widespread adoption of a cryptocurrency like bitcoin running on the blockchain would mean that anyone with access to the internet can send and receive value from point A to B without the need of a third party.
Although many Banks were very hesitant and in fact spread fear in the markets due to cryptocurrencies being linked to nefarious activities on the dark web. A recent study by Goldman Sachs suggested that the adoption of blockchain technology in facilitating seamless cross border transactions without the worry of fraudulent transactions could save up to $6 billion a year; as the new models currently being developed by the bank would mean inefficient payment and accounting networks would be eradicated.

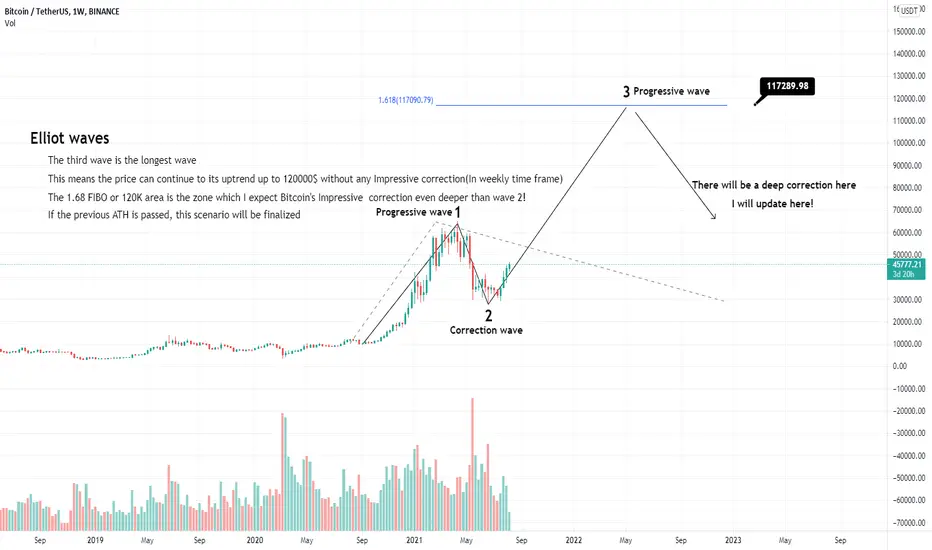
Bitcoin's next major target(Weekly TM)Hi there, Bitcoin's analysis in weekly time frame was published To have a better view of the market.
Now we can say that THIRD ELLIOT WAVES is started and the end of this wave must be 120K area according to technical analysis so there will be a major correction there even deeper than last one!
More description is on the chart, See and share it with your friend, This is important!
Good luck
BTCUSDT (1D CHART) Resistance BreakoutBTCUSDT (1D CHART) Technical Analysis Update
BTCUSDT (1D CHART) currently trading at $40100
Buy-level: Above $40000
Stop loss: Below $34456
Target 1: $42900
Target 2: $47100
Target 2: $53000
Target 2: $58000
Max Leverage: 2X
ALWAYS KEEP STOP LOSS...
Follow Our Tradingview Account for More Technical Analysis Updates, | Like, Share and Comment Your thoughts.

BTC/USD: Looking Bearish (short term)Overview:
As many others might suggest, BTC's bull run and dominance has seemingly come to an end . Personally, I believe this was long over due. Its technology as a whole is fast, secure, and reliable; but when considering BTC relative to the thousands of other cryptocurrencies it is superior in popularity but not much else .
Elon Musk recently commented on BTC's energy inefficiencies, as it is very costly to mine, and the negative effects it has on the environment. While he is a public figure, do not be so foolish as to think he is the one who is responsible for BTC's retracement... BTC has grown exponentially over the past year alone. It deserves a consolidation period and time for reconsidering its energy consumption. Elon is only pointing out what most of the experienced crypto traders already knew.
Comparative Analysis:
BTC's Dominance (shown in orange) you can see has peaked at the beginning of 2021, with a high of ~70%, and has gradually been tapering off to almost 40%, as of today.
The Total Crypto Market Cap (shown in purple) has closely correlated with BTC's run. This was true until May 4th (highlighted in yellow) when BTC's dominance moved less than 50% and we see this correlation die off.
Technical and Fundamental Analysis:
Technical: BTC is started to look bearish on a decreasing monthly volume, reaching its March lows. BTC is starting to look bearish as it retests March lows. Could see lower lows if it fails to rebound on the retest. If we see a spike in volume without it rebounding back towards VWAP, BTC may be especially bearish short term. Looking at the Volume Profile (VP) the price level with highest volume is shown at ~$18,500 and this is where BTC might be headed
Fundamental: Just looking at the energy efficiency of BTC, things look quite bearish. However, BTC adoption among investors, banks, the general public, and merchants is increasing rapidly. This is good news as BTC should start to stabilize and become less volatile. With the largest crypto market cap, ~$1 trillion, it likely wont see much growth in BTC until ETH, DeFi, and the other sectors within crypto catch up.
Trading Discussion (NOT financial advice):
Watch for lower lows and monthly volumes. If BTC gaps down in the coming weeks it may be wise to hold until it flushes back upwards and sell afterwards. There are many opportunities for growth even if BTC is bullish. For BTC lovers & HODLers continue holding as you please but do some research and see what developers are working on. If devs are working towards switching BTC from PoW to PoS or some other energy efficient protocol for validating the blockchain then see what that timeline looks like. If BTC does migrate to PoS then decide a good entry point right before the protocol is scheduled to migrate and you might find yourself in a great position for another bull run in the future.
Chart Description:
Symbol: BTCUSD Index (Bitcoin price in USD index)
Comparing Symbols:
CRYPTOCAP BTC.D (Bitcoin's % Dominance in Total Crypto Market Cap)
CRYPTOCAP TOTAL (The total market cap of all cryptocurrencies)
Indicators:
Log scale
Volume w/ 30d MA
VWAP (anchored on the monthly)
Volume Profile (180d)

Bitcoin's next move: Rise or Fall? Hello Everyone,
I wanted to make a post about my current opinions of Bitcoin. Although I am a bull, I do believe bitcoin is overdue for at least one red month or two and we are starting to see signs of market exhaustion. With what seems as if every large financial institution and tech company is investing in bitcoin, why do I think this?
Well, the market is still an algorithm. People are people and need to take home profit to support themselves. Some people have held since $20,000 and may want to take some profit. These types of things will trigger a sell off.
Let's also not forget about the technicals:
1. Bitcoin's monthly, weekly, and daily charts are showing bearish price action with volume going down as price going higher. This could also be known as market exhaustion.
2. Bitcoin has failed to close a daily and weekly candle above $60,000.
3. Bitcoin continues to fail to close above our "Heart-line" which is the dotted line in the middle. Rejection could lead to another sell off.
4. Bitcoin has yet to bounce off the weekly 20MA or 50MA which it did several times in the 2017 bull market.
5. RSI is showing bearish "tops" as we are moving higher in price and lower in RSI.
6. MACD is showing clear waning buying momentum or possible exhaustion on the weekly and daily charts.
Now, with all of this said, these are the technicals. Volume could come in and we could pump to considerably higher price points. We could just consolidate between $50,000-$60,000 for a while. But in my opinion, if volume does not start to come in, we will not hold above $60,000 and honestly a 15-25% correction would be very beneficial and healthy.
I am personally waiting to DCA on a large dip. My buying targets are: $45,000, $50,000, and $55,000.
Please leave a thumbs up if you liked the post and comment your opinion below.
As always, be patient, use risk management, and good luck trading.

BITCOIN, Ready to HUNT Investors Again..!!BTC is at ALL TIME HIGH.
Double Top
It's been holding since last week
If weekly candle closes below 20K Then
there might be a chance of 17k then 14k
Trendline can be scene
Remember that it can be FAKE BREAKOUT too
just to lure newbie investors so
This month is really really crucial for BTC.
I hope it won't break above within this year.

SUPER LONG TERM BULLISH TREND NEXT 5 OR 6 YEARSTaking the previous halving counting the days to the ATH and how much percentage it went up and just moving it over to the next 5 or 6 years to get an idea of some prices. just a thought experiment.

Prediction for Bitcoins next top extrapolated from historic dataHello everyone. I saw a post about a prediction for Bitcoins next top that was just ghost candles from last bull run slapped on top of their expected next bull run with an expected high of roughly 300000. I didn't necessarily agree so I figured I'd give my perspective.
Historically speaking, Bitcoin has grown logarithmically over the years in such a way that the percent growth of one bull run is half that of the proceeding bull run with a margin of error of about ~6%. If you take the percent growth from last bull run, 1578%, cut that in half and extrapolate that information to the next bull run using the historically accurate logarithmic growth curve as a guide for a stopping point you'll see Bitcoins next top ranging from $150000/BTC to $200000/BTC sometime in the next few years. This all assumes that Bitcoin will continue to grow and that the logarithmic growth curve will hold up. For all intents and purposes, the boundaries of this indicator could certainly be broken to the up or downside due to extenuating circumstances.
Feel free to reach out with comments, questions or concerns.

Get Ready for 13.8K Bitcoin, Longer TermIt's a piece of art guy's, with the bearish look of the Dollar and the bullish look on Bitcoin, we will soon see 13.8K for Bitcoin


Bitcoin Halving Comparison, So Far So Good!History tends to repeat itself, and the bitcoin halving appears to be no exception to this particular rule.
In 2016, during the second BTC halving, the BTC price experienced strong growth before the halving. A bear market followed, consisting of a 40% drop in price from the pre-halving high to the post-halving bottom. Afterward, a lengthy ranging period ensued.
Before the third halving that took place in May 2020, Bitcoin also experienced strong growth of more than 150% from $3,800 to $10,000; just like in 2016, a fast crash followed just before the halving. However, the 2020 crash was truncated and nowhere near as severe as the bear market that traders saw in 2016. Based on this comparison, we can infer that a short correction may follow before the bull market commences. Bitcoin is currently experiencing a range.
It took BTC around 160 days to break through the highest price before the halving. We currently sit at 67 days after the halving. While Bitcoin cycles are similar, they are not the same. While it would be impossible to predict accurately when the bullish market will start, based on past trends we can predict that it will most likely occur somewhere between 100-200 days after the halving (or 30 to 130 days from today).

Covid19 vs Oil vs BTC (LONG)an Oil infected makes the rest infected.
We can only reduce the risk in such crisis, more panic will never be a good choice. So its better to wait for the right frame!
Candles predicted in red shows the possibility of a fall due to economical influence. However , we all know Crypto always maximizes the return in long if we enter the exact moment.
Moreover candles in green are the possibility to reaching BTC around 20K once again :)
Play safe,
Invest Wisely.
Good Luck!

BTCUSDT- LONG SETUP FOR +8%HI to us,
Values studied with fibo on the previous waves of elliot and on a recent click. For the indicators that push me to think about a long position, please read the related or most recent posts on my profile

BTC 2015 fractal fits current trend lines perfectly?!the current flash crash reminded me of the 2015 flash crash that was ultimately the bottom, I decided to grab that fractal and place it to the current time and what I found was very strange, it fits out current trend lines perfectly! beyond that it fits with the halving pump and dump! I am not saying this is going to happen, but it would be super cool if it did! save this chart!

Bitcoin mooning to USD 3,11,770!Bitcoin fib long term log scale target puts it at USD 3,11,770 in the next bull run. Let's wait and watch!

BTC MONTH VIEW MACD SELL SIGNAL, INERTIA REJECTIONHello Traders,
In the long term view, month candle sticks, we see a MACD sell signal.
Inertia rejected at 50, asset should stay down in price as a result of this.
Do not panic, but shakeout imminent.
We may see a continuation of a downward channel for months to come.
I do not see an immediate crash, but this is the safest way for institutional money to exit.
Thank you and have a great day trading!
-dysonring2050

Bitcoin 3 years historical logarithmic chartI made an example of bitcoin logarithmic chart, with the existing uptrend which never broke.
Becides that in chart you can see, that every week that passes, there is a higher "lowest point", and it grows per ~100usd per week.
Since this is historical chart and as we see that bitcoin never disobey following that trendline.
So million dollar question. When ATH?
Chart says by the end of 2020, without any significant parabolic ride. If there will be a parabolic rally, then Bitcoin could reach over 50,000$ by the end of 2020.
Buckle up, buy all low levels and find your exit strategy :-)

BTCUSD - Let´s be realistic, it looks bearishSince the top of June we saw a clear correction to the previous bitcoin level. With the break of the 61,8 fib-level in the area of 7.200$ we confirmed a further downmove.
Some people say it currently looks like a doublebottom but i don´t think so. It was definitely a new low and we jumped back into a boring sideways zone.
If we want to confirm a bullrun we have to break the green resistance at the area of 7.850$ and later the falling resistance line (blue).
I think the likelihood of more downside action is much bigger. The reaction rally yesterday could not create a new higher high, it was lower high. We have to be realistic
this a bearish sign. I look for a second test of 6.420$ and the area of 5.800$ - 5.600$. If we reach this levels it is time to accumulate.
Please leave a like or a comment!

BTCUSD Daily Chart Long Term Analysis - Beautiful Potential BULLOn a daily Chart I am beginning to see a little bit more sense of which direction I think price might want to go.
I see price pulling back a little, then get to the top of that channel and bounce right back to $6,500 if it doesn't break the resistance of that channel.
OR
Price of Bitcoin might fall a little more (and maybe back to $6,500 and maybe dip towards $5,500) before going to the top of that channel, breaking it and then flying off...
OR
...maybe if it dips towards the $5,500 support, it'll break it, make it a resistance, and dive to $2,200.
But for now, to me, I think it will finish this pullback and then we go full BULL...but we'll see.
What do you think?

BITCOIN SHORT Bigger Overwiew Support 7200 and 6900 must hold.Hello to all watching my charts.
No after the big fall yesterday i think we should have
a closer look to the big picture, cause in shorttime its all
Short , all of my channels show me "short" of cours.
So have a look at the picture.
Where are we now ?
We had a break of the long lasting LONG trendline
4 weeks ago in September.
That has ocurred the first big move down to 8800
and now the next step down to 7500.
Here in these aerea we do have 3 major supports coming in
from May and June 2019.
Now we are sitting in the aerea of the first support at 7500
(folling down a little bit)
Below that Bitcoin can get support at 7200 and around 6900.
If both Levels dont hold i am afraid we will see much much
lower prices.
Thats to watch
Good trades
If you want to support my work please like them...
and if you want to know more about my trading style
please send my a boardmail.
Renkotrade
