Bitcoin Long Position:BTC Getting Ready For a Big MOVE Upwards!Based on AB=CD pattern , Time Ratio & Gann Analysis, It's a potential long position to gain good profits.
In a lower time-frame (4hrs) this long position has also been conformed.
Target profits are mentioned in the chart.
Adjust your Stop Loss according to your lot size,
account equity ,strategy & money management.
***If you want to get in this trade from this point 7819, you can still make profit till TP1 is reached, however there is a very high probability that price may continue to move down towards my ideal entry point., It is recommended to enter with a smaller lot size if you want to go long right away & manage your stop loss accordingly.
Good Luck.!
* This is my personal view and analysis on this chart. If you follow this idea please plan your trade according to your lot size and account equity.
Don't forget to like, If you like my analysis :)
Bitcoinlongtermanalysis

BTCUSD BITCOIN Bull Breakout And How Im Trading It!Bitcoin USD is on a bull run and has broken out! how high will it go!

#BTC # 4H #CMEIn a closed chat, gave a recommendation to buy from the $ 10,150 zone (already 5.62% profit at the moment from the entry point)
Why they bought: rebound from a strong level of $ 10,000
I think we are going to block the top gap.
Need to see what the reaction will be near the level of $ 11,000

Fail Proof Bitcoin HODLSo people have been asking, "Should we sell?" My answer is "HELL NO!" Look, I trade nearly full-time. I also have a part-time job at a coffee shop and I take college courses. I do enjoy trying to increase my BTC holdings where I can. I use Bitmex a couple times a month shorting and longing on 10x and 15x (rarely 100x, usually with 10k on 100x for a 2-5% gain then I close ***on rare occasions***) I do very well. However, for most of you guys n gals out there, here is my suggestion for you. I posted this info in a past post, but I didn't show the chart I was referring to... Well, here it is. BTC on the ALL chart shows the number one method I use to sell all my BTC for an incoming bear market. Just follow the RSI. Every Bull Cycle thus far ended the same way. It double tops on the RSI between 92-96.8... That is my fail-proof method for all you people out there. If you aren't a full time trader, just buy BTC and hodl for this RSI double top. You're welcome... ALso, if you are waiting on a alt-coin season to truly blast off... My opinion is, it won;t happen until BTC reaches it's old ATH again. Perhaps if this market is going parabolic like 2013, it may be sooner than I am thinking, but it could happen before the end of this year. Just HODL my fellow crypto kangz!
Donations if you found this helpful:
BTC : 18LQbEMKRp7UkqT1mWCJs81BEoispm3SEP
ETH: 0x1F43C5282450e68A9e76584e36D8b94eD1EB929d
LTC : LSv4dUP8559kFmjNnmttep2X7qnC2ZtMQW
RDD: RaWzTUydbZFATK5UPAQ35GTewvnW3PeRSD
LSK: 14651053185914359998L
BAT: 0x1F43C5282450e68A9e76584e36D8b94eD1EB929d
XRP: rH5DcvFi6TrScTPUhnTygMRdrVukuTqaeR Tagline: 0
PPT: 0x1F43C5282450e68A9e76584e36D8b94eD1EB929d
BNB: bnb1n3kf3alf3uughuc4u5fgmauhfen3lprs9lrc8p
Paypal: nicksnydz61@gmail.com

XBT/USD Summary for End Week 4 - 2019Is there any hope for a rise in the price of Bitcoin?
Well imo technically there may well be. In the short term I wouldn't be surprised to see a retest of the 3145 low area, however if price doesn't go lower and can break current support at 3518, then an attempt at 6000 and above may well be on the cards. But of course, and as can be seen we have a significant barrier of historic resistance at 6153 which may take some getting through. Ultimately and as hinted at by the Kumo (red) cloud, a longterm base of 8000 may be achievable if all goes well.
The technical analysis can be supported by the recent weakening of the US Dollar. Any weakness here should see Bitcoin move higher. That's quite possible if the trade spat with China is resolved quickly and China gets a grip on its own growth problems. A dovish Fed will also help with downward pressure on the USD
WAIT FOR NOW

BITCOIN BITCOIN BITCOIN ! SATOSHI NAKAMATO VISIONNO NEED TO EXPLANATION FOR THE TARGET. HISTORY WILL SHOW . AS THE TIME PASS THIS CHART WILL FOLLOW THE PATH TO $100,000
I ALREADY POST MY BTC TARGET AT $2500 FOR THE MOST WORST CASE IN MAY 2018. 3700 WAS MY ACCUMULATION ZONE.
:) :) NO HOPIUM / DIGITAL WORLD / BLOCKCHAIN

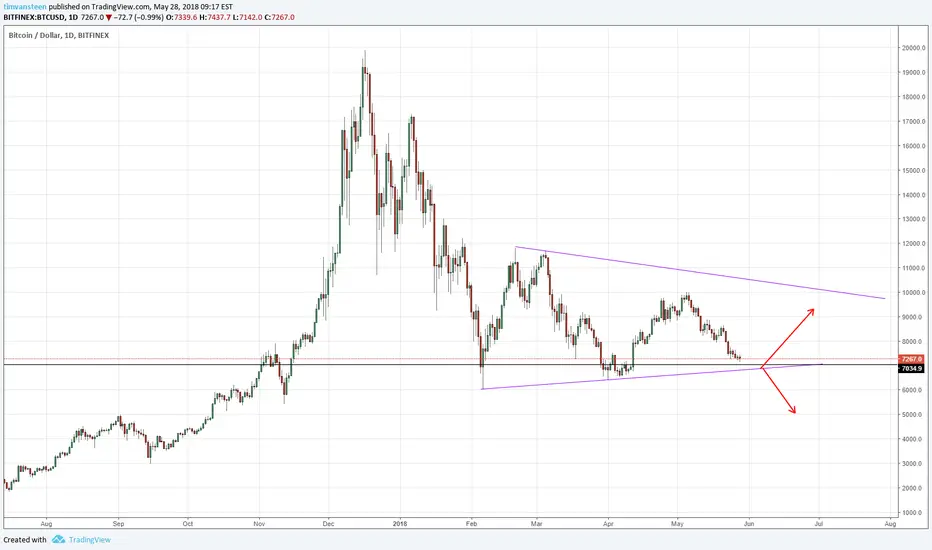
Potential good price to buy Bitcoin again.Bitcoin is showing a strong technical setup giving us signals that it is near some support levels.
Watch price action carefully when price reaches the 7.000 area.
What might potentially happen:
- Not respecting the level and goes further towards 5.000 zone
- Respect the level and bounce back towards the 10.000 zone