Bitcoinpattern

BTC Bullish GartleyBINANCE:BTCUSDT
Bitcoin has completed a bullish gartley.
Expecting more climb from BTC over the coming weeks and back to $11.5k +


BTCUSD Turn your eyes away for 2 minutes a 5minute candle dump!A single swift five minute candle has brought us crashing down $600+ below the critical sloping support which proved too much for bitcoin to climb past right now. Not only that but we now find ourselves beautifully supporting on the sloping Support line and a fall below that could see us easily reach 11000, nothing out of the ordinary here so far as we still in healthy consolidation area.
For those who successfully shorted this drop well done (Special mention to one of our past posts predicting the future like boss: Double Top Rejection...Is this what the Bears need?!)...guess we were on the money :).
That said, Bull Targets:
11400 (we need to trade above this to avoid further drops), 11600, 11800 best case 12000
Bear Targets:
11200, 10900, 10500 worst case 10000
The RSI is looking rather bearish a trend reverse and climb above 50 at least is needed for a rally to the upside.
A wise man once said: Follow your own gut, this is not financial advice!
As always Trade Safely, Happy Trading!

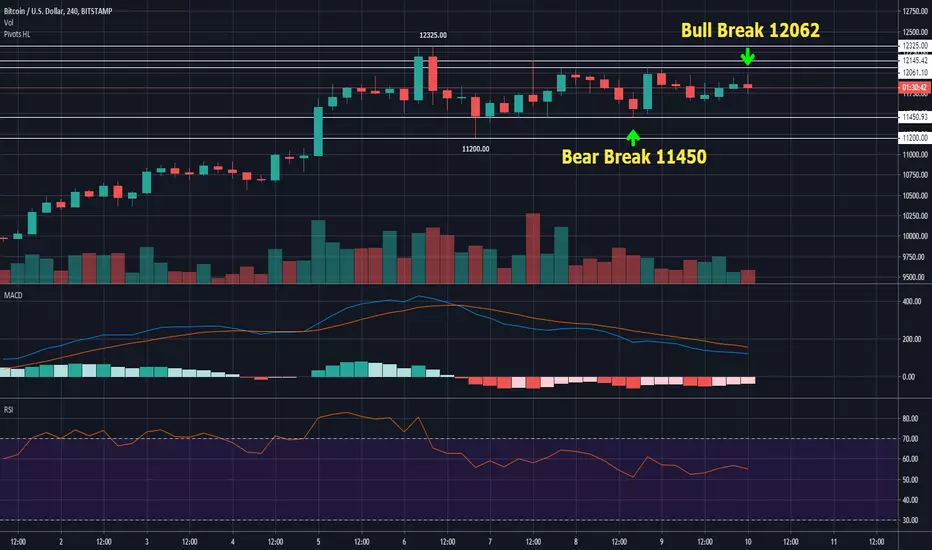
BTC Break Out Coming!BTCUSD is about to break out of this Equilibrium numbers for the break out of this lower highs and higher low pattern is going to be 12065 for the Bulls to run or 11450 for the Bears to take control
BTCUSD Moving like clockwork!As expected the slight bump on the road that saw us descend from 10800 to 10600 for almost a full day was as predicted a scare tactic to squeeze a couple longs out of their positions, please see my last post on this idea "Guess that was the top...for now"!
That aside we have managed to break 10800 not only that we kept moving past 11200 in one swift move like it wasn't even there, yet again just as predicted we find ourselves now dealing with the high confluence of the 11300 to 11500 range.
Whats next for the bulls:
Need to break past 11600, 11900 and test if 12000 is possible.
I believe 12000 will be range of either extreme greed, you will hear news of bitcoin like waterfalls and loads of FOMO will follow.
We may see yet new highs or we may plunge just as swiftly as we have climbed, do not take everything the media says seriously half the reporters dont even know what blockchain is or have read any whitepaper in their entire lives.
Onto the Bears:
Current Support at 11500, 11200-11000, failure to hold 11000 will see us once again flirting with 10800-11400.
We may slowly descend along the sloping resistance or climb towards 12000 and test that before a correction to the downside in that case we may need to breach 11500 in order to keep falling, other than that the bulls will keep climbing.
A word from the greats: Turbulence is looming, trade with caution, this is not financial advice, i am but just a kid with crayons!
As always Trade Safely, Happy Trading! Will be plotting new trend lines soon, thank you for all that have been following my silly predictions LOL.

BTCUSD...Guess that was the top...for now!Like text book we failed to breach 11000-11200 range and we now as of writing back to 10600 and falling, play your cards close to your chest though as this may very well be a fake-out to squeeze longs out as well. My last post has the whole story, it may be found on the chart itself or related posts, be kind to have a look, not much to say right now.
BEAR TARGETS aka support ranges:
10400,10200,9700, worst case 9000
BULL TARGETS aka Resistance ranges:
10700, 11000, 11500, best case scenario 12000. Please note that 11300 to 11500 has so much confluence is not even funny.
A word from the Greats: Rome was not built in a day, take your time with this Trades.
As always Trade Safely, Happy Trading!

BTC following the GOLD patternBTC following the Gold pattern, but it actually makes sense.
1. Test of the mean.
2. The retest to see if it can hold the mean.
3. Price stalls before it gets too bearish, participants weary of a bear market.
4. The test of the mean from below, which holds, followed by the tests of the upper bands to push the market into a bullish sentiment. It's looking successful short term, prices are driven higher.
The first sign of weakness is the breach, with candle close, of the upper middle band on the 12th July 2019 for BTC and around 10th August 1987 for Gold.
5. BTC/Gold fails to hold the upper lowest band (1.25 multiplier), price falls to the mean, trades under the mean, trades above the mean in a narrow range, fails to do anything significant at all, dumps.

BTCUSD - Possible Trend Pattern FoundHello guys,
I believe I have found a possible pattern which may play out over May, and will possibly take Bitcoin on a path to over $10,000.
I have also attached a fib retracement guide, which matches up perfectly with the bottoms of the following trend.
Let's see how this plays out.
remember,
Patience is Paramount!
-
Once I get over 10 upvotes, I will post an update.
