Bitcoin still ranging just under ATH line but be RealisticQuick post to show you very simply that the Odds are against a push above that Blue ATH right now.
The chance of a Dip is higher than the chances of a push higher.
That does not mean to say it will not happen, just be ready in case it does not happen
Charts do not lie.
Bitcoinprediction

W pattern off the handle. #Bitcoin to 168K.From my most recent post of the Cup & Handle I see a W pattern. Price broke out of the handle to retest to confirm support creating a double bottom.
This is a very good sign to confirm the C&H for this bullish near future.
If we continue upwards and break the psychological resistance zone at 111K, I expect 168K within 3-6 months.
I attached the Cup and Handle analysis to the current.

Bitcoin (BTC)and NASDAQ: Intermarket Analysis and the Road AheadIn this four-hour BTCUSD chart, Bitcoin is currently consolidating within a symmetrical triangle pattern ⏳. The price is oscillating between a series of lower highs and higher lows, with the most recent swing high and swing low serving as key reference points for traders. This pattern reflects a market in indecision, awaiting a catalyst for a breakout.
Volume has picked up as price approaches the previous low, suggesting that buyers are stepping in to defend this area, rather than capitulating.
The next significant move will likely be determined by whether price can break above the last swing high or fall below the last swing low. A breakout above the previous high could open the door for a renewed uptrend, while a breakdown below the previous low may signal a deeper correction.
Geopolitical & Fundamental Backdrop 🌍
Bitcoin’s current consolidation is happening against a backdrop of heightened macro and geopolitical uncertainty. Recent global events, such as tensions in the Middle East and shifting US economic data, have contributed to increased volatility across risk assets. Institutional interest in Bitcoin remains strong, and the asset continues to be viewed as a hedge against inflation and currency debasement. However, short-term sentiment is sensitive to headlines and policy shifts.
NASDAQ & Correlation with Bitcoin 📈
The NASDAQ and Bitcoin remain closely correlated, especially during periods of heightened risk-on or risk-off sentiment. The NASDAQ has recently been consolidating after a strong rally, with price action also defined by a series of lower highs and higher lows. The index’s outlook is currently neutral to cautiously bullish, mirroring Bitcoin’s technical structure. If the NASDAQ can break above its recent high, it could provide a tailwind for Bitcoin and other risk assets. Conversely, a move below the last swing low in equities could trigger further caution in crypto markets.
Summary & Outlook 🚦
BTCUSD is at a pivotal juncture, with the next move likely to be determined by a break above the previous high or below the previous low on the four-hour chart.
Macro and geopolitical factors are creating short-term volatility, but the long-term structure remains constructive as long as the broader uptrend of higher lows is maintained.
The NASDAQ’s consolidation and its correlation with Bitcoin suggest that risk sentiment in equities will continue to influence crypto. Watch for confirmation from both markets before taking a directional bias.
Disclaimer:
This analysis is for informational purposes only and does not constitute financial advice. Cryptocurrency and stock markets are highly volatile and subject to rapid change. Always do your own research and consult with a financial advisor before making investment decisions.

Bitcoin Bounce & Breakout PlayChart Analysis:
🔹 Support Holding Strong:
BTC is respecting a key support area (~$105,600), which previously acted as resistance (marked by recent ATH).
🔹 EMA 70 (Blue Line):
Price is hovering above the EMA, adding bullish confirmation.
🔹 Bullish Projection Path:
The chart shows a projected bullish move toward the sell zone near $113,200 – $113,300, representing a potential 4.4% gain from the breakout.
🔹 Key Zones:
Support Zone: $105,600
Supply Zone: $100,500
Sell Zone (TP Zone): $113,200+
📌 Outlook:
If BTC breaks and holds above the resistance (~$107,000), a strong upward rally could follow. Entry near support or on breakout, with tight risk management, offers a favorable risk/reward.
✅ Entry Options:
Breakout Entry:
Trigger: Break and close above $107,200
Confirmation: Retest and hold above the breakout zone
Entry: $107,300 – $107,500
Support Bounce Entry:
Trigger: Pullback to support zone (~$105,600) with bullish reversal candle
Entry: $105,600 – $105,800
🎯 Target Zones (TP):
TP1: $110,400 (minor resistance)
TP2: $113,200 – $113,300 (major sell zone)
TP3 (aggressive): $114,000+
🔻 Stop Loss (SL):
For breakout entry: SL below $106,200
For bounce entry: SL below $105,200 or $104,800 (structure break)
📈 Risk–Reward Ratio:
Approx. 1:2.5 to 1:3+ depending on entry and target
🧠 Trade Management:
Move SL to breakeven after hitting TP1
Partial profit booking at TP1
Trail remaining with manual or dynamic SL (e.g., below EMA or recent low)
⚠️ Risk Notes:
Avoid chasing price without breakout confirmation
Watch for fakeouts and heavy selling near TP zones
Adjust position size based on your risk tolerance

BTC “Golden Cross” Looms, but Geopolitics Could Delay ItBitcoin’s “Golden Cross” Looms, but Geopolitical Shocks Could Delay the Breakout
Deep dive into price action, derivatives, on-chain data, and the tug-of-war between Middle-East risk and crypto bull-run momentum
________________________________________
Table of Contents
1. Executive Summary
2. Scene-Setter: BTC at $105 K in a World on Edge
3. Technical Spark: What a Golden Cross Really Means
4. Price Action: From $103 K Dip to $106.8 K Hurdle
5. Options Market: A Sudden Lurch Toward Puts
6. Macro Overhang: Why Israel–Iran Turmoil Matters to Bitcoin
7. On-Chain Pulse: 656 % Cycle Gain, Yet Supply Is Tighter Than 2021
8. Mining Fundamentals: Difficulty Eases, Margins Improve
9. Corporate Treasuries: The Quiet, Sticky Bid
10. Targets & Scenarios: $97 K Downside vs. $229 K Upside
11. Strategy Playbook for Traders & Investors
12. Conclusion: Delayed, Not Derailed
13. Disclaimers
________________________________________
1. Executive Summary
• Bitcoin (BTC) is trading in a tight $103 K–$108 K band, unable to confirm a breakout as Middle-East tensions push investors into hedging mode.
• A Golden Cross—the 50-day SMA crossing above the 200-day—could flash within 10 trading sessions, historically adding +37 % median upside over the subsequent 90 days.
• Options flow has flipped decisively toward puts, with the 25-delta skew hitting –10 %, its most bearish since the FTX collapse, signaling short-term anxiety even as long-term bets remain bullish.
• On-chain metrics (exchange balances at six-year lows, HODLer supply at all-time highs) reveal structural demand; Glassnode notes a 656 % cycle advance despite a trillion-dollar market cap.
• Analysts’ upside targets range from $140 K (Q3) to $270 K (October) and even $229 K based on the Golden Cross fractal. Yet a clean break of $104 K support opens room to $97 K first.
________________________________________
2. Scene-Setter: BTC at $105 K in a World on Edge
Bitcoin entered 2025 with a blistering rally—spot ETFs hoovered nearly 200 K coins in four months, miners sold aggressively into strength, and macro tailwinds (Fed easing, USD weakness) fueled risk appetite. Then two macro curveballs hit:
1. Sticky U.S. core inflation revived “higher-for-longer” rate fears.
2. Israel–Iran hostilities spooked global markets, sending Brent crude to $76 and sparking a dash for USD liquidity.
BTC, once heralded as “digital gold,” behaved like a high-beta tech stock: it slipped 7 % in 48 hours, tagging $103,200 before bargain hunters stepped in. As of this writing, price sits near $105,800—right on the 100-hour SMA. Whether we escape the range depends on which force proves stronger: geopolitical dread or the long-term structural bid.
________________________________________
3. Technical Spark: What a Golden Cross Really Means
A Golden Cross occurs when the 50-day simple moving average (SMA-50) crosses above the 200-day (SMA-200). In Bitcoin’s 14-year history, we have logged nine such events:
Year Days to Cross 90-Day Return 180-Day Return
2013 51 +88 % +202 %
2015 73 +34 % +67 %
2019 46 +193 % +262 %
2020 38 +77 % +112 %
2023 59 +29 % +48 %
Median 90-day gain: +37 %
Median drawdown post-cross: –12 %
We are ~$700 shy of triggering the cross (SMA-50 at $97.9 K, SMA-200 at $98.1 K and rising). Assuming volatility stays muted, the lines converge within two weeks, potentially firing a widely watched buy signal. But remember: the cross is lagging; smart traders anticipate, not react.
________________________________________
4. Price Action: From $103 K Dip to $106.8 K Hurdle
Key intraday levels (Kraken feed):
• Support 1: $104,000 – prior weekly low + bullish order-block
• Support 2: $101,200 – 0.786 Fib retrace of the Feb–Mar impulse
• Bear Pivot: $97,000 – 200-day EMA + high-confluence volume node
• Resistance 1: $106,800 – last week’s swing high; three failed probes
• Resistance 2: $108,500 – May monthly open
• Bull Pivot: $113,000 – neckline of the March distribution range
Monday’s bounce broke a declining trend-line from $110 K, printing a higher low—constructive, yet bulls require a daily close >$106.8 K to invalidate the short-term bearish structure.
________________________________________
5. Options Market: A Sudden Lurch Toward Puts
Deribit data (largest BTC options venue):
• Put/Call Ratio: 0.62 last Friday → 0.91 today
• 25-Delta Skew (1-month): –10 %, lowest since Nov-2022
• Max-Pain for April 26 expiry: $104 K (huge open interest)
Translation: traders rushed to buy protective puts as Iran war headlines crossed. Market-makers, short those puts, delta-hedged by shorting spot or perpetual futures, adding downward pressure—classic gamma feedback loop.
Yet term structure remains contango; June and September IVs price higher topside. Institutions appear to sell near-dated panic, accumulate long-dated calls—a bullish medium-term stance.
________________________________________
6. Macro Overhang: Why Israel–Iran Turmoil Matters to Bitcoin
1. Risk-Off Correlation: Despite “digital gold” narratives, BTC’s 30-day correlation with the Nasdaq-100 sits at 0.64; equities slide → crypto follows.
2. USD Liquidity Drain: War premium lifts oil, stoking inflation and forcing the Fed to delay cuts; higher real yields pressure non-yielding assets.
3. Regulatory Optics: Heightened national-security chatter emboldens lawmakers keen to scrutinize crypto, a perceived sanctions-evasion channel.
4. Regional Flows: The Middle-East hosts some of the largest sovereign-wealth pools; risk aversion could pause their crypto allocations.
5.
Hence, every missile headline becomes a volatility catalyst. Still, flash-risk events fade quickly if energy supply stays intact, offering windows for BTC to re-assert its secular trend.
________________________________________
7. On-Chain Pulse: 656 % Cycle Gain, Yet Supply Is Tighter Than 2021
Glassnode frames Bitcoin’s ongoing bull as “one of the most explosive relative to market cap gravity.” Highlights:
• Cycle Return: 656 % from the $14 K November-2022 bottom—impressive given the asset is now >$2 T in free-float value, dwarfing 2017’s sub-$100 B base.
• Exchange Balances: Just 2.02 M BTC on centralized venues—13-year low.
• Realized Price (short-term holders): $92,500—suggests marginal buyers remain well in profit.
• Entity-Adjusted Dormancy Flow: At 275 K BTC/day vs. 2021’s 550 K—implying HODLers are less willing to spend.
Put simply: even after a seven-fold rally, supply scarcity persists.
________________________________________
8. Mining Fundamentals: Difficulty Eases, Margins Improve
The April 20 adjustment saw difficulty dip 1.2 %, the first contraction since January. Why it matters:
• Post-Halving Breathing Room: Block subsidy fell to 1.5625 BTC; a difficulty rollback cushions miner profit margins, lowering forced selling risk.
• Hashrate Plateau: Network hashrate hovers at 640 EH/s, only 3 % off the ATH—miners remain confident.
• Transaction Fees: Average fee per block = 0.37 BTC, still elevated by historical standards thanks to BRC-20 activity.
Miners thus appear cash-flow stable, reducing downside pressure on spot markets compared to previous post-halving eras.
________________________________________
9. Corporate Treasuries: The Quiet, Sticky Bid
Since MicroStrategy cracked the dam, 68 public companies now hold BTC on balance sheets, totaling 412,000 coins (~$43 B). Recent newcomers:
Company Purchase Date BTC Added Avg Cost
SemiconX Feb-2025 2,500 $94,800
Nordic Logistics Mar-2025 800 $98,200
Atlantech Energy Apr-2025 1,200 $101,500
Traits of corporate treasuries:
• Long-Dated Liabilities: Align with Bitcoin’s four-year halving cadence.
• Low Turnover: None of the 68 have sold core holdings despite 80 % drawdowns in 2022.
• Regulatory Transparency: SEC filings broadcast purchases, inviting copycat demand.
This sticky bid stabilizes spot markets during macro squalls.
________________________________________
10. Targets & Scenarios: $97 K Downside vs. $229 K Upside
Bearish Path (30 % probability)
• Trigger: Israel–Iran broadens, Fed signals no cuts in 2025.
• Price Action: Break $104 K, bulls capitulate at $97 K (200-day).
• Depth: Could wick to $88–90 K (0.618 retrace) if macro gloom persists.
Base Case (50 % probability)
• Trigger: Skirmishes contained; oil cools, Fed cuts twice by December.
• Price Action: Golden Cross confirms, BTC grinds to $128 K by September.
• Highs: $140 K tap as ETF inflows resume.
Bullish Path (20 % probability)
• Trigger: Middle-East cease-fire + ETF FOMO round two + dovish Fed pivot.
• Fractals: Prior Golden-Cross extensions averaged +120 % at extreme.
• Price Action: $150 K by summer, $229 K (Fib 2.618 from 2022 low) by year-end.
• Blow-Off: $270 K October spike before the next cyclical bear begins.
________________________________________
11. Strategy Playbook for Traders & Investors
Horizon Bias Instruments Risk Management
Intraday (0–48 h) Range scalp $104–$107 K Perp futures (5× max), options gamma scalping Hard stop $103 K; position <1 % equity
Swing (2–8 wks) Buy pullbacks ahead of Golden Cross Spot, dated futures roll, 1-month $110 K calls Stop $97 K daily close; size 5–10 %
Position (3–6 mo) Accumulate for $140–150 K target Spot, June/Sept call spreads ($120/150) Hedge via 25 % put collar
Long-Term (1–4 yr) Maintain core stash; ignore noise Cold storage, DCA Re-balance only when price doubles
Optional hedge: Long Gold / Short BTC ratio spread as a geopolitical shock absorber; ratio 1.3 currently, mean-reverts to 1.1 post-crises.
________________________________________
12. Conclusion: Delayed, Not Derailed
Bitcoin stands at a crossroads: a textbook Golden Cross beckons, ETF inflows smolder, miners relax, and corporate treasuries drip-feed demand. Yet war headlines and a cautious options market act as sandbags on the balloon. History says macro shocks slow, not stop secular bull cycles. Unless Middle-East conflict strangles global liquidity or the Fed slams the brakes far harder than priced, BTC’s higher-time-frame structure remains bullish. Expect turbulence, embrace risk controls—but don’t mistake a weather delay for a busted engine.
________________________________________
13. Disclaimers
This article is for educational purposes only and does not constitute financial advice. Cryptocurrency investing involves substantial risk; never invest more than you can afford to lose.

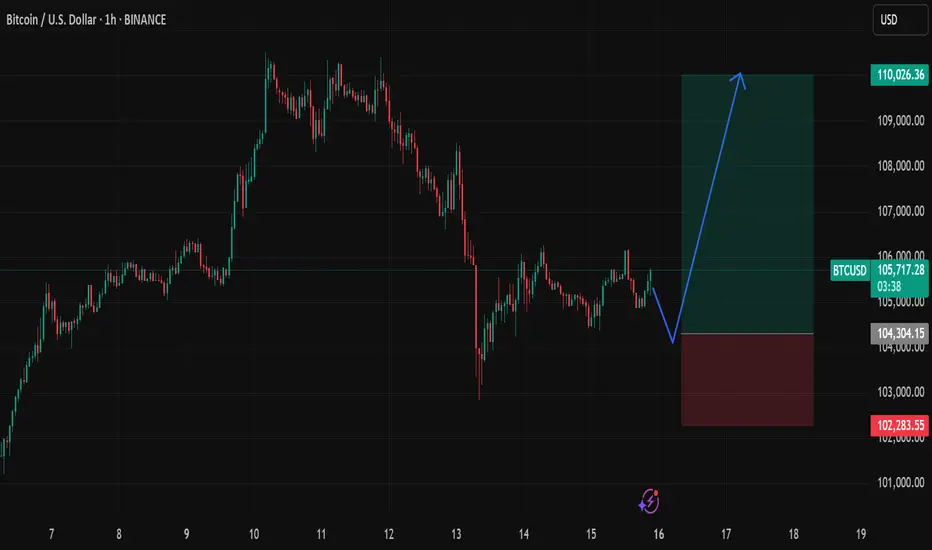
Waiting for a short-term BTC buy — easy setup, clean trade.No need for words — just follow the arrow and check the risk/reward.
I'm starting a signal room soon, but for now, it's all free. Watch and decide for yourself.
BTCUSD 1H levels updated 6/14/25I observe a market structure shift to the downside. Will it continue to the PDH?

Bitcoin Prediction Update - BTC Crashed as expected! What’s nextBitcoin Crashed as Predicted! I am updating the current price action of CRYPTOCAP:BTC , and if we can reach our main target of $93K! Smash the Rocket Button if you did not completely hate this update! See you very soon again!

Signs of manipulation or ‘trapping’ behavior!Bitcoin (BTC) is currently approaching a key support level on the chart. This support zone is an area where price has historically shown a tendency to hold or bounce back upward due to increased buying interest. At this stage, there is a possibility that BTC could initiate a bullish move or a price pump from this level. However, it’s important to be cautious, as the market could also exhibit signs of manipulation or ‘trapping’ behavior.
In such scenarios, what often happens is that before making an actual upward move, the market might perform a ‘fake move’—this means it could temporarily dip below the support level or show some downward pressure to shake out weak hands or trigger stop-losses. This false breakdown creates panic and uncertainty, only for the price to reverse and then begin moving upward shortly afterward.
If the support holds and buyers step in with enough strength, BTC could gain bullish momentum and head toward the upper liquidity areas. These zones typically have a high concentration of pending orders (such as stop-losses or take-profits), which can attract the price like a magnet. This liquidity often sits just above recent highs or resistance levels, and reaching this area could result in further volatility.
However, traders are strongly advised to remain vigilant and not rely solely on assumptions. The crypto market is highly unpredictable, and price action can be deceptive. Always perform your own in-depth analysis, consider various technical and fundamental factors, and manage your risk wisely.
This is not financial advice please Do Your Own Research (DYOR) before making any trading decisions.

BTC/USDT Analysis: Local Downtrend
Hello everyone! This is a daily analysis from a trader-analyst at CryptoRobotics.
Yesterday, despite a positive chart structure, Bitcoin broke out of the accumulation zone to the downside. This move was influenced by the escalation of the conflict in the Middle East and extreme FOMO among retail traders.
The main expectation is a decline toward the nearest buyer zone at $105,800–$104,500 (accumulated volumes), where we will look for long entry opportunities. This zone is very strong and is likely to hold with a 90% probability. An additional confirmation is the presence of predictive liquidations of long positions within this zone, which could serve as fuel for a reversal.
During the decline, two new resistance zones were formed. In the short term, short positions from these areas can be considered until the support is tested.
Sell Zones:
$107,900–$108,500 (strong seller activity)
$109,000–$110,000 (accumulated volumes)
Buy Zones:
$105,800–$104,500 (accumulated volumes)
$101,600–$100,000 (zone of previous pushing volumes + current buyer defense)
$98,000–$97,200 (local support)
Level at $93,000
$91,500–$90,000 (strong buying imbalance)
This publication is not financial advice.

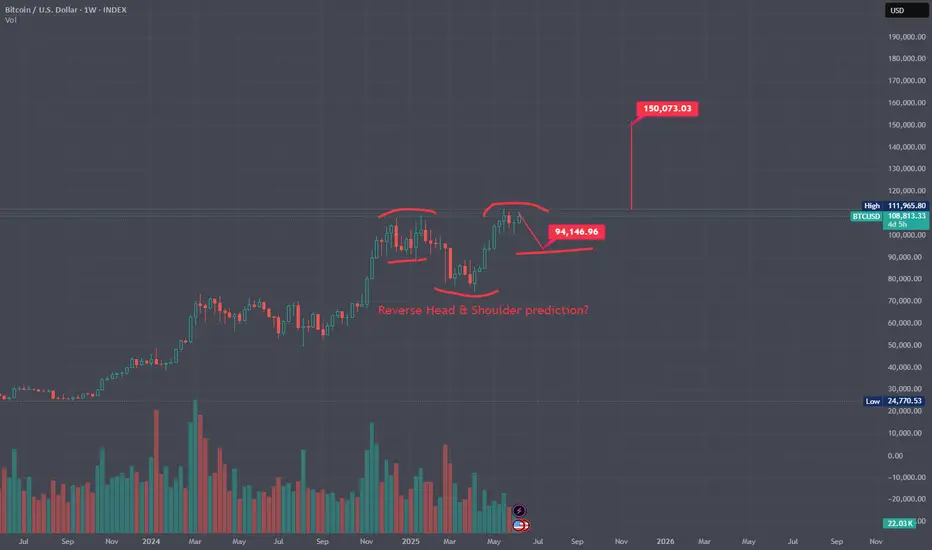
Reverse head & shoulder pattern setup for $BTC ?Potential movements in the charts for Bitcoin the next few weeks.
Will be exciting to see if this potential reverse head & shoulder plays out or if it does...
Fingers Crossed!
₿ Bitcoin: Further Upside ExpectedBitcoin (BTC) pulled back slightly in yesterday’s session but remains on track to continue its corrective rally within green wave B. In line with our primary scenario, this advance is expected to reach the blue Target Zone between $117,553 and $130,891. Afterward, we anticipate the onset of wave C, which should initiate a substantial decline—driving the price down into the lower blue zone between $62,395 and $51,323. This is also where we expect orange wave a to conclude. From there, wave b should provide a temporary rebound before wave c resumes the broader downtrend, ultimately completing blue wave (ii). That said, there’s still a 30% probability that blue wave alt.(i) has not yet topped. In this alternative scenario, BTC would extend higher, potentially breaking above resistance at $130,891 before the corrective phase resumes. The daily chart illustrates the entire five-wave blue sequence and shows our expected low for wave (ii) within the blue zone between $37,623 and $26,082.
📈 Over 190 precise analyses, clear entry points, and defined Target Zones - that's what we do.

BTC/USDT Analysis: Unproductive Selling Pressure
Hello everyone! This is a daily analysis from a trader-analyst at CryptoRobotics.
Yesterday, Bitcoin once again tested the sell zone at $110,000–$110,600 (profit-taking by a large player) and moved into another correction.
Looking at the current accumulation, we’ve noticed strong market selling pressure that so far hasn't led to any significant result. The seller’s momentum is weak, so most likely we’ll see another upward impulse and a test of the all-time high (ATH).
Buy Zones:
$105,800–$104,500 (accumulated volumes),
$101,600–$100,000 (zone of previous pushing volumes + current buyer defense),
$98,000–$97,200 (local support),
Level at $93,000,
$91,500–$90,000 (strong buying imbalance).
This publication is not financial advice.

Bitcoin Near Breakout – CPI Miss Could Be the Catalyst?Just Released: Key U.S. Inflation Data:
Core CPI m/m: 0.1% (vs. 0.3% forecast)
CPI m/m: 0.1% (vs. 0.2% forecast)
CPI y/y: 2.4% (vs. 2.5% forecast)
Market Reaction & Outlook:
The softer-than-expected inflation figures suggest easing price pressures in the U.S. economy — a potential bullish signal for risk assets, such as Bitcoin ( BINANCE:BTCUSDT ).
-----------------------------
Now let's take a look at the Bitcoin chart on the 1-hour time frame .
Bitcoin is trading in the upper part of a Heavy Resistance zone($104,380-$103,670) and is trying to break through this zone. The announcement of US indexes could be a trigger for a breakout of this zone .
In terms of Elliott Wave theory , Bitcoin appears to be completing microwave 4 of the main wave 3 . The structure of microwave 4 is a Double Three Correction(WXY) .
I expect Bitcoin to start rising from the Potential Reversal Zone(PRZ) and near the Support line again and rise to at least $110,670 and if the Heavy Resistance zone($104,380-$103,670) is broken we should expect new ATHs in the coming days .
Cumulative Long Liquidation Leverage: $108,791-$107,887
Cumulative Long Liquidation Leverage: $106,840-$105,457
Cumulative Short Liquidation Leverage: $111,381-$110,568
Note: If Bitcoin falls below $105,700(Worst Stop Loss(SL)), we should expect further declines.
If you want to know my weekly analysis about BTC , I suggest you check out the following idea:
Please respect each other's ideas and express them politely if you agree or disagree.
Bitcoin Analyze (BTCUSDT), 1-hour time frame.
Be sure to follow the updated ideas.
Do not forget to put a Stop loss for your positions (For every position you want to open).
Please follow your strategy and updates; this is just my Idea, and I will gladly see your ideas in this post.
Please do not forget the ✅' like '✅ button 🙏😊 & Share it with your friends; thanks, and Trade safe.

BITCOIN SHORT TERM UPDATE!!! Recently we have seen a great price move from 100K to 110K. We got clear Change Of Character , which indicates a sign of strength. Also we got bearish cypher harmonic pattern formed. So now we can expect a slight pullback up to 106-103k region from there we may see price reversing. But price should hold 100.3K region to remain bullish in short term.

Do technical signals show Bitcoin’s path to $130K? Do technical signals show Bitcoin’s path to $130K?
Bitcoin briefly pushed above $110,000 for the second time this month, before pulling back slightly to trade around $109,500. The market consolidating just below the 61.8% Fibonacci extension level could be suggesting strong resistance is being tested near current levels.
Bitcoin remains within reach of its all-time high at $111,965, set on May 22.
The latest upward move may have been supported by comments from U.S. Commerce Secretary Howard Lutnick, who said trade talks with China in London were progressing well and likely to extend for a third day.
CNBC analyst Todd Gordon expects a breakout toward $130,000 according to his weekly chart analysis. According to our chart, A breakout above 111,897 could open the path to the 78.6% extension around $122,093, followed by the 100% extension target at $135,081

₿ Bitcoin: Push to the Upside! Bitcoin has made a significant push to the upside, which brought it closer to the upper blue Target Zone between $117,553 and $130,891, where we primarily expect the corrective rise of green wave B to conclude. We consider this price range an opportunity to take partial profits or to open short hedges for tactical protection of existing long positions — thus, we don't plan to sell all our Bitcoin holdings there. Potential short hedges could be secured with a stop 1% above the upper edge of the zone since there's a 30% chance that price could exceed this zone to develop a new high for blue wave alt.(i) before reversing later. Primarily, however, green wave C should commence in the upper blue zone and drive BTC down into the lower blue zone between $62,395 and $51,323—and thus to the low of orange wave a.
📈 Over 190 precise analyses, clear entry points, and defined Target Zones - that's what we do.

$BTC - Top Down BYBIT:BTCUSDT.P Top Down (10/06/25)
V-Levels Bias
Weekly = Bullish
Daily = Bullish
10-Hour = Bullish
1-Hour = Bullish
V-Levels Momentum
Weekly = Bullish
Daily = Bullish
10-Hour = Neutral
1-Hour = Neutral
Analysis & Insights
DeCode Market Breakdown
Macro Context
Overall, the Weekly structure remains bullish — both in bias and momentum. We’re trading below a key level at $111,968.0, and continuation is likely unless we see a clear Failed Auction at that level.
That would trigger some serious red flags and force a reevaluation of the directional bias.
Daily Chart
Daily structure is extremely bullish at the moment.
The price recently showed a Failed Auction around the $102,000.0 V-structure Higher Low — indicating aggressive absorption and buyer strength.
As long as price holds above that area, the priority is to stay on the long side.
⸻
10-Hour Chart
Still holding a bullish structure overall.
One thing I’ll be watching closely: the price reacting to the previous High at $110,660.8.
If we get a rejection + Failed Auction at that level, that opens up the possibility for intraday shorts; as a short-term shift in momentum and local resistance kicks in.
1-Hour Chart
📈 Long Setup: Waiting for a clean entry from an OTE / Fib zone + Over/Under structure.
📉 Short Setup: Watching for a sweep of the current highs + a clear Failed Auction (ideally with footprint confirmation).
There’s visible compression between $104k and $105k, so price might look to grab liquidity there first before any real move upward.
10-Min Chart
Currently, no clear trade setups on the 10M.
The 1H hasn’t reached optimal trade zones yet. I’ll be watching closely for any structure shifts or setups aligning with the macro bias.
⸻
🔍 Trading Plan Summary
Bias: Bullish (Weekly + Daily)
Look for longs aligned with HTF support + intraday confirmation
Short opportunities only if we get clear rejection from $110,660.8 + footprint signals

Bitcoin Rally Overextended: Patience is Key for the Next Move💹 BTC/USDC – Bullish Outlook, heres my Trade Plan.
Bitcoin (BTC/USDC) is currently maintaining a strong bullish trajectory 🚀, showing impressive momentum after breaking through recent resistance levels 🔓.
However, price is now overextended from the last swing low, and I’m anticipating a pullback into value 🔄 — specifically targeting the 50%–61.8% Fibonacci retracement zone drawn from the latest swing low to swing high 📐. This zone often acts as a rebalancing point for institutional traders and provides confluence for smart entries 🎯.
I’ll be closely watching this retracement area for signs of support forming, and more importantly, a bullish break in market structure 🧠📊. Only after that confirmation, would I consider executing a long position — no structure break, no trade ✅.
This isn’t about predicting — it’s about reacting with discipline.

Bitcoin: The Final Distribution Phase BeginsBTC - "beta test coin" was a great success. Time to release the real true currency.
📊 The chart tells the story, Bitcoin has reached its peak cycle, and the mainstream distribution is underway. 📉 MACD flipping bearish, RSI divergence, and key market phases indicate the shift. 💰 The next evolution of money is coming. Are you ready?
NASDAQ:MSTR NASDAQ:COIN NASDAQ:MARA NYSE:CRCL TVC:GOLD TVC:SILVER CRYPTO:BTCUSD

Bitcoin Approaches Resistance as Momentum Cools: What’s Next?Bitcoin has been on a strong upward trend 🚀, but recent moves show signs of exhaustion as it approaches major resistance zones 🛑. The appearance of a three-drive pattern on the 4-hour chart, suggests the market could be due for a healthy correction 🔄. While the broader trend remains bullish, I'm watching for a potential pullback and then looking for renewed strength (bullish BoS) before considering new long positions. Patience and confirmation are key in these conditions! 👀✨

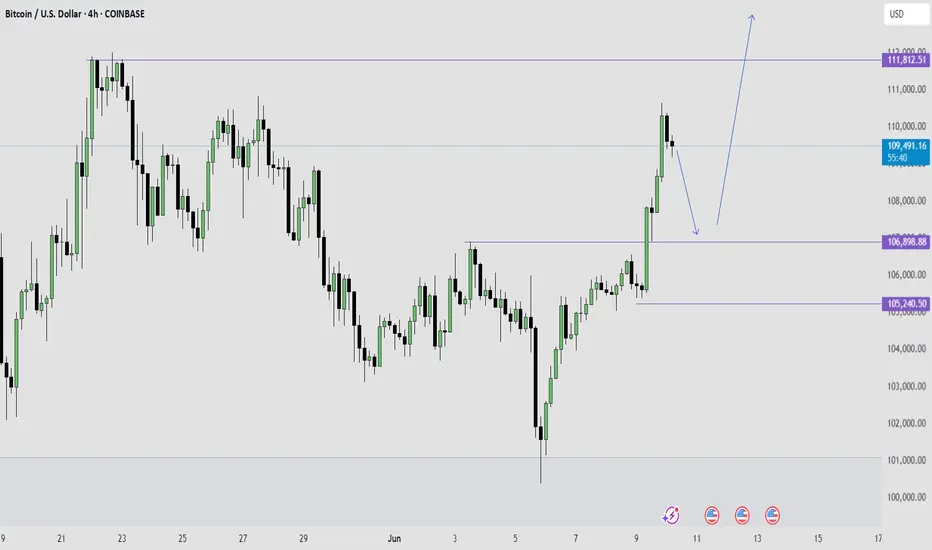
Bitcoin is Super Bullish Right Now - Here is my BTC trade planSince Bitcoin is super bullish on monthly and weekly time frame, my focus is to trade trend continuation pull backs on the 4HR time frame.
For this particular trade, I want to see a pull back to a key level of either imbalance or the old high serving as new support for price.
I will be taking a bullish trend continuation setup on that 4HR pull back.
Target:
I expect to see Bitcoin break that all time high of 111k level and go as high as 150k per one.
Bitcoin Price: HODL Mode Fuels $140K ATH PushBitcoin, the pioneering cryptocurrency, is once again at the forefront of financial discussions, exhibiting a remarkable display of resilience and strength that points towards an imminent surge to uncharted price territories. The current market narrative is dominated by several compelling indicators: a significant increase in long-term holders, a climbing realized capitalization, the inherent stability provided by its difficulty adjustment mechanism, and a pervasive return to "HODL mode" among investors. These factors, combined with recent price action and expert analyses, suggest that Bitcoin is not just preparing for new all-time highs but is solidifying its position as a mature and indispensable asset in the global financial landscape.
Long-Term Holders Strengthen Their Grip: A Foundation for Future Growth
One of the most telling indicators of Bitcoin's underlying strength and investor conviction is the behavior of its long-term holders (LTHs). These are addresses that have held their Bitcoin for an extended period, typically over 155 days, signaling a strong belief in its future value rather than short-term speculation. Recent data reveals a significant uptick in the number of these steadfast investors, indicating a profound shift in market sentiment. This trend is critical because it removes a substantial portion of the circulating supply from immediate selling pressure, creating a scarcity that naturally supports price appreciation.
The "HODL mode" phenomenon, a term coined from a misspelling of "hold" in a 2013 forum post, perfectly encapsulates this behavior. It describes the strategy of buying and holding cryptocurrencies regardless of price fluctuations, driven by a long-term bullish outlook. The return of this "HODL mode" is not merely anecdotal; it is quantifiable through on-chain metrics. When long-term holders accumulate and resist selling, it signifies a collective conviction that current prices do not reflect Bitcoin's true intrinsic value or future potential. This behavior creates a strong psychological floor for the price, as fewer coins are available for sale on exchanges, making it harder for large sell-offs to occur.
Complementing this, Bitcoin's Realized Cap has been climbing to uncharted territory. The Realized Cap is a variation of market capitalization that values each Bitcoin at the price it was last moved on-chain, rather than its current market price. It essentially represents the aggregate cost basis of all coins in circulation. When the Realized Cap climbs, especially to new all-time highs, it indicates that a significant amount of Bitcoin has been acquired at higher prices and is being held, suggesting that the overall market is holding onto its coins with stronger conviction. This metric serves as a robust measure of the network's fundamental value and the collective cost basis of its investors. Its ascent to new peaks underscores the increasing capital flowing into Bitcoin and the growing confidence among those holding it. This phenomenon is often observed during bull markets, as new capital enters the ecosystem and existing holders refuse to sell, signaling a healthy and maturing market.
The strengthening grip of long-term holders and the rising Realized Cap collectively paint a picture of a market that is fundamentally sound and poised for sustained growth. It suggests that Bitcoin is moving from a speculative asset to a more mature store of value, attracting investors who are less concerned with short-term volatility and more focused on its long-term potential as a digital asset.
Bitcoin's Difficulty Adjustment: The Engine of Predictable Monetary Policy
One of Bitcoin's most ingenious and often underestimated features is its difficulty adjustment mechanism. This self-regulating system ensures that new blocks are found, and thus new Bitcoin are mined, at a remarkably consistent rate of approximately every 10 minutes, regardless of the total computational power (hash rate) dedicated to the network. Every 2,016 blocks, or roughly every two weeks, the network automatically adjusts the difficulty of the mining puzzle. If more miners join the network, increasing the hash rate, the difficulty increases, making it harder to find the next block. Conversely, if miners leave, the difficulty decreases.
This mechanism is the bedrock of Bitcoin's predictable monetary policy. Unlike traditional fiat currencies, whose supply can be arbitrarily increased by central banks, Bitcoin's supply schedule is immutable and transparent. The difficulty adjustment ensures that the issuance of new Bitcoin remains consistent until the total supply of 21 million coins is reached. This predictability is a cornerstone of Bitcoin's value proposition as a sound money alternative. It eliminates the uncertainty and potential for inflation that plagues fiat currencies, making Bitcoin a reliable store of value over the long term.
The consistent block time and predictable supply schedule, enforced by the difficulty adjustment, contribute significantly to Bitcoin's appeal as a deflationary asset. Investors are drawn to assets with a finite and transparent supply, especially in an era of unprecedented global monetary expansion. This mechanism not only secures the network from external attacks by making it prohibitively expensive to manipulate but also instills confidence in its long-term scarcity and value. It is this algorithmic certainty that underpins Bitcoin's potential to become a global reserve asset, providing a stark contrast to the discretionary policies of central banks.
Why are Bitcoin and Crypto Prices Going Up Today?
The recent surge in Bitcoin and broader cryptocurrency prices can be attributed to a confluence of factors, many of which are interconnected with the underlying strength discussed above. Bitcoin's impressive climb past $107,000 and its break above $108,000 at the start of the week are not isolated events but rather manifestations of building bullish sentiment.
One primary driver is the return of institutional interest and capital inflows. As Bitcoin matures and gains regulatory clarity in various jurisdictions, traditional financial institutions are increasingly comfortable allocating capital to the asset class. This institutional adoption provides significant buying pressure and lends legitimacy to the market. The establishment of Bitcoin ETFs in various regions, for instance, has opened new avenues for institutional investors to gain exposure without directly holding the underlying asset.
Secondly, the macroeconomic environment continues to play a pivotal role. Persistent inflation concerns, coupled with the potential for further quantitative easing by central banks, drive investors towards scarce assets like Bitcoin as a hedge against currency debasement. The narrative of Bitcoin as "digital gold" gains traction during periods of economic uncertainty, attracting both retail and institutional capital seeking to preserve purchasing power.
Thirdly, technical indicators are flashing strong buy signals. Bitcoin's weekly chart, for instance, is flexing significant strength. A sustained break above key resistance levels, such as the $108,000 mark, often triggers further buying as traders and algorithms recognize the bullish momentum. The return of "HODL mode," as evidenced by the behavior of long-term holders, further reduces selling pressure, allowing prices to climb with less resistance. This combination of fundamental strength and technical breakouts creates a powerful upward spiral.
Finally, anticipation of future events also fuels price rallies. The upcoming June 11 CPI report, for example, is being closely watched by analysts. Inflation data can significantly impact market sentiment, and a favorable report (e.g., lower-than-expected inflation) could signal a more dovish stance from central banks, potentially leading to increased liquidity and risk-on appetite, which benefits Bitcoin. An analyst has even suggested that the Bitcoin price could "explode" after the CPI report, indicating the market's sensitivity to such macroeconomic releases.
Bitcoin Chart Pattern, Return of ‘HODL Mode’ Point to Imminent All-Time BTC Price High
The technical analysis of Bitcoin's price charts, combined with on-chain data indicating a return to "HODL mode," strongly suggests that an imminent all-time high (ATH) is on the horizon. Chart patterns are crucial tools for traders and investors to identify potential future price movements based on historical data. When Bitcoin breaks above significant resistance levels, especially after a period of consolidation, it often signals the start of a new upward trend. The recent break above $108,000 is a prime example of such a breakout, indicating that the market has absorbed previous selling pressure and is now ready for higher valuations.
The "HODL mode" phenomenon, as discussed earlier, is a powerful fundamental indicator that reinforces technical signals. When a large proportion of the circulating supply is being held by long-term investors who are unwilling to sell, it creates a supply shock. This reduced selling pressure means that even moderate buying interest can lead to significant price increases. This is particularly true when new capital enters the market, as it encounters a much thinner order book on the sell side. The confluence of a bullish chart pattern and the return of "HODL mode" creates a self-reinforcing cycle: technical breakouts encourage more HODLing, which in turn reduces supply and facilitates further breakouts.
Analysts are increasingly confident that these combined factors point to an imminent all-time high for BTC. The previous all-time high serves as a psychological and technical barrier, but once breached, it often transforms into a new support level, paving the way for further price discovery. The current market structure, characterized by strong accumulation by long-term holders and a clear upward trajectory on the charts, suggests that the path of least resistance for Bitcoin is upwards.
Bitcoin Weekly Chart Flexes Strength—Is The Moonshot Just Getting Started?
Looking at Bitcoin's weekly chart provides a broader perspective on its long-term trend and current momentum. The weekly chart smooths out daily volatility, revealing more significant patterns and trends. Currently, Bitcoin's weekly chart is indeed flexing considerable strength, characterized by consistent higher lows and higher highs, strong closing prices, and increasing trading volume during upward movements. This sustained bullish momentum on a longer timeframe suggests that the current rally is not a fleeting pump but potentially the beginning of a more substantial "moonshot."
The term "moonshot" in crypto parlance refers to a rapid and significant price increase, often to unprecedented levels. While such parabolic moves can be speculative, the current strength on Bitcoin's weekly chart appears to be fundamentally driven. The accumulation by long-term holders, the predictable supply schedule enforced by the difficulty adjustment, and the increasing institutional adoption all contribute to a more sustainable upward trajectory. This is not just about short-term trading gains; it's about a fundamental revaluation of Bitcoin's role in the global financial system.
The question of whether the "moonshot" is just getting started implies that the current price levels are merely a stepping stone to much higher valuations. This perspective is supported by the fact that Bitcoin is still in its relatively early stages of global adoption compared to traditional asset classes. As more individuals, corporations, and even nation-states begin to integrate Bitcoin into their financial strategies, the demand will continue to outstrip the limited supply, fueling further price appreciation. The weekly chart's strength provides a visual confirmation of this underlying bullish narrative, suggesting that the journey to new price frontiers is indeed well underway.
Bitcoin Price Could Explode After June 11 CPI Report, Says Analyst
The highly anticipated June 11 CPI (Consumer Price Index) report is poised to be a significant catalyst for Bitcoin's price action. The CPI is a key economic indicator that measures the average change over time in the prices paid by urban consumers for a market basket of consumer goods and services. It is a primary gauge of inflation, and its release often triggers significant market reactions across all asset classes, including cryptocurrencies.
An analyst's prediction that Bitcoin's price could "explode" after the CPI report highlights the market's sensitivity to inflation data. If the CPI report comes in lower than expected, it could signal that inflationary pressures are easing, potentially leading central banks to adopt a more dovish monetary policy (e.g., interest rate cuts). Lower interest rates reduce the opportunity cost of holding non-yielding assets like Bitcoin, making them more attractive to investors. Conversely, if inflation remains stubbornly high, it could reinforce Bitcoin's narrative as an inflation hedge, also potentially driving its price up as investors seek refuge from fiat currency debasement.
The market's reaction to such reports is often driven by expectations. If the report aligns with or exceeds dovish expectations, it could lead to a surge in liquidity and risk appetite, benefiting Bitcoin. Conversely, an unexpectedly hawkish report could lead to short-term volatility. However, the overarching sentiment among many analysts is that even in a hawkish scenario, Bitcoin's role as a hedge will continue to attract capital. The June 11 CPI report is therefore a critical event that could provide the immediate impetus for Bitcoin's next major price movement, potentially validating the "moonshot" thesis.
Bitcoin Price Will See ‘Short-Term Correction’ Before $140K: Analysts
While the overall sentiment for Bitcoin is overwhelmingly bullish, some analysts predict a "short-term correction" before the price initiates a rally to all-time highs above $140,000. This perspective is not necessarily bearish; rather, it reflects a healthy market dynamic. Corrections are a natural part of any asset's price discovery process, allowing the market to consolidate gains, shake out overleveraged positions, and attract new buyers at slightly lower price points.
A short-term correction typically involves a temporary pullback in price after a significant upward move. This can be triggered by profit-taking from early investors, macroeconomic news, or technical resistance levels. Analysts who foresee such a correction often view it as a necessary reset that builds a stronger foundation for the next leg of the rally. For instance, a drop could see Bitcoin retest key support levels that were previously resistance, confirming their strength before moving higher.
The prediction of a correction before reaching $140,000 suggests that while the long-term outlook is incredibly strong, the path to new all-time highs may not be a straight line. Such a correction could present an excellent buying opportunity for those who missed the initial surge or wish to increase their holdings. It also aligns with the idea of a healthy market that allows for organic growth rather than unsustainable parabolic pumps. The $140,000 target itself is a significant psychological and technical level, and reaching it would mark a substantial milestone for Bitcoin, further solidifying its position as a premier digital asset.
The Return of Altcoin Season: Why Bitcoin Dominance Must Fall To 62%
As Bitcoin continues its ascent, the conversation often shifts to the broader cryptocurrency market, specifically the potential for an "Altcoin Season." Altcoin Season refers to a period when altcoins (cryptocurrencies other than Bitcoin) experience significant price appreciation, often outperforming Bitcoin. For an Altcoin Season to truly kick off, analysts often point to a crucial prerequisite: a decrease in Bitcoin's dominance.
Bitcoin dominance (BTCD) measures Bitcoin's market capitalization as a percentage of the total cryptocurrency market capitalization. Currently, Bitcoin's dominance is relatively high, reflecting its recent strength and the capital flowing into it. However, for altcoins to flourish, capital needs to flow from Bitcoin into other cryptocurrencies. This typically happens when Bitcoin has made significant gains, and investors begin to seek higher returns in riskier, smaller-cap altcoins.
The specific threshold of Bitcoin dominance falling to 62% is often cited as a key indicator for the start of Altcoin Season. When Bitcoin's dominance drops to this level or lower, it suggests that a substantial amount of capital is rotating out of Bitcoin and into altcoins, signaling a broader market rally. This rotation is a healthy sign of market maturation, as it indicates that investors are diversifying their portfolios and recognizing the value proposition of other blockchain projects.
The return of Altcoin Season would signify a broader bullish trend across the entire cryptocurrency ecosystem. It would mean that the value proposition of decentralized finance (DeFi), non-fungible tokens (NFTs), and various Layer 1 and Layer 2 solutions built on other blockchains is gaining traction. While Bitcoin remains the undisputed king, a thriving altcoin market indicates a robust and diversified digital economy. The anticipation of this shift further underscores the dynamic and evolving nature of the cryptocurrency market, where Bitcoin's strength often paves the way for the growth of the entire ecosystem.
In conclusion, Bitcoin stands on the precipice of a new era of growth, driven by a powerful synergy of fundamental strength, technical indicators, and evolving market dynamics. The unwavering conviction of long-term holders, evidenced by a climbing Realized Cap and a pervasive "HODL mode," forms a robust foundation. The predictable monetary policy enforced by the difficulty adjustment mechanism instills unwavering confidence in its scarcity. Recent price surges, fueled by institutional interest and macroeconomic tailwinds, underscore its immediate bullish momentum. While a short-term correction may be on the cards, it is viewed as a healthy precursor to an explosive rally towards and beyond the $140,000 mark. Furthermore, Bitcoin's continued strength is expected to eventually pave the way for an "Altcoin Season," signaling the maturation and diversification of the broader crypto market. For investors and
enthusiasts alike, ignoring Bitcoin's current trajectory would be to miss a pivotal moment in the ongoing digital revolution, as it solidifies its grip on the financial future.
