bitcoin on bearish#BTCUSD price have shown reverse trend which will drop below 106k.
Firstly we await for drop below 109300 for sell, Target 106k, SL 110151
But if prices move above 110151 Firstly then it will reach 110747 which will decline to head bearish.
Bullish is not valid yet.
#BTC
Bitcoinprediction

Market Overview
WHAT HAPPENED?
Last week, Bitcoin updated its historical maximum, after which it entered a correction phase. The price tested the key demand zone of $109,200-$106,500 (volume zone), where it encountered buyer activity: sales were absorbed, and a rebound followed.
WHAT WILL HAPPEN: OR NOT?
At the moment, we’re still in an uptrend. This is evidenced by the unbroken trendline, the reaction during the test of the mentioned zone, as well as the absorption of sales along the delta within it.
In the opposite scenario and moving below the slope and the buyer's zone, we expect a decline to $103,000 and a change in the current trend, at least to the sideways.
Buy Zones:
$109,200–$106,500 (volume area)
$103,200–$102,000 (market sell absorption)
~$100,000 (aggressive buy volumes)
$98,000–$97,200 (local support)
$93,000 (support level)
$91,500–$90,000 (strong buying imbalance)
$88,100–$87,000 (market sell absorption)
$85,500–$84,000 (accumulated volume)
$82,700–$81,400 (volume zone)
$74,800 (support level)
$69,000–$60,600 (accumulated volume)
IMPORTANT DATES
Macroeconomic developments this week:
• Tuesday, May 27, 14:00 (UTC) — publication of the US consumer confidence index for May from the Conference Board (CB);
• Wednesday, May 28, 02:00 (UTC) — announcement of the New Zealand interest rate decision;
• Wednesday, May 28, 18:00 (UTC) — publication of the minutes of the US FOMC meeting;
• Thursday, May 29, 12:30 (UTC) — publication of GDP for the first quarter and the results of initial applications for US unemployment benefits;
• Friday, May 30, 12:00 (UTC) — publication of the US consumer Price Index for May;
• Friday, May 30, 12:30 (UTC) — publication of the basic index of US personal consumption expenditures for April, as well as in comparison with April 2024;
• Saturday, May 31, 1:30 (UTC) — the publication of the index of business activity in the Chinese manufacturing sector for May.
*This post is not a financial recommendation. Make decisions based on your own experience.
#analytics

Short term BITCOIN 4 hour Chart and possible moves
As I rite this, we see PA pushing up under a line of local resistance, and being rejected.
Support is not far below on the old ATH line ( blue Dash) and below that we have the rising trned line at around 107K
So we have support all around but we are heading in to the unknown with this Fib circle that is just ahead of us.
As yet, I do not know what to expect.
Previous 618 Fib circles have rejected PA to some degree and so I will expect at least a dip in Price.
But as the MACD is nicely cooled off and rising Bullish just above Neutral, we certainly have the ability to piush through
So, We enter the unknown today but with Bullish intent and the ability to cope but we do need Caution.

BITCOIN new week open Green - Will we get 8 weeks Green in a row
These are all WEEKLY chart
7 weeks in a row closed Green.
At Time of writing, Bitcoin is around 109800 usd
So Very Bullish and every possibility that this week will also close Green though we are getting near a point of resistance.
If we zoom into the same chart, we can see more detail
We are above the 2.618 Fib extension and we could return to the 103K zone to test this as support. We may need to do this as it has only ever been resistance previously.
We are also very close to a 618 Fib circle.( Blue )
We do not know if this is an area of strong resistance yet but PA is now in the area that we may react to it.
As a result of this Fib circle, we need to be prepared for the possibility of reentering that rising channel,
We may not do that ,The reasons being that PA still has enough strength.
The MACD - or Moving Average Convergence Divergence, is a technical analysis tool used in trading to identify momentum and trend direction.
The 2 vertical lines on the left are the 2021 ATH points, to give a comparison.
In this cycle we have had 2 previous peaks and then the cooling off period from OverBought.
The Cooling off were the periods were BTC PA ranged..
We are currently rising Bullish, with room to move higher but we should be aware that we are in the area that rejected the 2nd ATH in 2021. The daily is in a very similar position but getting choppy.
The RSI - Relative Strength Index, a technical indicator used to understand the momentum of a price trend . The RSI helps signal when to buy and sell in a trending market by identifying overbought or oversold conditions in a security.
Again, the Vertical lines on the left show you the 2021 ATH points as reference.
See how RSI peaks before BTC PA Peaks.
We have not been fully OverBought since March 2024. RSI is rising Bullish with Room to move higher, though, again, note how it is in an area were rejection has occurred previously.
The Mayer Multiple is a ratio used in trading that compares the current market price of an asset, such as Bitcoin, to its 200-day moving average (SMA) price.
This indicator is particularly useful for swing traders to find zones of extreme overbuys and
It is generally considered a bullish indicator when the price is above the long-term moving average ( Yellow ) and bearish when the price is below it, although significant deviations from the moving average can indicate overvaluation or undervaluation.
Again, take note of the vertical lines and were this Mayer Multiple was.
Again, the tendency is that when this Drops, BTC PA has Ranged to cool off and when it crosses above its Average, it leads to a High on the push higher.
And once again, remembering what has been said above, we need to wait to see if this crosses its average or get rejected by it.
But as you can see, the Average is more often used as support amd mpt resistance.
So, in conclusion, I remain Bullish but with a note of Caution till we get a push higher conformed.
We could see a pull back and , if that happens, this maybe the last sensible buying Zone for Bitcoin this time round. The Risk is increasing as more and more coins enter into good profit margins. People may get tempted to sell.
On a longer term , this month has confirmed a very bullish intent and we have one week to go before month end. I will expand on this on 2nd June
This week. we wait and see how Bitcoin will react.
Be Kind to others. The world Needs LOVE

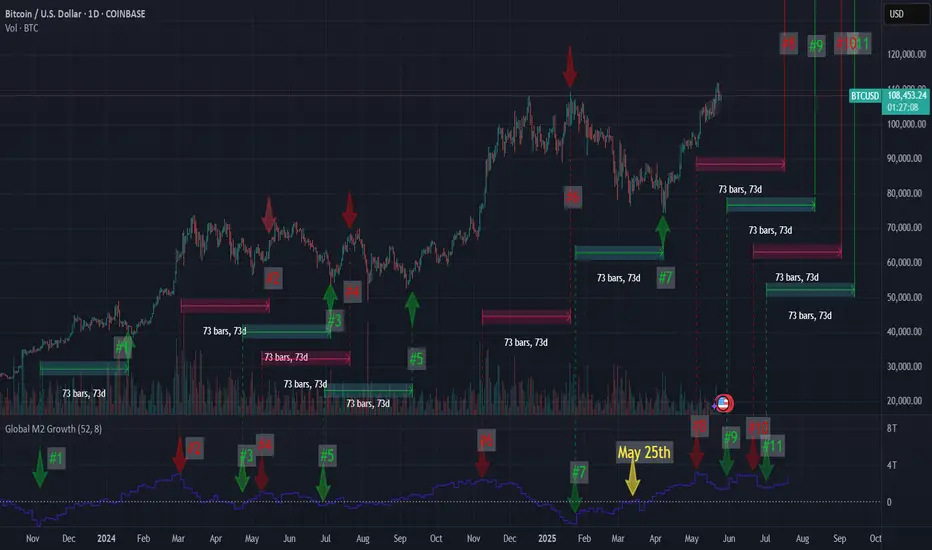
73 days looks to be spot on73 Day Lag to the Global M2 Money Supply looks to be spot on for the last year. If it is, this is good news with the M2 still climbing.
If I am right, we will have a dip within 24 hours of May 28th, only to get another pump to the upside withing 24 hours of June 2nd.
(I tried inputting all this data to Grok in order for him to give me some price targets. They were close to where I think the price will be but using the M2 for price targets still needs some work.)
Bitcoin Weekly SetupShitty market gives shitty options.
Could be a Sweep, a fake Sweep, a similar triple top, an overextended weekly move which needs to cool down a bit.
Funding rates are slowing down/neutral.
Open Interest pretty neutral.
A word from Trump/Powell can save or kill the whole story.

BTC Hits ATH Time But Dont Let Euphoria Ruin Your PerceptionBitcoin has pushed into new all-time highs and is now testing the same resistance zone we saw back in December–January. While the breakout is technically impressive, price is stalling at the exact level where strong sell pressure previously kicked in.
Today’s weekly close is a key confirmation point. But the bigger issue? Next week is stacked with macro volatility — PPI, FOMC, and other data drops that could rattle risk-on assets.
⚠️ What I’m Seeing:
- Weekly RSI divergence continues to build
- Volume is drying up, not confirming the move
- Macro pressure is incoming — timing matters
🧠 My Bias:
I wouldn’t be surprised by a final liquidity grab into the $120K–125K range — enough to trap late longs and generate downside liquidity.
Personally, I’m de-risking. Not shorting yet — just locking in some gains.
Ask yourself: Are those extra 10% upside gains worth the risk of giving back 30%-50%?
Not calling tops. Just following structure.
Always open to opposing views — discussion sharpens conviction.
Don’t let euphoria cloud your perception.
📉 Stay safe out there.

Quick BITCOIN Fractal update, Not on Fractal but still good
BITCOIN still in that target circle, first posted in Feb 2025, and I expect to remain here till early June.
This daily chart shows us where exactly we sit in the circle.
There are a number of reasons why we may remain here a little longer but one thing to always look at is the MACD.
The Weekly is still rising Bullish with room to move higher
The Daily is choppy and currently just fallen below its Signal line
We need to watch this area as between the MACD and its Histogram, we could see a Strong Bearish Divergence
The shorter term 4 hour shows how support in approaching
The habit has been for MACD to bounce off Neutral line but if we look at that Histogram, we can see the volatility there and so this could point to a weaker reaction in the near future.
In conclusion, the potential for a drop lower exists but the lower time frame MACD can also show us that some support is available maybe
Lines of support for BTC PA suggest a Low of around 105K should curent support fail.
Bitcoin Dominance (BTC.D) is currently rising again while the others are dropping.
If BTC PA Drops while this is rising, ALTS will Bleed heavy
Continued Range is the likely option till we reach June and then, Mid June, 18th, we have the FED Rate decision.
This could trigger renewed reaction.
We have reentered a zone of upmost CAUTION till we get some stronger momentum signals

Bitcoin Daily Timeframe TargetAs we can see at Daily Timeframe :
1. As we have learned about market structure, bitcoin has finished its correction phase, and now in daily view, as the initial target bitcoin will touch the level that I have determined
2.Daily view will lead us to buy trade direction, this means the probability of buy is greater than sell, whoever takes sell trade will be eaten by whales

Bitcoin’s Breakout Pattern Continues – Is $120K Next?MARKETSCOM:BITCOIN Quick Update
Bitcoin is showing strong momentum — each time it accumulates, it breaks out to a new level. This "accumulate and explode" pattern has played out cleanly three times already.
Now, BTC is consolidating just under its all-time high. If this range holds, another breakout could be coming soon.
The structure remains bullish as long as price holds above the $103K zone. A clear break above ATH could send it toward $120K and beyond.

Bitcoin - Bulls vs Bears: $106k or New ATH?Bitcoin saw a sharp and aggressive drop following Donald Trump’s surprise announcement of a 50% tariff on EU imports. The sudden macro shock triggered broad risk-off flows, with BTC quickly selling off from local highs near 111.3K and tapping into a key fair value gap around 107.5K. Although we’ve seen a short-term bounce since that low, it’s not a convincing bullish reversal. Momentum remains fragile, and the overall structure still favors caution as we trade within a compression zone formed post-drop.
Key Technical Zones
We’re currently trapped between two major 1H fair value gaps that serve as clear boundaries for market direction. The lower zone around 107.5K has provided temporary support, acting as a reaction point after the dump. This FVG was left behind during the early-May rally and is now being tested for the first time. On the flip side, price was rejected earlier today from the upper 1H FVG at 109.8K to 110.7K, which previously served as the base of the last breakdown candle. That rejection confirms sellers are active at that level, and it’s now acting as resistance.
We’re essentially in a deadlock between demand and supply, and the next break will determine directional bias for the next major leg.
Bullish Scenario
If bulls can reclaim the 109.8K–110.7K area with strength and close above it convincingly, that would indicate demand has absorbed the supply in that zone. Ideally, we’d want to see a clear bullish displacement to confirm strength, not just a weak grind. In that scenario, BTC could make its way back toward the previous highs and retest the higher resistance zone around 112K. This level lines up with a larger supply zone and could become a key magnet if the market shifts risk-on again or if shorts begin to unwind.
Bearish Scenario
On the flip side, if BTC fails to hold the lower FVG and breaks below 109K with a strong bearish candle or wick rejection from the upper range, it opens the door for further downside. The next target would be the clean liquidity pool near 106K, which is supported by a price inefficiency and unmitigated demand just below. This level also aligns with prior consolidation structure and would be a logical place for a deeper retracement following the news-driven shakeout.
Market Context and Decision Point
This is a compression structure formed after a high-volatility event, so it’s important not to get trapped in the middle of the range. Price is coiling between two well-defined FVGs, and whichever one gives way will likely trigger the next expansion move. Look for signs of displacement impulsive candles, clean breaks, and follow-through, to validate which side is in control. Until then, patience is key. Let price choose the path and then follow the momentum.
Price Target and Expectations
✅ Break and hold above resistance FVG → target 112K
🚩 Break and lose the support FVG → target 106K
Conclusion
Bitcoin is stuck in a tight battle between bulls and bears following a heavy news-driven drop. The current 1H FVG range offers a textbook breakout setup, with both sides clearly defined. This is not the time to force trades inside the chop. Wait for a clean break, then position for the follow-through. The resolution of this range will likely dictate direction soon, especially as the market continues to digest the macro developments.
___________________________________
Thanks for your support!
If you found this idea helpful or learned something new, drop a like 👍 and leave a comment, I’d love to hear your thoughts! 🚀

BItcoin; Heikin Ashi Trade IdeaCOINBASE:BTCUSD
Picture tells more than 1000 words!
Thank you for checking out!

Bitcoin Be Setting Bull Trap?_Breakout Without High VolumeBitcoin ( BINANCE:BTCUSDT ) started to fall yesterday after forming a new All-Time High(ATH) with high volume , but started to rise again. One of the reasons for Bitcoin’s sudden drop yesterday was the sharp drop in the S&P 500 ( SP:SPX ) index .
First of all, I must say that Bitcoin’s situation is a bit complicated and difficult to analyze , so pay more attention to money management. Be prepared for any scenario.
Bitcoin is trading above the Resistance zone($109,588-$105,820) and near the Resistance lines and Cumulative Short Liquidation Leverage($113,020-$111,833) . What is worrying is that the break of the Resistance zone($109,588-$105,820) was NOT accompanied by high volume , suggesting a bull trap is possible .
I see a correction to at least Cumulative Long Liquidation Leverage($109,972-$108,609) given the low breakout volume for Bitcoin and the large sell orders in the upper prices for Bitcoin .
--------------------------------------------
Today, the Flash PMI data from the U.S . came in stronger than expected:
Flash Manufacturing PMI: 52.3 (vs. forecast 49.9, previous 50.2)
Flash Services PMI: 52.3 (vs. forecast 51.0, previous 50.8)
Analysis :
Both numbers exceeded expectations, signaling stronger economic activity in the U.S. This is bullish for the USD( TVC:DXY ) and could put short-term downward pressure on Bitcoin, as it lowers the chances of near-term Fed rate cuts.
--------------------------------------------
Do you think Bitcoin is completing a Bull Trap or should we expect Bitcoin to increase further?
Note: If Bitcoin breaks above $114,500 with high momentum, we can expect Bitcoin to rise to near $119,000.
Please respect each other's ideas and express them politely if you agree or disagree.
Bitcoin Analyze (BTCUSDT), 1-hour time frame.
Be sure to follow the updated ideas.
Do not forget to put a Stop loss for your positions (For every position you want to open).
Please follow your strategy and updates; this is just my Idea, and I will gladly see your ideas in this post.
Please do not forget the ✅' like '✅ button 🙏😊 & Share it with your friends; thanks, and Trade safe.

Bitcoin - Correction Is Finally Happening!Hello, Skyrexians!
Let's continue trying to guess when BINANCE:BTCUSDT will have a correction. This time it's very likely, but I am not recommend to short this correction because this is the trade against the major trend.
Let's take a look ate 12 hours time frame. Wave 3 is likely to be finished with internal double divergence on Awesome Oscillator. Now it's finally time for the wave 4. 0.38 Fibonacci is the most likely target at $101k. After that wave 5 is expected and it's going to be only higher degree wave 1.
Best regards,
Ivan Skyrexio
___________________________________________________________
Please, boost this article and subscribe our page if you like analysis!

RIP Bitcoin Sell to 45K ?Bitcoin broke the weekly channel last week. I expect a decline to 45K
Stop loss: 97600

BTC/USDT Analysis – Joining the Long Trend
Hello everyone! This is the daily analysis from a trader-analyst at CryptoRobotics.
Today, D. Trump decided to cool the market after Bitcoin hit a new all-time high. The U.S. President threatened to impose 50% tariffs on EU countries, and the market immediately reacted with a decline.
At the moment, Bitcoin has reached an important support zone at $109,200–$106,500 (high volume area), and the bias remains in favor of long positions.
Buy Zones:
$109,200–$106,500 (volume area)
$103,200–$102,000 (market sell absorption)
~$100,000 (aggressive buy volumes)
$98,000–$97,200 (local support)
$93,000 (support level)
$91,500–$90,000 (strong buying imbalance)
$88,100–$87,000 (market sell absorption)
$85,500–$84,000 (accumulated volume)
$82,700–$81,400 (volume zone)
$74,800 (support level)
$69,000–$60,600 (accumulated volume)
This publication is not financial advice.

Bitcoin Remains Bulish once again, almostinner cycle 5 waeces impulse looks completed , but bigger cycle not just yet,
Sell from current levels to 103.000
Buy from 103.000 Targetting 117.000 / 123.000
GG

IBITUSDT | Volume Speaks FirstRight now, IBITUSDT is showing more volume than even Binance’s pair . That alone tells me where the real activity is — and this is the chart I’ll be tracking .
I’m not interested in premature entries. I’ll be watching below the green line for potential setups , but only with clear confirmation on lower timeframes.
“I will not insist on my short idea. If the levels suddenly break upwards and do not give a downward break in the low time frame, I will not evaluate it. If they break upwards with volume and give a retest, I will look long.”
Most traders follow the noise. I follow the volume. That’s how I stay accurate.
📌I keep my charts clean and simple because I believe clarity leads to better decisions.
📌My approach is built on years of experience and a solid track record. I don’t claim to know it all but I’m confident in my ability to spot high-probability setups.
📌If you would like to learn how to use the heatmap, cumulative volume delta and volume footprint techniques that I use below to determine very accurate demand regions, you can send me a private message. I help anyone who wants it completely free of charge.
🔑I have a long list of my proven technique below:
🎯 ZENUSDT.P: Patience & Profitability | %230 Reaction from the Sniper Entry
🐶 DOGEUSDT.P: Next Move
🎨 RENDERUSDT.P: Opportunity of the Month
💎 ETHUSDT.P: Where to Retrace
🟢 BNBUSDT.P: Potential Surge
📊 BTC Dominance: Reaction Zone
🌊 WAVESUSDT.P: Demand Zone Potential
🟣 UNIUSDT.P: Long-Term Trade
🔵 XRPUSDT.P: Entry Zones
🔗 LINKUSDT.P: Follow The River
📈 BTCUSDT.P: Two Key Demand Zones
🟩 POLUSDT: Bullish Momentum
🌟 PENDLEUSDT.P: Where Opportunity Meets Precision
🔥 BTCUSDT.P: Liquidation of Highly Leveraged Longs
🌊 SOLUSDT.P: SOL's Dip - Your Opportunity
🐸 1000PEPEUSDT.P: Prime Bounce Zone Unlocked
🚀 ETHUSDT.P: Set to Explode - Don't Miss This Game Changer
🤖 IQUSDT: Smart Plan
⚡️ PONDUSDT: A Trade Not Taken Is Better Than a Losing One
💼 STMXUSDT: 2 Buying Areas
🐢 TURBOUSDT: Buy Zones and Buyer Presence
🌍 ICPUSDT.P: Massive Upside Potential | Check the Trade Update For Seeing Results
🟠 IDEXUSDT: Spot Buy Area | %26 Profit if You Trade with MSB
📌 USUALUSDT: Buyers Are Active + %70 Profit in Total
🌟 FORTHUSDT: Sniper Entry +%26 Reaction
🐳 QKCUSDT: Sniper Entry +%57 Reaction
📊 BTC.D: Retest of Key Area Highly Likely
📊 XNOUSDT %80 Reaction with a Simple Blue Box!
📊 BELUSDT Amazing %120 Reaction!
📊 Simple Red Box, Extraordinary Results
I stopped adding to the list because it's kinda tiring to add 5-10 charts in every move but you can check my profile and see that it goes on..

BTC/USDT Analysis: Breaking the All-Time High
Hello everyone! This is the trader-analyst from CryptoRobotics, and here is your daily update.
Yesterday, Bitcoin broke its all-time high. There were no strong sell-offs either at or above the level. During the move, a volume zone was formed, and we managed to consolidate above it. Since there is no visible resistance ahead, trading should currently be approached from the long side — at least until a strong opposing force appears on the chart.
Buy Zones:
• $109,200–$106,500 (volume zone)
• $103,200–$102,000 (absorption of market selling)
• Around $100,000 (pushing volumes)
• $98,000–$97,200 (local support)
• $93,000 level
• $91,500–$90,000 (strong buying imbalance)
• $88,100–$87,000 (absorption of market selling)
• $85,500–$84,000 (accumulated volumes)
• $82,700–$81,400 (volume zone)
• $74,800 level
• $69,000–$60,600 (accumulated volumes)
This publication is not financial advice.

Bitcoin Overextended? Watch These Key Levels for the Next Move!BTC/USDT 1H – Retrace Before the Next Leg? 🚦
Bitcoin has shown impressive strength recently. On the 1-hour chart the current price action looks overextended 📈. After a strong impulsive move up, we’re seeing signs of exhaustion, with price stalling near the $111,800 region. Liquidity appears thin on the buy side, and there’s a cluster of potential sell stops resting below the current high in the form of sell stop.
I’m anticipating a retrace into the Fibonacci zone, with key levels at the 50% - 61.8% retracement. This area aligns with previous consolidation and could act as a magnet for price, especially as liquidity is swept from late long positions. If we see price rotate and break structure bullishly at my point of interest, I’ll be looking for a long entry opportunity. 🔄
Fundamentals & Macro Backdrop 🌍
On the fundamental side, Bitcoin remains sensitive to macroeconomic and geopolitical developments. Ongoing uncertainty in global politics and central bank policy continues to drive volatility across risk assets. Bitcoin’s correlation with tech stocks and the NASDAQ remains significant—recent data shows that when the NASDAQ pulls back, Bitcoin often follows suit. If we see a correction in tech stocks, be prepared for a retrace in BTC as well. 📉
Institutional interest is still strong, but short-term sentiment is cautious as traders await clarity on inflation, interest rates, and regulatory news. Keep an eye on U.S. economic data releases and any major headlines out of Washington or global hotspots, as these can quickly shift risk appetite.
Fundamentals and macro news remain key drivers—stay nimble!
Let’s see if BTC can reload for another leg up, or if broader market weakness drags it lower. Trade safe! 🚀

My buy view for BTCFollowing my previous analysis, BTC has retraced back to around $95K zone.
If the zone continues to hold, we should expect BTC to continue to rally towards north.
Lets keep our eyes on $100K target if the support zone of $95 holds strong

BTC - Will it break the ATH? BITCOIN is near its all-time high!
Mapped out possible BUY or SELL opportunities in DAILY timeframe.
BTC is currently inside a triangle that is about to burst. Create your alerts/notifications to catch this move :D

BTC Hits New All-Time High: Is a $128K Blow-Off Top Next?Bitcoin's Meteoric Ascent: New All-Time Highs Fuel $128K "Blow-Off Top" Predictions Amidst Unprecedented Adoption
The digital gold rush of the 21st century is reaching a fever pitch. Bitcoin (BTC), the pioneering cryptocurrency, has not only shattered previous records but is now tantalizingly close to new, stratospheric all-time highs, with analysts eyeing a potential "blow-off top" as high as $128,000. This electrifying surge, which saw BTC climb to within 1.5% of new peaks as bullish sentiment decisively overcame final resistance, is underpinned by a confluence of factors: soaring institutional and retail adoption, particularly in the United States, booming ETF inflows, growing political and regulatory support, and a shifting macroeconomic landscape that increasingly favors non-traditional assets. As of May 21, 2025, Bitcoin has firmly established itself above the $109,000 mark, a testament to its resilience and burgeoning mainstream acceptance.
The recent price action has been nothing short of spectacular. Bitcoin bulls have been relentlessly "grilling sellers," pushing the price to historic milestones. On May 21, 2025, Bitcoin etched a new all-time high (ATH) above $109,000, a landmark achievement that notably placed 100% of BTC holders into profit. This surge saw Bitcoin's market capitalization briefly surpass that of e-commerce giant Amazon, a symbolic victory highlighting its growing financial clout. Specific figures around this period include a climb to a record $109,302, and another peak at a historic $109,500, demonstrating the intense buying pressure and bullish conviction in the market. Analysts are now recalibrating their upside targets, with many calling for $116,000 as the next significant milestone on the path to even loftier valuations.
This bullish momentum isn't occurring in a vacuum. It's the culmination of years of development, increasing understanding, and a series of pivotal events that have collectively propelled Bitcoin into the financial limelight.
The American Bitcoin Boom: Adoption Surpasses Gold, Institutions Dive In
One of the most compelling narratives driving Bitcoin's current rally is its explosive growth in the United States. A staggering 50 million Americans now own Bitcoin, a figure that notably surpasses the 37 million gold holders in the country. This demographic shift signifies a profound change in investment preferences, particularly among younger generations who are increasingly comfortable with digital assets. Bitcoin is no longer a niche interest for tech enthusiasts; it's becoming a recognized component of diversified investment portfolios across a broad swathe of the American population.
The institutional embrace within the US is equally, if not more, impactful. US firms now hold an astonishing 94.8% of the Bitcoin reserves held by publicly traded companies globally. This concentration underscores the confidence American corporations have in Bitcoin as a treasury reserve asset, a hedge against inflation, and a potential source of significant returns. Furthermore, the United States is solidifying its position as the global epicenter of the Bitcoin industry, with 40% of all Bitcoin companies headquartered domestically. This robust ecosystem of miners, exchanges, wallet providers, and ancillary service companies fosters innovation and provides a strong foundation for continued growth.
The advent and subsequent success of Bitcoin Exchange Traded Funds (ETFs) have been a game-changer. These regulated financial products have opened the floodgates for a new wave of capital, allowing retail and institutional investors to gain exposure to Bitcoin through traditional brokerage accounts without the complexities of direct ownership and custody. The "booming ETF inflows" are a direct contributor to the recent price surge, creating sustained buying pressure and signaling widespread market acceptance.
Macroeconomic Tailwinds and Regulatory Optimism
Beyond direct adoption, broader economic and political factors are playing a crucial role. The recent new all-time high of $109,000 was notably set just nine days after the US and China closed a 90-day trade agreement. This resolution eased economic uncertainty and market jitters that had previously weighed on global markets. In such an environment, assets perceived as hedges against traditional market volatility or fiat currency devaluation, like Bitcoin and gold, often thrive. Indeed, concurrent with Bitcoin's rise, concerns such as Japan's debt woes have contributed to gold surpassing the $3,300 mark, indicating a broader flight to alternative stores of value.
Furthermore, there's growing optimism around US regulations concerning cryptocurrencies. While the regulatory landscape is still evolving, recent pronouncements and actions suggest a move towards greater clarity and a more accommodative stance, rather than outright prohibition. This "growing political support" is crucial for long-term institutional commitment, as regulatory uncertainty has historically been a significant barrier to entry for larger, more conservative investors. The fact that Bitcoin climbed to a record of $109,302, breaching a previous high set around the time of a major political event like a presidential inauguration (specifically referenced as Trump's inauguration on Jan. 20 in a historical context for a previous ATH), often correlates with market sentiment interpreting political or regulatory shifts as favorable.
The "Bitcoin Strategic Reserve" (BSR): A Paradigm Shift for National Economies?
An intriguing, albeit more speculative, concept gaining traction is the idea of a "Bitcoin Strategic Reserve" (BSR). While not yet a formal policy in any major nation, the discussion itself highlights Bitcoin's evolving perception from a purely speculative asset to one with potential strategic geopolitical and economic importance.
A BSR would involve a nation-state, such as the United States, acquiring and holding Bitcoin as part of its national reserves, much like it currently holds gold or foreign currencies. The rationale behind such a move could be multifaceted:
1. Hedging Against Fiat Devaluation: As central banks globally continue to engage in monetary expansion, concerns about the long-term purchasing power of fiat currencies persist. Bitcoin, with its fixed supply, offers a potential hedge against this inflation.
2. Participating in a New Financial System: If Bitcoin continues its trajectory towards becoming a globally recognized store of value or even a medium of exchange for certain international transactions, holding it in reserve would position a nation to participate actively in this emerging financial infrastructure.
3. Technological Leadership: For a country like the US, which already leads in Bitcoin company headquarters and corporate holdings, establishing a BSR could further cement its leadership in the digital asset space, attracting talent and capital.
4. Economic Resilience: In a future where digital currencies play a more significant role, a BSR could offer a degree of economic resilience and autonomy, reducing reliance on traditional financial systems or the currencies of other nations.
The implications of a major economic power like the US even seriously considering, let alone implementing, a BSR would be monumental for Bitcoin's legitimacy and price. It would signal ultimate institutional acceptance and could trigger a wave of similar considerations by other nations, creating immense demand for a limited supply of BTC. While the "Bitcoin Strategic Reserve Explained and What BSR Means for the US Economy" remains a topic of forward-looking discussion, its emergence in financial discourse is a testament to how far Bitcoin has come.
The Path to $128K: Understanding the "Blow-Off Top"
With Bitcoin having decisively broken past $109,000 and upside targets of $116,000 now in common parlance, the ultimate bull-case scenario being discussed is a "blow-off top" potentially reaching $128,000 or even higher.
A "blow-off top" is a chart pattern that signifies a steep and rapid price increase in an asset, often on high volume, followed by an equally sharp reversal. It typically occurs at the end of a prolonged bull market or a parabolic advance. The psychology behind it involves:
1. Euphoria and FOMO (Fear Of Missing Out): As prices accelerate, media attention intensifies, and stories of quick riches abound. This draws in a flood of retail investors who don't want to miss out on the gains.
2. Exhaustion of Buyers: The parabolic rise eventually becomes unsustainable. The last wave of enthusiastic buyers enters at or near the peak.
3. Smart Money Distribution: Experienced traders and institutions, who may have accumulated positions much lower, begin to sell into this heightened demand, taking profits.
4. Sharp Reversal: Once buying pressure is exhausted and selling pressure mounts, the price can fall dramatically as latecomers panic-sell and stop-losses are triggered.
Predicting the exact peak of a blow-off top is notoriously difficult. However, analysts use a combination of technical analysis (chart patterns, momentum indicators, Fibonacci extensions), on-chain data (network activity, holder behavior), and market sentiment to identify potential price targets and warning signs. The $128,000 figure is likely derived from such analyses, representing a significant psychological level or a projection based on previous market cycle behavior.
Navigating the Bull Market: Indicators for Identifying a Cycle Top
While the current sentiment is overwhelmingly bullish, savvy Bitcoin traders and investors are always mindful of market cycles and the potential for corrections or trend reversals. The question, "Is Bitcoin price close to a cycle top?" is one that prudent market participants constantly evaluate. Several indicators can help traders gauge whether a market might be overheating:
1. Moving Average Convergence Divergence (MACD): This trend-following momentum indicator can show bearish divergences, where the price makes new highs, but the MACD fails to do so, signaling weakening momentum.
2. Relative Strength Index (RSI): An RSI reading above 70 is generally considered overbought, and readings above 80 or 90 in a strong bull market can signal extreme conditions, though Bitcoin can remain overbought for extended periods. Bearish divergences on the RSI are also key.
3. On-Chain Metrics (e.g., MVRV Z-Score, Puell Multiple, SOPR):
o MVRV Z-Score (Market Value to Realized Value): Compares Bitcoin's market cap to its realized cap (the price at which each coin last moved). High Z-scores indicate the market cap is significantly higher than the average cost basis, suggesting the asset is overvalued and potentially near a top.
o Puell Multiple: Looks at the supply side of Bitcoin's economy – miners and their revenue. It divides the daily issuance value of bitcoins (in USD) by the 365-day moving average of daily issuance value. High values suggest miner profitability is high compared to historical norms, which has sometimes coincided with market tops.
o Spent Output Profit Ratio (SOPR): This indicates if holders are, on average, selling in profit or loss. Values significantly above 1 suggest holders are realizing substantial profits, which can increase sell pressure. A sustained drop below 1 after a peak can signal a shift in trend.
4. Logarithmic Growth Curves: Bitcoin's long-term price action has often respected logarithmic growth channels. When the price reaches the upper band of these channels, it has historically indicated a market top.
5. Funding Rates and Open Interest in Derivatives Markets: Extremely high positive funding rates on perpetual swaps indicate that an overwhelming number of traders are long and paying a premium to maintain those positions. This can signal excessive bullishness and a crowded trade, making the market vulnerable to a long squeeze if prices reverse. High open interest can also exacerbate volatility.
While Bitcoin is currently refusing to give up on its quest to revisit $108,000 (a level now surpassed) and beyond, concerns over a trend change, though perhaps quieter amidst the euphoria, are always present in the minds of seasoned investors. These indicators provide a more objective lens through which to assess the sustainability of the current rally.
The Road Ahead: Uncharted Territory with Immense Potential
As Bitcoin forges new all-time highs, it enters uncharted territory. The confluence of unprecedented US adoption, robust institutional investment via ETFs, a more favorable regulatory outlook, and supportive macroeconomic conditions has created a potent cocktail for price appreciation. The surpassing of Amazon's market cap, even if temporary, and the fact that 100% of BTC holders are in profit, are powerful psychological milestones that can fuel further confidence.
The predictions of a $116,000 interim target and a potential $128,000 blow-off top are no longer fringe theories but are being seriously discussed by mainstream analysts. The narrative of Bitcoin as "digital gold" is gaining more traction than ever, especially as traditional safe havens like gold also see increased interest amidst global economic uncertainties like Japan's debt situation.
However, the path is unlikely to be linear. Bitcoin's inherent volatility means that sharp corrections can and will occur, even within a broader uptrend. The "concerns over a trend change" will likely grow louder as prices reach more extreme levels, and profit-taking becomes more tempting. Investors should remain vigilant, utilize the available indicators to assess market conditions, and practice sound risk management.
In conclusion, May 2025 has marked a historic period for Bitcoin. Its surge above $109,000, driven by a powerful combination of fundamental adoption and favorable market dynamics, has set the stage for potentially even more dramatic price action. Whether the ultimate peak of this cycle is $116,000, $128,000, or another figure entirely, one thing is clear: Bitcoin has firmly cemented its place in the global financial landscape, and its journey is far from over. The coming weeks and months will be closely watched by investors worldwide as the world's preeminent cryptocurrency continues to redefine the boundaries of financial assets.
________________________________________
Disclaimer: This article is for informational purposes only, based on the provided snippets, and should not be considered financial advice. Investing in Bitcoin and other cryptocurrencies is highly speculative and carries a significant risk of loss. Past performance is not indicative of future results. Always conduct your own thorough research and consult with a qualified financial advisor before making any investment decisions.
