BITCOIN NEXT MOVES!Bitcoin’s Next Move
In the long run, it's clear—Bitcoin is the new digital gold. Any dip at this stage is a potential opportunity. With over 7 years of experience in Bitcoin analysis, I believe in the bigger picture and long-term value.
If you'd like me to analyze or give insights on any other coin, feel free to ask. And don’t forget to follow for more crypto updates and analysis!
Bitcoinprediction

BTC/USDT Analysis: Following the Scenario
Hello everyone! This is CryptoRobotics' trader-analyst with your daily market breakdown.
Yesterday, Bitcoin came just short of testing the $95,000–$96,700 resistance zone (accumulated volumes) and began to pull back. Most likely, we will see more significant selling pressure once this zone is directly tested.
At the moment, we’ve tested the $92,000–$90,000 buy zone (strong buying imbalance) and are already seeing a reaction from it. The main expectation is the continuation of the long position and a test of the mentioned resistance zones. This is supported by the relatively weak nature of the pullback, absorption of market selling pressure on cumulative delta, and the presence of strong support.
Sell Zones:
$95,000–$96,700 (accumulated volumes)
$97,500–$98,400 (aggressive pushing volumes)
$107,000–$109,000 (volume anomalies)
Buy Zones:
$92,000–$90,000 (strong buying imbalance)
$88,100–$87,000 (market sell absorption)
$85,500–$84,000 (accumulated volumes)
$82,700–$81,400 (high volume area)
Level at $74,800
$69,000–$60,600 (accumulated volumes)
This publication does not constitute financial advice.

Bitcoin Rallies on Stablecoin Optimism and Liquidity BoostMacro:
- The crypto market rebounded as sentiment improved following the US Treasury Secretary's proposal to ease stablecoin regulations, boosting trading volumes and risk appetite.
- On-chain data reflects growing activity. The average bitcoin trade size rose 15% MoM, overall volume jumped, and 78% of supply is now in profit.
- Liquidity support from the increasing M2 money supply in China and the US has further enhanced bitcoin's appeal.
Technical:
- BTCUSD surged to resistance near 94300, aligning with the 100% Fibo Extension, before forming a Doji candle that signals possible correction. The price remains above both EMAs, indicating a bullish shift.
- If the price breaks below 92000, it may leads to a pullback toward the 87000–90000 support zone, near the 23.6%-38.2% Fibo Retracement levels.
- A breakout above 94300 may open the door for a move toward the next resistance around 101400.
Analysis by: Dat Tong, Senior Financial Markets Strategist at Exness

BTC/USDT Analysis – $100,000 Soon?!
Hello everyone! This is CryptoRobotics’ trader-analyst with your daily market analysis.
Yesterday, Bitcoin continued its almost uninterrupted upward movement and is now approaching our key long-term resistance zones.
In the coming days, we can expect a pullback within the bullish trend toward the $92,000 area, where a strong imbalance in delta and buying activity has been observed.
Now is not the time to fall into FOMO and enter long positions at market price — it's better to wait for the mentioned local retracement.
We've adjusted one of the buyer zones based on the broader context.
The previous $90,300–$89,500 (potential pushing volume zone) has now transformed into $92,000–$90,000 (strong buying imbalance zone).
Sell Zones:
$95,000–$96,700 (accumulated volume)
$97,500–$98,400 (pushing volume)
$107,000–$109,000 (volume anomalies)
Buy Zones:
$92,000–$90,000 (strong buying imbalance)
$88,100–$87,000 (absorption of market selling)
$85,500–$84,000 (accumulated volume)
$82,700–$81,400 (volume cluster)
$74,800 (key level)
$69,000–$60,600 (accumulated volume)
Do you think we’ll hit $100,000 this week?
Drop your thoughts in the comments — it’s always interesting to compare perspectives!
This publication is not financial advice.

Bitcoin Is Following Our Trading Plan Hello, Skyrexians!
As we told you new impulsive wave to the new ATH has been started below 80k for BINANCE:BTCUSDT and now price found some resistance. Next 2-4 weeks will be very difficult for traders and holders and we will explain you why.
On the 4h time frame we can see the new impulse which shall consists of 5 waves. Awesome oscillator tells us that this is the wave 3 inside this impulse and it can be over because of target area according to Fibonacci. The wave 4 can retrace to FWB:88K and it can happen very soon, but this time altcoins promised to remain strong. The next growth will happen to $94-95k in the wave 5. Dominance can reach our final target at 66%. The further correction to 0.61 Fibonacci below $85k will cause the atlseason and after that altcoins will grow in the very short period of time with the growing Bitcoin.
Best regards,
Skyrexio Team
___________________________________________________________
Please, boost this article and subscribe our page if you like analysis!

Forget Tariffs: Why Bitcoin Cares More About ETFs Than EarningsBitcoin's Great Decoupling: Why It Ignores Tariffs and Earnings, Fueled by Fundamentals and ETF Billions
In the complex tapestry of global finance, assets typically dance to the tune of macroeconomic news, central bank policies, corporate earnings reports, and geopolitical tensions like trade tariffs. Stocks rise on strong profits, bonds react to interest rate shifts, and currencies fluctuate with trade balances. Bitcoin, however, increasingly appears to be charting its own course, seemingly indifferent to the traditional market drivers that dictate the movements of legacy assets. This phenomenon, often termed "decoupling," isn't just a statistical anomaly; it's rooted in Bitcoin's fundamental nature and is gaining significant validation through the burgeoning success of US-listed Bitcoin Exchange Traded Funds (ETFs).
The core argument, as highlighted in recent market commentary, is compelling: Bitcoin's value proposition isn't tied to quarterly earnings calls, CEO performance, or the potential impact of import tariffs. It has no central bank adjusting its supply or setting its interest rate. Instead, its perceived value stems from a unique set of characteristics: verifiable digital scarcity capped at 21 million coins, a decentralized network resistant to single points of failure or control, and an emerging role as a neutral, global reserve asset in an increasingly politicized and fragmented world.
Fundamentals Over Fleeting News Cycles
Traditional assets are intrinsically linked to the health of economies and corporations. A weak earnings report can send a stock tumbling, while fears of a trade war can ripple through entire sectors. Bitcoin exists outside this framework. Its "earnings" are the security and finality provided by its blockchain; its "management" is the distributed network of miners and nodes enforcing consensus rules; its "monetary policy" is embedded in its immutable code.
This inherent separation means that while traditional markets might gyrate based on the latest Federal Reserve announcement or geopolitical flare-up, Bitcoin's trajectory is often more influenced by factors specific to its own ecosystem: adoption rates, network upgrades, regulatory clarity (or lack thereof), halving events that reduce new supply issuance, and, crucially, capital flows into vehicles that provide access to it.
The narrative suggests Bitcoin is maturing into something akin to a digital version of gold – an asset valued for its scarcity and neutrality, acting as a potential hedge against inflation, currency debasement, and systemic risks within the traditional financial system. In a world grappling with high debt levels, persistent inflation, and geopolitical instability (like the mentioned US trade war volatility), the appeal of a non-sovereign, mathematically scarce asset grows.
ETF Inflows: A Roaring Stamp of Approval
The most potent evidence supporting this decoupling narrative and Bitcoin's growing acceptance comes from the recent performance of US spot Bitcoin ETFs. Launched earlier in the year, these products represented a watershed moment, providing regulated, accessible exposure for institutional and retail investors alike through traditional brokerage accounts.
Recent data underscores their impact. On April 21st, these ETFs collectively witnessed their largest single-day net inflows since the initial launch frenzy in January, pulling in a remarkable $381.3 million. This surge in demand, with notable contributions like the $116.1 million flowing into the RK 21Shares Bitcoin ETF (ARKB), coincided directly with significant positive price action. Bitcoin decisively broke through previous resistance levels, reclaiming the $91,000 mark after a seven-week consolidation period.
These inflows are more than just numbers; they represent a tangible shift in capital allocation. They signal growing institutional comfort and strategic positioning in Bitcoin. Unlike speculative futures-driven rallies, inflows into spot ETFs reflect direct demand for the underlying asset, potentially building a more stable foundation for price appreciation. This influx suggests investors aren't just chasing momentum but are making longer-term allocations, viewing Bitcoin as a legitimate component of a diversified portfolio, independent of its correlation (or lack thereof) to other asset classes.
Price Action, Leverage, and the Path Ahead
The technical picture for Bitcoin has brightened considerably alongside these fundamental drivers. The recent surge saw Bitcoin break key bearish structures, establishing a higher low that many traders see as a potential launchpad for challenging previous all-time highs. The reclaiming of the $91,000 level was a significant psychological victory for bulls, reinforcing the positive sentiment fueled by the ETF flows. Market participants are now eyeing levels like the yearly open around $93,000 as the next major hurdle.
However, caution remains warranted. Analysts note that recent price surges have often been accompanied by significant leverage in the derivatives market. While leverage can amplify gains and accelerate upward moves, it also increases volatility and the risk of sharp liquidations if the market turns. The critical question is whether the consistent spot buying, particularly through ETFs, can absorb selling pressure and provide the underlying support needed to sustain these higher price levels. A rally built predominantly on leverage without corresponding spot demand is often viewed as less stable.
The comparison to gold's comeback potential amidst trade tensions is intriguing, but Bitcoin still needs to prove its resilience. While it has demonstrated periods of acting as a safe-haven asset, its correlation to risk assets like tech stocks can reappear, especially during broad market liquidity crises. The "decoupling" is not absolute, but rather a dominant trend driven by its unique value proposition gaining traction.
Conclusion: A Maturing Asset Forging Its Own Path
Bitcoin's recent performance, marked by significant ETF inflows and a price surge seemingly disconnected from traditional market anxieties like tariffs and earnings reports, lends strong support to the decoupling narrative. Its fundamental characteristics – scarcity, decentralization, and neutrality – are increasingly resonating in a complex global environment. The success of spot Bitcoin ETFs provides a regulated gateway for broader adoption and serves as tangible proof of growing institutional and retail demand, validating Bitcoin's role as an emerging reserve asset.
While challenges remain, including inherent volatility, regulatory uncertainties, and the need for spot demand to underpin leverage-driven moves, the trend is undeniable. Bitcoin is increasingly trading based on its own unique supply/demand dynamics and its perceived role in the future financial landscape, rather than simply mirroring the movements of traditional markets. It doesn't care about Q3 earnings or new import duties because its value proposition exists on a different plane. As capital continues to flow in via accessible vehicles like ETFs, recognizing its distinct properties, Bitcoin's journey towards becoming a truly independent, globally significant asset class continues, one block at a time.

Bitcoin - The path to 170K
- Still enough NQ correlation to drag BTC
- No new highs unless QE (regime shift)
- Rangebound but stronger "decoupling rally" possible due to global liq etc. Fade unless real QE
- Front runs end of year (early Q4 stocks late Q4)
All of this could change, but one thing the charts keep telling me—
$170K Bitcoin this cycle is still very much a possibility.
Please check out my bear market Bitcoin-to-100K chart.
Thanks, feel free to leave a boost if you have found this helpful.

WNTR is Coming and the bears will be roam like white walkersPicture this, my pretties: it’s late 2025, and the crypto market’s a ghost town, ravaged by the icy claws of a crypto winter. Bitcoin, that sanctimonious coin-king, stumbles like a peasant I’ve drained dry, and MicroStrategy (MSTR), that Bitcoin-stuffed hog will collapse under its own greed. Enter the WNTR ETF, the YieldMax MSTR Short Option Income Strategy ETF, a sinister brew designed to fatten my coffers when MSTR’s pulse fades. This ain’t just an ETF; it’s a blood oath to thrive when the crypto market bleeds.
Why should you care, you nocturnal nibblers? Because WNTR is my bear market hard on. As MSTR and Bitcoin crumble, WNTR rises like a bat from the shadows, its inverse magic turning their death throes into a banquet of tendies. But beware, my lovely bears, in the sunlit days of a bull market, WNTR wilts like me at dawn. As of April 2025, with crypto still riding a post-halving high, WNTR’s slumped to $46.76, down from $50.94. Yet, when the winter winds howl, this beast could soar, a phoenix of profit rising from the market’s frozen ashes.
Crypto winters... Those glorious epochs when the market’s veins run cold, and the weak are culled like lambs at my altar. These ain’t mere dips; they’re prolonged bear markets, dripping with double-digit price drops and the sobs of retail mortals and disconnected high tower boys in white shirts. Remember the long night of late 2017 to December 2020? Bitcoin plunged from $20,000 to $3,000—an 85% descent into my crypt. Another hit in 2022, sparked by TerraUSD and Celsius Network imploding, leaving a trail of bankruptcies tastier than a virgin’s neck.
These winters stalk the heels of Bitcoin’s halving events and those quadrennial rites where mining rewards are slashed, tightening the supply and sparking bull runs… until the inevitable crash. If history’s my grimoire, the market peaks around late 2025 to early 2026, then plunges into the next crypto winter. Mark your calendars, my fiends, is when the feast nears.
What’s WNTR mean in this gothic tale? It’s a two-faced fiend, my darlings. In the first year post-halving, as bulls charge and Bitcoin soars, WNTR’s a shriveled husk, its dividends a mere trickle of blood. But when the winter descends, and bears roam free, WNTR transforms into a gushing vein, its value swelling as MSTR and Bitcoin bleed out.
Think of WNTR as your income hedge, a way to sip the market’s essence no matter the season. In bull markets, I wanna reinvest WNTR’s dividends into YBIT or other crypto toys, letting them fatten on mortal optimism. When the winter bites, I wanna shift your fangs: use WNTR’s income to buy Bitcoin on the cheap as it sinks, or sell off WNTR shares in profit if you are above various % of average cost basis. The cold deepens, pocketing gains while the bulls cry into their blockchain Kool-Aid. It’s a dance of darkness, and I’m an undead maestro.
The Blood Ritual: How to Feast
Here’s how you, my fellow nightwalkers, can join the carnage:
Track the Halving Pulse: The next crypto winter looms around late 2025 or early 2026. Watch Bitcoin’s post-halving strut—when the euphoria peaks, the fall is nigh. Listen for the cracks in coinbase, mstr, for the unraveling of the great tarrif tsar era.
Stock the Crypt with WNTR when the trend reverses: As the market cracks, hoard WNTR shares. Its price may be low now, but in winter’s depths, it could spike like my fangs on a full moon.
Reinvest Like a Leech: In bull markets, funnel WNTR’s dividends into crypto gains. In bear markets, buy the Bitcoin dip or cash out WNTR for profit.
Flee the Dawn: WNTR’s a creature of the night. When bulls return, its power fades. Time your exit, lest you burn in the sunlight.
This ain’t for the faint-hearted, my pretties. WNTR’s a leveraged beast, riskier than a sunrise stroll. Volatility decay can stake your gains, and if MSTR rallies, your losses’ll hit faster than a hedgie fleeing a margin call. Do your own necromancy and scour the ancient texts (or a financial advisor) and never YOLO your entire crypt. The market’s feral, crypto winters are feraler, and WNTR’s the feralest of all.
So, as the crypto winter looms, heed this, my degens: the bears are coming, and they hunger. With WNTR in your claws, you can turn their feast into yours. Snort wisely, or crumble to dust.
Disclaimer: This is unholy entertainment, not mortal advice. Investing in WNTR is dicier than a daylight dash, and you could lose your blood money. Do your own research, don’t YOLO your crypt, and maybe consult a living advisor instead of a WSB vampire. Feast at your own peril.

Bitcoin Will Soon Follow GOLD!!!Bitcoin has just hit the $87,000 mark, breaking out of a classical bullish continuation pattern. This breakout is significant and indicates strong bullish momentum that could lead to further upside. If this momentum continues, Bitcoin has the potential to not only reclaim its previous all-time high but also push beyond into price discovery mode.
Interestingly, this move comes right after Gold printed a new all-time high. Historically, Gold has often led major macro cycles, with Bitcoin following closely behind. This pattern seems to be playing out once again. As investors rotate capital and seek safe havens or inflation hedges, Bitcoin stands to benefit as the digital equivalent of Gold. If history repeats, Bitcoin could be on the verge of its next major rally.
From a technical standpoint, the breakout is supported by increasing volume and bullish momentum indicators such as RSI and MACD. The key support now lies around the $85K– GETTEX:87K zone, which previously acted as resistance. If price holds above this level, the next targets to watch are $90K and the psychological $100K mark.
That said, proper risk management is crucial. The market is moving fast, and while the setup is bullish, it’s important to have a well-defined stop-loss strategy in place. Avoid chasing price—wait for clean retests or consolidations if you missed the initial breakout. Momentum may be in the bulls’ favor, but discipline keeps you in the game.
Bitcoin has made its move. Gold has shown the way. If the historical correlation holds true, Bitcoin may be just getting started. Stay focused and manage your risk wisely.
BTC/USDT Analysis – Confirmed Bullish Trend
Hello everyone! This is CryptoRobotics' trader-analyst with your daily market analysis.
Yesterday, Bitcoin continued accumulating around our marked level of $87,000 without dropping below it.
Today, we broke the key high of $88,800 and are now seeing a surge in volume.
Our main scenario remains a continuation of the uptrend toward the next sell zone or until we encounter abnormally strong market or limit sell pressure (a sharp volume spike followed by a failure to hold above, or a technical trend break).
At this stage, it's important to secure a position above $90,500 — in that case, the current volume spike may act as support, providing a good opportunity to join the long side.
If not, we expect a return to the $88,000 area.
Sell Zones:
$95,000–$96,700 (accumulated volume),
$97,500–$98,400 (initiative pushing volumes),
$107,000–$109,000 (volume anomalies).
Buy Zones:
$90,300–$89,500 (potential pushing volume zone),
$88,100–$87,000 (absorption of market selling),
$85,500–$84,000 (accumulated volume),
$82,700–$81,400 (high-volume area),
Level at $74,800,
$69,000–$60,600 (accumulated volume).
This publication is not financial advice.

Bitcoin & the Resistance...who will win?Its early 2025 any Bitcoins hashrate is hovering around 1000 EH/S! The computational power is becoming staggering. Has anyone considered the sci-fi world we currently live in and how that might affect BTC in the future? I like the version of the new matrix where a truly decentralized, pro human AI program is released on the bitcoin network to grow...lol
The future and perps markets determine bitcoins price now. There are fewer coins in circulation so everything is leveraged. Be mindful of massive head fakes but like the $96200.00 area for resistance. Might be a nice area to short for a 5x leveraged scalp...
Not financial advice and crypto has unique risks that usually end of you losing funds. Have fun and learn.

Bitcoin Tests Critical Resistance Level: What's Next?FenzoFx—Bitcoin is testing the $88,650 resistance, a level it has rejected more than three times. The Stochastic and RSI 14 indicators remain in overbought territory, indicating short-term overvaluation. Entering the market at this price is not recommended.
If BTC/USD stays below $88,650, a consolidation phase may follow, with potential dips to $88,140 and $82,810.
Bullish Scenario
The bearish outlook is invalidated if BTC closes above $88,650, potentially resuming the uptrend toward $90,000.

BTC Breaks Key Resistance –Pullback Your Last Chance to Enter!?To start today's analysis, it's best to look at the Bitcoin ( BINANCE:BTCUSDT ) analysis I shared with you on April 10 , which can give us good insight and has performed well so far .👇
Bitcoin seems to have finally managed to break through Important Resistance lines as well as the Resistance zone ($86,500-$85,150) . The break volume is also high and could be a good sign for the continuation of the upward trend .
According to Elliott Wave theory , with the breaking of important resistance lines , we should wait for the next 5 impulsive waves , which I will try to analyze step by step in this idea and future ideas.
I expect Bitcoin to attack the Heavy Resistance zone ($95,000-$88,500) for the first time after the pullback to the broken Resistance zone ($86,500-$85,150) (it is better to enter a long position on the pullback ). Basically, assets can NOT break such heavy zones for the first time . ( With very good news, it may break for the first time ).
Cumulative Long Liquidation Leverage: $86,022-$85,539
Cumulative Short Liquidation Leverage: $89,340-$88,000 = Important
Do you think the main uptrend has resumed or will Bitcoin correct again?
Note: The pullback is likely to start from the third point of contact with the Resistance lines.
Note: If Bitcoin falls below $85,100, it seems we should expect further declines.
Please respect each other's ideas and express them politely if you agree or disagree.
Bitcoin Analyze (BTCUSDT), 1-hour time frame.
Be sure to follow the updated ideas.
Do not forget to put a Stop loss for your positions (For every position you want to open).
Please follow your strategy and updates; this is just my Idea, and I will gladly see your ideas in this post.
Please do not forget the ✅' like '✅ button 🙏😊 & Share it with your friends; thanks, and Trade safe.

Failed Breakout + Rising Wedge = Bearish Signal for Bitcoin!?Bitcoin ( BINANCE:BTCUSDT ) attacked the Resistance zone ($87,520-$85,840) and the important Resistance line as I expected in yesterday's idea , but it seems that it failed to break .
Bitcoin is moving between two Support and Resistance zones .
From a Classic Technical Analysis , Bitcoin appears to have formed a Rising Wedge Pattern .
From an Elliott Wave theory , Bitcoin appears to have completed a main wave 5 on the 1-hour time frame .
Also, we can see the Regular Divergence(RD-) between Consecutive Peaks .
If we look at the Bitcoin chart in the 4-hour timeframe , a Shooting Star Candlestick Pattern with high volume is clearly visible near the Resistance zone ($87,520-$85,840 ), which could signal a reversal and decline in Bitcoin .
I expect Bitcoin to start declining again after an upward correction and break the lower line of the rising wedge pattern , and reach the targets I have indicated on the chart.
Cumulative Short Liquidation Leverage: $87,708-$86,487
Cumulative Long Liquidation Leverage: $84,520-$83,687
Do you think Bitcoin can finally break the important resistance line? I would like to hear your thoughts.
Note: If Bitcoin breaks above the Resistance zone ($87,520-$85,840), we can expect a pump.
Note: If Bitcoin falls below $81,000, we can expect further declines.
Please respect each other's ideas and express them politely if you agree or disagree.
Bitcoin Analyze (BTCUSDT), 1-hour time frame.
Be sure to follow the updated ideas.
Do not forget to put a Stop loss for your positions (For every position you want to open).
Please follow your strategy and updates; this is just my Idea, and I will gladly see your ideas in this post.
Please do not forget the ✅' like '✅ button 🙏😊 & Share it with your friends; thanks, and Trade safe.

BTC/USD Rallies Above $82,140FenzoFx—Bitcoin has surged past $82,140 resistance and is now trading near $86,800, correcting 1.0% of its recent gains.
The bullish trend persists above the 50-period simple moving average, with immediate support at $86,140 offering a potential entry point for buyers. If this level holds, the uptrend could target $89,000.
Conversely, a dip below $86,140 might push prices toward $84,000 or $82,811.
>>> No Deposit Bonus
>>> %100 Deposit Bonus
>>> Forex Analysis Contest
All at FenzoFx Decentralized Forex Broker

Market overview
WHAT HAPPENED?
Last week we reached a significant sell area. At the moment, there were strong volume anomalies from the seller. Our main scenario was a correction. But by the middle of the week, after a prolonged flat, the seller began to weaken noticeably. Attempts to update the local minimum didn’t bring results. The scenario was rearranged in the direction of long-range movement.
WHAT WILL HAPPEN: OR NOT?
We’ve already updated the local maximum on an increased volume.
The main priority is long. After updating the $88,800 extreme, the road to $95,000 will be opened. At the same time, the price of $87,000 will act as a support level for a decline. At the moment, strong buyer activity is recorded on it.
Sell Zones:
$95,000–$96,700 (accumulated volume),
$97,500–$98,400 (initiative volume pushing upward),
$107,000–$109,000 (volume anomalies).
Buy Zones:
$85,500–$84,000 (accumulated volume),
$82,700–$81,400 (high-volume area),
Level at $74,800,
$69,000–$60,600 (accumulated volume).
IMPORTANT DATES
The macroeconomic events this week:
• Wednesday, April 23, 13:45 (UTC) — publication of business activity indices in the US manufacturing and services sectors for April;
• Wednesday, April 23, 14:00 (UTC) — publication of data on new home sales in the United States for March;
• Thursday, April 24, 12:30 (UTC) — publication of the number of initial applications for unemployment benefits in the United States;
• Thursday, April 24, 14:00 (UTC) — publication of sales in the secondary housing market in the United States for March.
*This post is not a financial recommendation. Make decisions based on your own experience.
#analytics

"Bitcoin vs Tether" Crypto Market Heist Plan (Scalping/Day)🌟Hi! Hola! Ola! Bonjour! Hallo! Marhaba!🌟
Dear Money Makers & Robbers, 🤑💰✈️
Based on 🔥Thief Trading style technical and fundamental analysis🔥, here is our master plan to heist the "Bitcoin vs Tether" Crypto Market. Please adhere to the strategy I've outlined in the chart, which emphasizes short entry. Our aim is the high-risk Green MA Zone. Risky level, oversold market, consolidation, trend reversal, trap at the level where traders and bullish robbers are stronger. 🏆💸"Take profit and treat yourself, traders. You deserve it!💪🏆🎉
Entry 📈 : "The vault is wide open! Swipe the Bearish loot at any price - the heist is on!
however I advise to Place sell limit orders within a 15 or 30 minute timeframe most nearest or swing, low or high level for Pullback Entries.
Stop Loss 🛑:
📌Thief SL placed at the nearest/swing High or Low level Using the 4H timeframe (81000) Day/Scalping trade basis.
📌SL is based on your risk of the trade, lot size and how many multiple orders you have to take.
Target 🎯: 70000 (or) Escape Before the Target
"Bitcoin vs Tether" Crypto Market Heist Plan (Scalping/Day Trade) is currently experiencing a Bearish trend.., driven by several key factors.👇👇👇
📰🗞️Get & Read the Fundamental, Macro, COT Report, On Chain Analysis, Sentimental Outlook, Intermarket Analysis, Future trend targets... go ahead to check 👉👉👉🔗🔗
Detailed Point Recap 📋
Fundamentals 📊: Strong network + adoption ✅ offset regulatory risks ⚠️—moderately bullish 📈.
Macro 🌍: Inflation aids BTC 🥇, but tight policy/USD weigh ⚖️—mixed 🤔.
COT 📈: Institutional longs 📈 vs. leverage risks ⚡—cautiously bullish ✅.
On-Chain 🔗: LTH bullishness 📈 vs. STH selling 📉—leans positive but capped ⚖️.
Intermarket 🔄: Short-term bearish (equity/USD) 📉, long-term hedging 📈—mixed ⚖️.
Sentiment 😊: Neutral across cohorts ⚖️—lacking conviction 🤷.
Trends 🎯: Short-term downside ($70K) 📉 vs. long-term upside ($129K) 📈—context-driven 🔮.
Outlook 🌟: Neutral now ⚖️, tilting bearish short-term 📉, bullish long-term 📈.
⚠️Trading Alert : News Releases and Position Management 📰 🗞️ 🚫🚏
As a reminder, news releases can have a significant impact on market prices and volatility. To minimize potential losses and protect your running positions,
we recommend the following:
Avoid taking new trades during news releases
Use trailing stop-loss orders to protect your running positions and lock in profits
💖Supporting our robbery plan 💥Hit the Boost Button💥 will enable us to effortlessly make and steal money 💰💵. Boost the strength of our robbery team. Every day in this market make money with ease by using the Thief Trading Style.🏆💪🤝❤️🎉🚀
I'll see you soon with another heist plan, so stay tuned 🤑🐱👤🤗🤩

Bitcoin Is Entering Into The New ImpulseHello, Skyrexians!
We hope you remember our previous BINANCE:BTCUSDT analysis where we told you that Bitcoin will not go significantly lower than $77k. Now price is already at $85k and people now can't understand what is happening. We can see a lot of charts where traders are calling for bear market and further deep dive.
On the daily time frame we can see the clear picture. At $110k the previous impulse has been finished. Bearish divergence on the Awesome Oscillator and two red dots on the Bullish/Bearish Reversal Bar Indicator were the sign of large correction ABC. Now it has been finished with the confirmation with opposite signals. Moreover, wave C has been finished inside the Fibonacci target area. We are 90% sure now that Bitcoin is going to ATH now and this time it can happen with the altcoins growth.
Best regards,
Skyrexio Team
___________________________________________________________
Please, boost this article and subscribe our page if you like analysis!

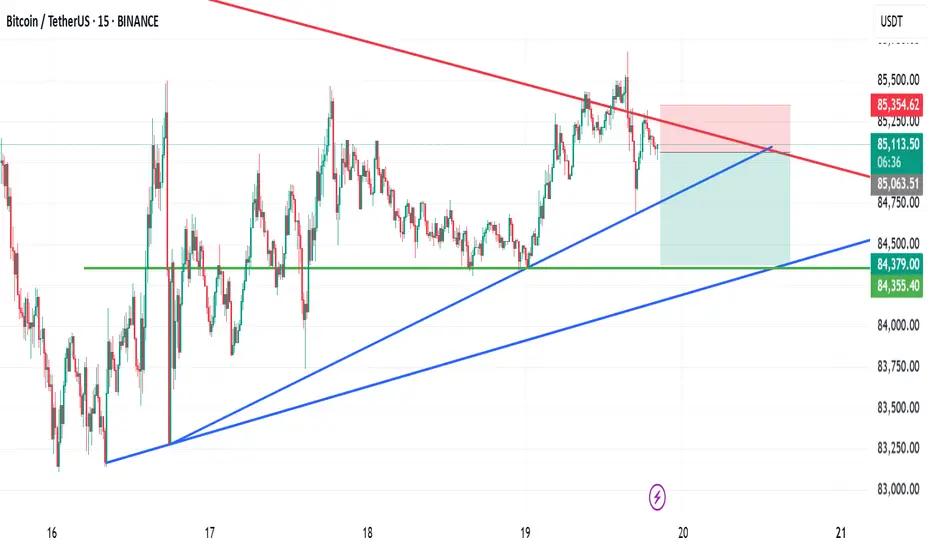
15M sell trade for BTC 15M sell trade for BTC
a small time frame, short for BTC with RR of 1:2.3 if it plays out.
Bitcoin sell to 65K?Follow up on my weekly idea.
There is potential sell in the incoming days on the daily chart
Stop loss: 86900
Take profit: Around 65k

#Bitcoin Future Forcast of Final moves towards #BullRunAs per Weekly Chart Analysis,
Bitcoin performing on the perfectly into #ElliottImpulsive waves and its #CorrectionWave and this time the 5th Cycle of Elliott Impulsive Wave was completed and last Correction Wave cycle will under movements.
Now, it is completed the 0 to A-cycle & performing the moves towards B-cycle around $84k to GETTEX:87K and after that final moves towards C-cycle for last Lower-Low point around FWB:67K -65k approx, and that will be completing around next 120-150 days with 0-A-B-C of this cycle around July-August approx..
While, from 0 to A cycle was its first movement point of Retest of lower point, after the Bitcoin's $109k #AllTimeHigh point was at 0 point and $76k is the direction of Point A.
Then, after the completion of this cycle of Correction Wave, Bitcoin's final BullRun movement will be starts around August onwards for next 120-150 days for this season last Bullish cycle to reach out min. $180k to $220k and max. Mark will be around $250k to $280k approx.
Thereafter, the #BearishZone of market will be starts next year, after completion of this Elliott Impulsive & Correction Wave pairings, which is completely starts from Nov. 2022 from its last Lower-Low mark up point of Bitcoin was $15.5k approx.
Anyways,
Study deeply always to perform any trade and take StopLoss strategy for that as well DYOR too...🙏

BTC/USDT Analysis – The Climax Is Near
Hello everyone! This is the trader-analyst from CryptoRobotics, and here is your daily analysis.
The Bitcoin scenario remains mostly unchanged as we continue to move sideways. Buyers have not stepped in yet, but movement toward the upper boundary of the range is still the priority. This is indicated by the absorption of market selling, seen through the cumulative delta.
We are currently being squeezed into a very narrow range, so we can expect a strong breakout in either direction soon.
Sell Zones:
$95,000–$96,700 (accumulated volume),
$97,500–$98,400 (initiative volume pushing upward),
$107,000–$109,000 (volume anomalies).
Buy Zones:
$82,700–$81,400 (high-volume area),
Level at $74,800,
$69,000–$60,600 (accumulated volume).
What do you think — which direction will the current range break?
Share your opinion in the comments — it’s always interesting to compare views!
*This publication is not financial advice.

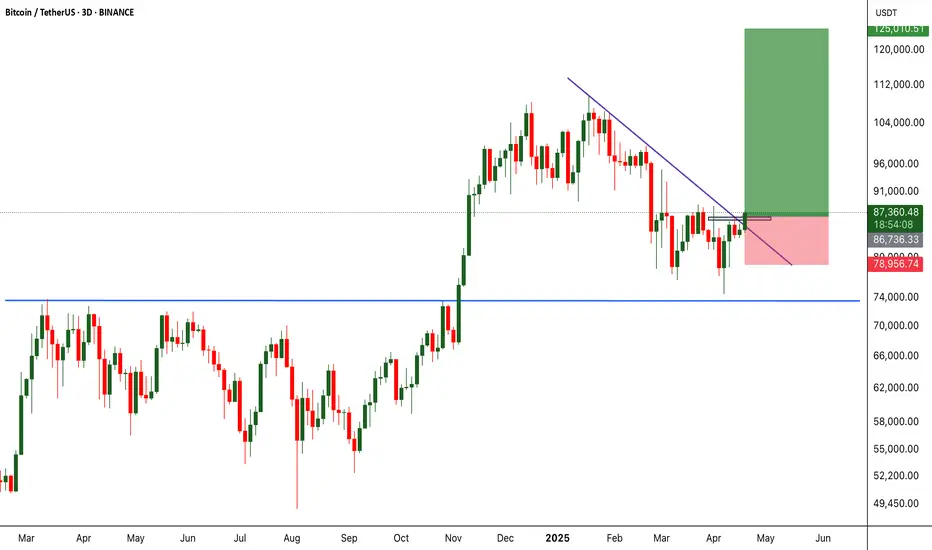
BITCOIN WEEKLY ANALYSIS - April 18th, 2025BTC/USD is currently hovering just below a major descending trendline and key horizontal resistance near the 91,500 level. 🧱
🔍 What We’re Watching:
- Price has tested the downtrend line multiple times — the structure is weakening.
- A breakout above 87,500 could trigger a strong bullish move.
- Until then, "Wait for the Breakout" remains the strategy. No confirmed long entries yet.
📉 Current Price: $84,500
📈 Breakout Confirmation: Clean close above resistance zone + volume spike = 🔥🔥 potential rally.
🧠 Pro Tip: False breakouts are common. Watch for confirmation — not just a wick!
Stay sharp, stay patient. Breakouts give the best reward-risk trades! 💹
