BTC/USDT Analysis – Balanced Forces
Hello everyone! This is CryptoRobotics’ trader-analyst with your daily market update.
Yesterday, Bitcoin followed our primary short scenario and reached the local low, where we spotted a market seller — visible through the bar’s delta. Currently, we’re trading within a clear sideways range.
The previously mentioned $84,700 level showed no buying reaction, so we now expect potential selling activity around that zone if the price returns there.
Our main expectation is a breakdown of the lower boundary of the range, followed by a test of the nearest buy zone.
Sell Zones:
$85,000–$86,200 (strong market seller),
$85,600–$88,000 (absorption of aggressive buying),
$95,000–$96,700 (accumulated volume),
$97,500–$98,400 (pushing volumes),
$107,000–$109,000 (volume anomalies).
Buy Zones:
$82,700–$81,400 (volume zone),
Level at $74,800,
$69,000–$60,600 (accumulated volume).
What do you think — which direction will this sideways range break?
Drop your thoughts in the comments — it’s always interesting to compare perspectives!
This post is not financial advice.
Bitcoinprediction


BTCUSDT – Big Move Incoming, Key Level To watch!Bitcoin is approaching a key decision area after a few months of downward pressure. The chart shows a clear bearish structure with lower highs and lower lows. Recently, a possible double top has formed just below the major resistance near 88.668, which could suggest a short-term pullback if buyers don't step in.
If the double top plays out, a retest of the support zone between 78.576 and 82.000 is likely. This zone has held well in the past and could act as a strong base again.
However, if price manages to break and hold above 88668, that would be a strong signal of strength. It could mark a shift back to a bullish trend, with the next major target being the all-time high area around 108.360.
Key areas to watch:
Support: 78.576 to 82.000
Resistance: 88.668 and 108.360
Right now, Bitcoin is at a make-or-break point. A breakout could trigger a strong rally, while rejection may lead to another dip. Stay patient, watch how price reacts at these levels, and let the market confirm the next move.

BTC/USDT Analysis – Shorts in FocusHello everyone! This is CryptoRobotics’ trader-analyst with your daily analysis.
Yesterday and today, Bitcoin continued to trade sideways and even attempted to break the local high, but was met with market selling pressure.
At the moment, we still prioritize the short scenario. Around the ~$84,700 level, we observed a battle between buyers and sellers. If the price consolidates below this level, it will confirm the bearish scenario and we’ll look for a move down to the next buy zone.
If buyers strongly defend this level, we may retest the local high.
Sell zones:
$85,600–$88,000 (absorption of aggressive buying),
$95,000–$96,700 (accumulated volume),
$97,500–$98,400 (pushing volumes),
$107,000–$109,000 (volume anomalies).
Buy zones:
$82,700–$81,400 (volume zone),
Level at $74,800,
$69,000–$60,600 (accumulated volume).
What do you think will happen first?
A full breakout through the sell zone and continuation of the uptrend, or a correction?
Share your thoughts in the comments — would be interesting to compare views!
This post is not financial advice

Bitcoin: The Tides are Shifting BULLISH Based on Price Action Based on price action analysis utilizing market structure and a variety of trend change confirmation tools, I am looking to long dips in Bitcoin.

Bitcoin Bullish Bat Harmonic Forming – Breakout Imminent!?Bitcoin ( BINANCE:BTCUSDT ) then reached $85,500 , as I expected in my previous post .
Today, I want to share with you a short-term analysis of Bitcoin , and Bitcoin can break the Important Resistance line !
Bitcoin is trading near the Support zone($83,880-$82,380) and Support lines .
Bitcoin is likely to start rising again with the help of the Bullish Bat Harmonic Pattern .
I expect Bitcoin to start rising again either with the help of the Bullish Bat Harmonic Pattern or near the Support lines and Cumulative Long Liquidation Leverage($82,426-$81,439) . The first target could be the important resistance line , and if it breaks, it looks like Bitcoin could break the resistance zone ($87,520-$85,840 ) as well.
Cumulative Short Liquidation Leverage: $86,624-$85,486
Note: To break the Important Resistance line , we need a candle with high volume at least on the 4-hour time frame , like the Bullish Marubozu candle ; otherwise, it is probably we will see fake break . Since this line is of great importance, it is better to look for a confirming candle on the 4-hour time frame as well ( even a Doji candle with a small green body ).
Note: If Bitcoin falls below $81,000, we can expect further declines.
Do you think Bitcoin can break the Important Resistance line!?
Please respect each other's ideas and express them politely if you agree or disagree.
Bitcoin Analyze (BTCUSDT), 15-minute time frame.
Be sure to follow the updated ideas.
Do not forget to put a Stop loss for your positions (For every position you want to open).
Please follow your strategy and updates; this is just my Idea, and I will gladly see your ideas in this post.
Please do not forget the ✅' like '✅ button 🙏😊 & Share it with your friends; thanks, and Trade safe.

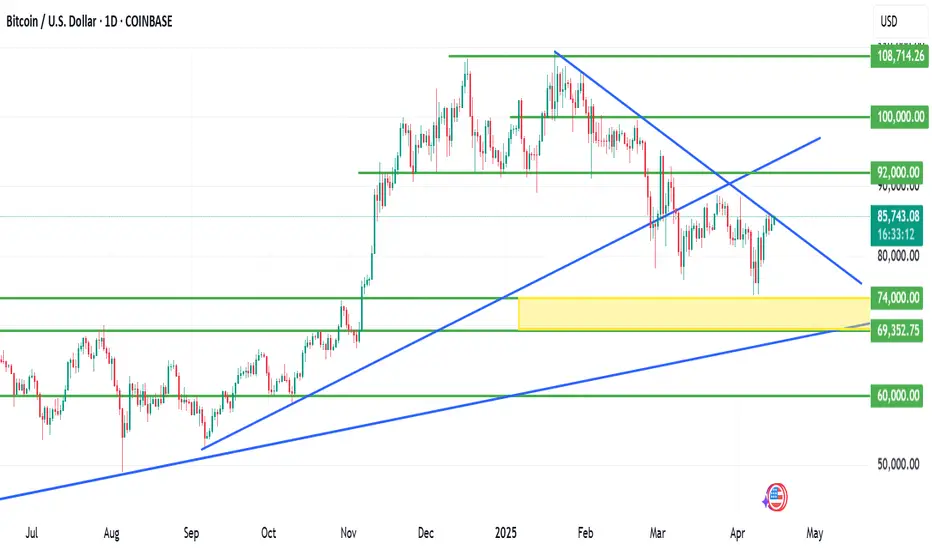
BITCOIN is kissing a critical resistance zoneBITCOIN is kissing a critical resistance zone.
Bitcoin is currently kissing a critical resistance zone, hovering around the $85,500 level. This region aligns closely with a descending trendline that has historically capped BTC rallies, and this test comes after a sharp recovery from a local low near $74,000, a drop that was triggered in tandem with broader risk-asset selloffs following U.S. tariff announcements and rising global macroeconomic tension.
Technical Analysis
The descending trendline (marked in blue on the chart) acts as a key resistance.
A daily close above $85,800 - $86,200 could confirm a breakout, potentially paving the way for a fresh attempt toward the $90,000 psychological level.
Conversely, failure to break and hold above this resistance could cause a rejection and pullback.
Immediate downside support lies at the previous local low (~$74,000), and below that, the next strong support zone is around $69,000 (yellow block on chart).
Fundamental Backdrop
Bitcoin continues to be driven by macroeconomic news, institutional flows, and growing ETF inflows.
If fundamentals remain bullish, including continued institutional accumulation, favorable regulatory developments, or increased on-chain activity, they could fuel momentum for a breakout.
The market doesn’t reward assumptions — it rewards preparation.
Whether it’s a breakout or a pullback, risk management should always come first. As always, protect your capital before thinking of profit. Use stop-losses, scale your entries, and avoid over-leveraging in volatile zones like this.
What’s your take on BTC at this juncture?
Do you see a breakout brewing, or is this another trap for over-leveraged bulls?
Let’s discuss
Trump's Crypto Policies Drive Bitcoin Dominance to New HighsSince President Trump's inauguration, Bitcoin dominance (BTC.D) has steadily climbed from around 55% to over 63%, reflecting a significant shift in market dynamics. This rise is largely attributed to the U.S. government's strategic accumulation of Bitcoin, including the establishment of a Strategic Bitcoin Reserve funded by seized assets. Such initiatives have redirected capital from altcoins to Bitcoin, reinforcing its dominance in the cryptocurrency market.
BTC Dominance (BTC.D) is hovering at a critical resistance zone between 63% and 64%. A breakout above 65% could signal increased capital flow into Bitcoin, potentially pushing its price down to $75K or even $55K, while altcoins may underperform. Conversely, a rejection at this level might indicate the onset of an altcoin season. Currently, Bitcoin is trading around $85K, awaiting a catalyst to determine its next significant move.

BLOODY FEBRUARY TO GREENY SUMMERFrom my initial Technical analysis from 100k down to 74k last february where we at now? so we have filled the CME gap and grabbed some liquidities. Price broke out from the trendline and now we goin to see some green daily/weekly candles to retest the 100k levels. If this fails to make an all time high. 2026 might be the bear market so hold your horses. and ready your capital bois.

Bitcoin Parallel Channel Master Analysis🟦 Parallel Channel Overview
The chart reveals a well-established ascending parallel channel, guiding Bitcoin’s price action over an extended period.
The upper and lower bounds have been respected multiple times, validating the strength and consistency of this trend structure.
Price currently hovers near the midline, following a bounce from the lower boundary, indicating the channel remains intact and bullish momentum is supported.
🧭 Current Price Action
A recent dip tested the lower boundary and was met with strong buying interest — a bullish sign.
Price is now pressing up against the midline, which acts as a crucial pivot:
A successful flip of the midline to support could propel the price toward the upper channel boundary.
A failure here may trigger another retest of the lower support.
📌 Key Structural Levels
Lower Channel Support: The primary demand zone; a breakdown here could suggest a broader structural change.
Midline (Median): The dynamic pivot — the battleground for bulls and bears.
Upper Channel Resistance: Where profit-taking or breakout acceleration typically occurs.
🔁 Repeating Breakout Pattern: Timeline & Insights
🔹 1st Breakout – February 2024
Price breaks above the channel and sets a new high.
Eventually retraces back into the channel.
In August 2024, the break out area from February becomes midline support, validating the zone.
🔹 2nd Breakout – November 2024
Another breakout occurs, reaching a peak roughly equal to the first breakout.
In April 2025, price once again retests the midline, mimicking the previous August retest behavior.
🟡 Pattern Recognized
Breakout → Peak → Pullback to Midline Support → Reaccumulation → Breakout
With this repeating structure, a 3rd breakout is likely, assuming midline support holds.
Based on historical intervals:
Feb to Nov 2024 = ~9 months
Aug to Nov = ~3 months
This positions the next breakout for June 2025, following the April retest.
🔮 Projected Outcome: 3rd Breakout
If the vertical breakout range repeats:
3rd breakout peak could mirror the height of previous breakouts.
⚖️ Summary & Strategic Implications
✅ Structure is bullish as long as Bitcoin trades within or above the channel.
✅ Midline bounces have reliably preceded breakouts — current April 2025 retest strengthens that thesis.
✅ June 2025 becomes a critical breakout watch window.
❌ Break below the midline would invalidate the repeating breakout structure and shift focus to lower support zones.

BTCUSD – Bullish Breakout Loading ?
📈 *Bitcoin Daily Chart Analysis – April 14, 2025*
Bitcoin is looking 🔥 as it pushes higher from a key **accumulation zone** after a sharp recovery from recent lows. The previous **rising channel** was broken to the downside, but now the price is forming a solid **bullish structure**, suggesting a strong comeback is in play!
---
### 🔍 Technical Highlights:
- ✅ **Demand Zone Bounce:** Clean rebound from the highlighted green box (accumulation area), signaling buyer strength.
- 📈 **Higher Highs Incoming?** Price is now consolidating near **$85,000**, with bullish momentum building.
- 📊 **Upside Target:** Eyes on $87,000 → $88,500 if momentum sustains and daily closes continue above resistance.
- 📌 **Key Support:** $84,000 holds the line — invalidation below that would shift bias.
---
### 🧠 Trader's Insight:
The structure is setting up for a **potential bullish continuation**. Momentum traders should watch for a confirmed break and close above $85,400 for further upside! 🚀
💬 *"Patience in accumulation pays in breakout."*
Ready to catch the next leg up? 📲 Let’s trade smart and ride the wave.

Market overview
WHAT HAPPENED?
Last week, our main scenario was implemented and a full–fledged rebound from the $77,000-$73,000 zone was achieved (volume anomalies, pushing volumes).
After passing through several large selling zones, we’ve reached a resistance level from which we can get a significant correction.
At the moment, the $85,600–$88,000 zone is being tested (absorption of the buyer's market aggression). The latest wave of buys, which began on April 10, is inertial. Trading volumes have decreased, and there is no clear dominance between one side and the other.
WHAT WILL HAPPEN: OR NOT?
There are strong anomalies along the delta, which can provoke a significant correction. Below the current price, we have a support zone of $82,700–$81,400, but with high activity from the seller, it can only slow down the fall slightly.
The main expectations are the beginning of a corrective movement, as indicated by the nature of growth, the current volume zone, as well as delta protection.
A less likely scenario is a surge in the buyer's market activity, which will take the quote above the $88,000 level. In this case, the priority will change dramatically to long.
Sell Zones:
$85,600–$88,000 (absorption of aggressive buyer activity)
$95,000–$96,700 (accumulated volumes)
$97,500–$98,400 (pushing volumes)
$107,000–$109,000 (volume anomalies)
Buy Zones:
$82,700–$81,400 (volume zone)
Level at $74,800
$69,000–$60,600 (accumulated volumes)
IMPORTANT DATES
The following macroeconomic events are expected:
• Wednesday, April 16, 2:00 (UTC) — publication of China's GDP for the first quarter and in comparison with the first quarter of 2024;
• Wednesday, April 16, 6:00 (UTC) — publication of the UK consumer price index for March and in comparison with March 2024;
• Wednesday, April 16, 09:00 (UTC) — publication of the consumer price index in the Eurozone for March and in comparison with March 2024;
• Wednesday, April 16, 12:30 (UTC) — publication of the basic index and volume of US retail sales for March;
• Wednesday, April 16, 13:45 (UTC) — announcement of Canada's interest rate decision;
• Wednesday, April 16, 17:15 (UTC) — speech by Fed Chairman Jerome Powell;
• Thursday, April 17, 12:30 (UTC) — publication of the number of initial applications for US unemployment benefits, as well as the Philadelphia manufacturing activity index from the Federal Reserve Bank for April;
• Thursday, April 17, 12:45(UTC) — European Central Bank press conference;
• Thursday, April 17, 13:15 (UTC) — announcement of the deposit rate in the Eurozone.
*This post is not a financial recommendation. Make decisions based on your own experience.
#analytics

Bitcoin BTC price analysisThis is approximately the roadmap we have "imagined" for the coming weeks for the movement of the CRYPTOCAP:BTC price:
1️⃣ The most optimistic scenario is that the OKX:BTCUSDT price stays above $76100 - 77100, which means that the “bottom” has finally been found, and we can organize at least a rebound to $94k.
2️⃣ Not a pleasant scenario, but not the worst either, is another update of the local lows of #Bitcoin to $71100 and from there a rebound to the above-mentioned $76100-77100 zone, where we will have to "looking out" again: where to go next...
3️⃣ The most pessimistic, and maybe the most realistic scenario in times of total uncertainty, when it is not clear what the "rusty can" will wake up with in. ✊
All market participants will delay their "buying" decisions as much as possible until it becomes clear whether the Fed will cut the rate or not. The next FOMC meeting is on 07.05.25.
To understand what will happen to altcoins during this time, you need to at least monitor and analyze the #BTC.D and #USDT.D indicators, which we do daily in our reviews in...
✍️ It is your right, if not your duty, to follow this plan or make your own adjustments!)
And we will be happy to read and see your charts, with your forecasts for the near future in the comments below the idea.

BTC to likely kiss the $74K - $69KBitcoin Market Analysis and Forecast
Bitcoin has retraced over 50% from its all-time high (ATH). Despite a rebound from the Fibonacci 50% level to its current price of $84,600, continued selling pressure could push BTC lower toward the Fibonacci 61.8% retracement zone, which lies between $74,000 and $69,000.
This potential pullback presents strategic entry points for long-term investors who have the patience to hold through market cycles.
Given the current market conditions, I will continue to accumulate using a Dollar-Cost Averaging (DCA) strategy to mitigate volatility and optimize long-term gains.
I will be monitoring the price action closely and providing further updates as the market develops.

BTC with a double top formation.BTC with a double top formation.
Are we in for a long sell ride?
Has the imminent midterm sell started?
Are we breaking the $100K zone towards $90K this time?
Trump swearing was the catalyst we waited for to fire this asset to the moon lately.
Let's see what plays out.
Trade with care.

$BTC Rebounds to $84K Amid Downtrend—Eyes on $88.8K Resistance Bitcoin (BTC) is currently trading at $84,273.58, recovering slightly from recent lows. The price has increased 5.97% over the past 7 days, though it slipped 1.04% in the last 24 hours. The asset maintains a dominant position with a market cap of $1.67 trillion and a 24-hour trading volume of $28.46 billion, marking a 16.32% surge in activity.
From a technical perspective, Bitcoin remains in a corrective bearish structure. After hitting its all-time high of $109,358 on January 19, the price entered a steady decline, forming a series of lower highs and lower lows. This internal structure signals a bearish break of structure (BOS), reinforced by macroeconomic pressures, including a market-wide dip triggered by Trump-era tariffs.
Technical analysis
Following a recent low near $74,000, Bitcoin has rebounded but has yet to invalidate the prevailing bearish trend. The key resistance level now lies at $88,800, which represents the most recent lower high. If Bitcoin closes above this level with strong bullish momentum, the trend could shift, potentially paving the way for a new leg up toward previous highs.
Until that breakout occurs, however, the trend remains technically bearish. A failure to overcome the $88,800 resistance could lead to renewed selling pressure. In that case, Bitcoin may retrace to support zones between $72,000 and $74,000. These levels are critical for bulls to defend in order to avoid a deeper correction.
As the market continues to digest both macroeconomic news and technical signals, all eyes remain on whether Bitcoin can flip its structure and reclaim bullish territory.

Time to get Bitcoin Range in perspective again -where are we ?
This chart clearly shows us where BTC PA is in relation to the ATH it created in Early 2025.
PA sits just above centre line of current Lower range box.
There is still a Long way to go, against some strong resistance, to get back into the upper Range box and to that ATH line
We will manage it, I have no doubt about that But we may get to top of current Range box and be rejected before that time comes.
There are a number of different scenarios that exist right now and it is next to impossible to pin point when we may reach higher, to a New ATH.
My Feeling is that we will hit top of this current range box in the near future ( in april )
From that point, we have to weigh up the Macro and Sentiments of Markets and see.
But for now, Bitcoin PA is with Strength and has tha bility to reach higher.
I am still Bullish fora Cycle ATH in Q4

Bitcoin's Bounce, Your Weekly Scoop on the Bullish Surge !The market has unfolded as anticipated, aligning with our projections.
Short-Term Outlook: Expect a relatively narrow trading range this week due to the absence of major news catalysts.
Bullish Perspective: We maintain a bullish stance, targeting a price range of $88,000–$92,000.
Local Bottom Confirmation: Bitcoin appears to have established a local bottom. Notably, it diverged from Ethereum, which recorded lower lows, while Bitcoin resisted forming a new low.
Technical Analysis: Last week, Bitcoin respected a daily bullish order block, resulting in a strong upward move.
Key Support Level: This week, an inverse fair value gap (FVG) on the daily chart around $82,400 is expected to act as a liquidity zone and support, with price likely to tap this level and rebound higher.
Thank you for your support! Stay tuned for more insights and drop a Like if you loved it 🚀

Bitcoin - Bulls Took Control: 85k Next?Bitcoin continues to show signs of strength as the previously formed double bottom structure remains valid. This pattern, commonly associated with a bullish reversal, suggests that buyers have successfully defended a key support area and are now regaining control. The second bottom reinforced the significance of this level, confirming the presence of demand and a potential shift in momentum.
Unlike the previous scenario where bearish pressure threatened to invalidate the pattern, this time the market has respected the formation. The double bottom is holding firm, and price has begun to move higher, offering further confirmation of short-term bullish intent.
Support Found Within the 4-Hour Imbalance
A critical turning point in the current price action came as Bitcoin dipped into a 4-hour imbalance zone and found strong support. This area, marked by a sharp displacement in price, often acts as a magnet for liquidity before the market continues in its intended direction. The bounce from this imbalance not only held but was followed by a decisive move above the zone.
This development is important because it confirms that buyers were waiting in this inefficiency to accumulate, and the resulting upward movement reinforces the idea that this was a high-probability support level. The break above the imbalance now positions Bitcoin to potentially pursue higher liquidity areas.
Potential Move Toward the 4-Hour Fair Value Gap
With the imbalance zone now acting as support, price appears poised to push higher into the next key area: the 4-hour fair value gap located above. This FVG has not yet been fully filled, and Bitcoin has historically shown sensitivity to this zone, rejecting multiple times from it without managing to reclaim or fill even 50% of the gap.
Given the current bullish structure and momentum, there is now a real possibility that price could seek to fill this fair value gap more substantially—potentially up to the 85,000 region. This would align with the typical behavior of price returning to inefficiencies in the market, especially when backed by a valid reversal pattern such as the double bottom.
The 85,000 area also overlaps with a previously defined resistance, so while this presents a logical target for bulls, it may also be where sellers attempt to reassert themselves. Watching price behavior as it approaches this zone will be crucial for managing risk and spotting any early signs of reversal.
Conclusion
Bitcoin is currently respecting the double bottom structure and has found renewed strength after bouncing from the 4-hour imbalance zone. With price now above this key support, the path of least resistance appears to be to the upside, targeting the fair value gap near 85,000. This zone remains unfilled and represents a likely draw for price in the short term.
Unless we see a strong rejection or sudden weakness, the current setup supports a bullish continuation scenario, with eyes on a partial or full fill of the FVG. Traders should continue to monitor the strength of this move and look for reactions near the 85,000 level to determine whether momentum will sustain or fade.
__________________________________________
Thanks for your support!
If you found this idea helpful or learned something new, drop a like 👍 and leave a comment, I’d love to hear your thoughts! 🚀
Make sure to follow me for more price action insights, free indicators, and trading strategies. Let’s grow and trade smarter together! 📈

Tariff Shock Sends BTC to 75K — Can Bulls Reclaim 86K?Greetings...
Bitcoin faced a sharp decline to the 75,000 level following the announcement of tariffs, which triggered panic and heightened uncertainty across the crypto market. Currently, BTC is attempting to reclaim the key 85,000 resistance zone. However, a descending trendline is capping upward momentum, adding to the difficulty of a clean breakout. A decisive weekly close above 86,000 could invalidate the bearish setup and open the door for bullish continuation. Conversely, failure to break and close above this level would likely lead to a swift drop toward the 71,000 support zone, with minimal structural support in between.
A weekly close below the 85,000 level would confirm bearish continuation, opening the door for a retest of the 72,000 support zone — a key structural level that previously acted as a demand area. Failure to hold above 72,000 could invalidate the current range and trigger a deeper correction toward the prior macro support around 55,000. Based on current momentum and price structure, a move toward the 55,000 region appears increasingly probable in the near term.

Weekly Support is around 80000.Weekly Support is around 80000.
However, 72500 - 73000 is its previous
breakout level & probably a Best Buying Rage
(if it touches) which is also a Confluence area of
Trendline Support+Important Fib. level.
Bullish Divergence on Shorter Time Frame +
Weekly Support around 80000 (if Sustained)
may push the Price up towards 87000 &
then around 95000 - 96000.
Ultimate Resistance is around 110000.
Crossing this level may open new Highs
Targeting around 136000.
On Shorter Timeframe, 85000 - 86000 is
the Immediate Resistance & Support is
around 80000.

Btc Next Move This setup is Based on SMC and ICT Advanced
Follow Risk Management ! This trade will give you Minimum 1:3
Enjoy this Trade and Print Dollars

Bitcoin’s 80-Day Correction Ending!?(Signs)Today, I want to share with you a mid-term analysis of Bitcoin( BINANCE:BTCUSDT ), I hope it will be useful for you.
Please stay with me.
Bitcoin started to fall last week due to the tariffs that Donald Trump imposed on countries around the world. In general, since last week, Bitcoin has become more correlated with US stock market indices (such as FOREXCOM:SPX500 ) than before.
But yesterday, Donald Trump postponed the implementation of tariffs for 90 days , except for China , which caused the US stock market indices to grow rapidly, and Bitcoin did not miss out on this growth. So, for the next 90 days , we should wait for news of bilateral tariffs between China and the US , which is likely to make an agreement between the two countries. What do you think!?
Also, just minutes ago, key U.S. inflation data was released — and it came in softer than expected.
The CPI m/m dropped to -0.1%, and Core CPI m/m slowed to 0.1% , both missing forecasts. This drop in inflation significantly reduces immediate pressure on the Fed to maintain a hawkish stance . With inflation cooling off, the market is now pricing in a more dovish Fed , which has historically been a bullish catalyst for Bitcoin .
Also, in the last 24 hours , another positive news came for Bitcoin: " China and Russia are using Bitcoin to settle energy trades ," which could be effective in increasing the price of Bitcoin .
--------------------------------------------
Now, based on the above explanation, let's focus on analyzing the Bitcoin chart on the 12-hour time frame .
Bitcoin started to rise quickly after touching the Heavy Support zone($73,780-$59,000) , Potential Reversal Zone(PRZ) , and 50_SMA(Weekly) . It seems that the Important Uptrend line breakout has NOT been successfully completed. One sign of a return could be the formation of a Morningstar Candlestick Pattern , which has also been accompanied by good volume .
Bitcoin has been moving in a descending channel for the past 80 days since its All-Time High(ATH=$109,588) , so a break of the upper line of this descending channel could be a significant sign of a rebound for Bitcoin .
Bitcoin is trying to break the Resistance zone($84,000-$81,130) . The price that is important for Bitcoin right now is $84,000 ; if Bitcoin can close a candle on the 4-hour time frame above the Resistance zone($84,000-$81,130) and $84,000 , we can hope for a breakout of the descending channel.
In terms of the Elliott Wave theory , Bitcoin appears to have been in a Double Three Correction(WXY) for the past 80 days. A break of the descending channel could reconfirm the end of this correction.
I expect Bitcoin to fill the CME Gap($85,940-$85,240) after breaking the Resistance zone($84,000-$81,130) in the first step and make the first attack on 50_SMA(Daily) . If the descending channel breaks, the second target could be around $88,000 , where there is an important Cumulative Short Liquidation Leverage($89,319-$88,375) .
Also, if Bitcoin moves in a range between $90,000 and $85,000 , we can expect an Altseason , given the conditions of BTC.D% ( CRYPTOCAP:BTC.D ). What do you think?
Note: If Bitcoin falls below $77,200, we should expect further declines.
Note: If Bitcoin can break the Heavy Resistance zone($95,000-$88,500), we should expect a new All-Time High(ATH).
Please respect each other's ideas and express them politely if you agree or disagree.
Bitcoin Analyze (BTCUSDT), 12-hour time frame.
Be sure to follow the updated ideas.
Do not forget to put a Stop loss for your positions (For every position you want to open).
Please follow your strategy and updates; this is just my Idea, and I will gladly see your ideas in this post.
Please do not forget the ✅' like '✅ button 🙏😊 & Share it with your friends; thanks, and Trade safe.
