Rising Wedge for #BTCUSDTWhat’s visible on the BYBIT:BTCUSDT.P chart:
📈 Rising Wedge:
➡️ This is a potentially bearish pattern for BYBIT:BTCUSDT.P , especially when it appears after a strong rally following a deep drop (which is exactly the case here).
➡️ The price has almost reached the upper boundary of the wedge and has already formed a second top (Top 2) — a signal of possible weakness.
🔵 Levels:
➡️ POC BYBIT:BTCUSDT.P — $82,490.8 has already been broken to the upside, indicating current market strength.
➡️ The price is approaching major resistance at $83,807.1 — momentum is already slowing down in this zone.
➡️ Support remains in the $80,449.7 – $78,412.7 area.
📊 Volume:
➡️ The rally was supported by high volume, but the most recent candles show declining volume as the price nears the top of the wedge.
➡️ This could indicate weakening buying pressure.
📉 Why it’s important to be cautious with long positions:
➡️ A rising wedge can act as a bull trap.
➡️ The price is near a critical resistance — even a small pullback could lead to a wedge breakdown.
➡️ After such a steep run (from 73K to almost 84K), the chance of profit-taking and a pullback is high.
➡️ Volume is declining — bullish momentum may be fading.
📢 Conclusion:
➡️ Opening a BYBIT:BTCUSDT.P long position right now is risky because:
- the wedge structure suggests a potential reversal to the downside;
- there’s no breakout above the previous high with confirmation;
- and volume does not support further upward movement.
❗️ It's better to watch how the price reacts to the wedge and BYBIT:BTCUSDT.P key levels — a long entry is only valid if the price breaks and holds above $83,800–84,000 with strong volume.
➡️ Until then, a neutral or cautiously bearish position is more appropriate.
Bitcoinprediction

BTC/USDT Analysis – Shorts in FocusYesterday, Bitcoin showed no buyer reaction from our highlighted zone at $81,000–$80,000 (pushing volumes). Therefore, even though we've been climbing throughout the day, short positions remain the priority.
At the moment, we've reached a mirrored volume zone at $81,000–$82,700, which has slightly shifted. We're currently near the upper boundary of this zone.
We've observed abnormal buyer activity in this area that so far hasn't led to any meaningful result, along with signs of hidden selling. A break below $81,000 would confirm the short scenario.
Sell Zones:
$81,000–$82,700 (mirrored zone, volume anomalies)
$85,600–$88,000 (absorption of buyer aggression)
$95,000–$96,700 (accumulated volumes)
$97,500–$98,400 (pushing volumes)
$107,000–$109,000 (volume anomalies)
Buy Zone:
$69,000–$60,600 (accumulated volumes)

BTC : What I’m Watching Now AND What I'm Worried AboutWhat I’m Watching Now:
I’m eyeing a potential buy from the 1H Order Block below.
It lines up clean, and the move makes sense…
But Here’s What I’m Worried About:
There’s a double bottom resting at the weekly FVG.
Which means: liquidity.
If price wants that liquidity first,
it might run deeper —
breaking the OB before the bounce.
Stay sharp.
And like always — wait for confirmation.
Patience > Prediction

BTC/USDT Analysis – Trump Surprises the Market AgainOn Wednesday evening, Trump once again shook the global community by announcing a 3-month suspension of tariffs, while keeping the base rate at 10% for all countries except China. This triggered a wave of euphoria in the markets: the S&P 500 surged 9%, Bitcoin gained just over 8%, and Ethereum jumped 13%.
Bitcoin broke through the key sell zone at $78,000–$80,000 (volume zone) without any noticeable reaction. Upon reaching the next sell zone at $82,000–$83,900 (volume zone), a correction followed.
A new pushing volume zone was formed during the rally at $81,000–$80,000. Whether buyers react here or not will determine the next direction.
We highlight two main scenarios:
No buyer reaction → decline toward the local low.
Strong renewal of buying → movement toward the next sell zone.
Sell Zones:
$85,600–$88,000 (absorption of buyer aggression)
$95,000–$96,700 (accumulated volumes)
$97,500–$98,400 (pushing volumes)
$107,000–$109,000 (volume anomalies)
Buy Zones:
$81,000–$80,000 (pushing volumes)
$69,000–$60,600 (accumulated volumes)

BTCUSDT | Waiting for Precision – Not Just Price LevelsMany were tempted to short BTCUSDT around the $83,000 region, and I was closely watching it too. However, as always, I don’t take trades based solely on price levels. What separates professional trading from guesswork is the data behind the scenes, and in this case, CDV (Cumulative Delta Volume) did not show any bearish divergence. That’s why I completely passed on this level without hesitation.
🎯 What’s Next?
Upper Blue Box is My Focus: I’ve now shifted my attention to the next key upper blue box, where I’ll be looking for serious short opportunities, but only if LTF confirmations such as orderflow shifts, CDV divergences, or volume traps appear.
Why I Wait: Just because a price hits a “zone” doesn’t mean we react. Professional traders wait for confluence, confirmation, and controlled risk.
🔒 Smart Trader Checklist:
No CDV divergence = No trade.
Wait for price to enter the upper blue box and react.
Short only with proper lower time frame confirmation.
If price breaks above with strong momentum and retest, I will not insist on shorts. I will shift and look for longs.
💡 I trade with precision and patience—not emotion. These levels are not random lines, but key zones mapped with advanced tools and strict discipline. That’s why my followers consistently win, and why my success rate is among the highest you’ll find here.
If you want to trade with clarity, confidence, and data-backed precision, just keep following me. You’ll see the difference.
📌I keep my charts clean and simple because I believe clarity leads to better decisions.
📌My approach is built on years of experience and a solid track record. I don’t claim to know it all but I’m confident in my ability to spot high-probability setups.
📌If you would like to learn how to use the heatmap, cumulative volume delta and volume footprint techniques that I use below to determine very accurate demand regions, you can send me a private message. I help anyone who wants it completely free of charge.
🔑I have a long list of my proven technique below:
🎯 ZENUSDT.P: Patience & Profitability | %230 Reaction from the Sniper Entry
🐶 DOGEUSDT.P: Next Move
🎨 RENDERUSDT.P: Opportunity of the Month
💎 ETHUSDT.P: Where to Retrace
🟢 BNBUSDT.P: Potential Surge
📊 BTC Dominance: Reaction Zone
🌊 WAVESUSDT.P: Demand Zone Potential
🟣 UNIUSDT.P: Long-Term Trade
🔵 XRPUSDT.P: Entry Zones
🔗 LINKUSDT.P: Follow The River
📈 BTCUSDT.P: Two Key Demand Zones
🟩 POLUSDT: Bullish Momentum
🌟 PENDLEUSDT.P: Where Opportunity Meets Precision
🔥 BTCUSDT.P: Liquidation of Highly Leveraged Longs
🌊 SOLUSDT.P: SOL's Dip - Your Opportunity
🐸 1000PEPEUSDT.P: Prime Bounce Zone Unlocked
🚀 ETHUSDT.P: Set to Explode - Don't Miss This Game Changer
🤖 IQUSDT: Smart Plan
⚡️ PONDUSDT: A Trade Not Taken Is Better Than a Losing One
💼 STMXUSDT: 2 Buying Areas
🐢 TURBOUSDT: Buy Zones and Buyer Presence
🌍 ICPUSDT.P: Massive Upside Potential | Check the Trade Update For Seeing Results
🟠 IDEXUSDT: Spot Buy Area | %26 Profit if You Trade with MSB
📌 USUALUSDT: Buyers Are Active + %70 Profit in Total
🌟 FORTHUSDT: Sniper Entry +%26 Reaction
🐳 QKCUSDT: Sniper Entry +%57 Reaction
📊 BTC.D: Retest of Key Area Highly Likely
📊 XNOUSDT %80 Reaction with a Simple Blue Box!
📊 BELUSDT Amazing %120 Reaction!
I stopped adding to the list because it's kinda tiring to add 5-10 charts in every move but you can check my profile and see that it goes on..

Snot chewing will continue for another couple of monthsJust my opinion, but yesterday was a bear rally. I think we touch low 70s in May, then recovery before summer, slow summer, and a final leg up in September.

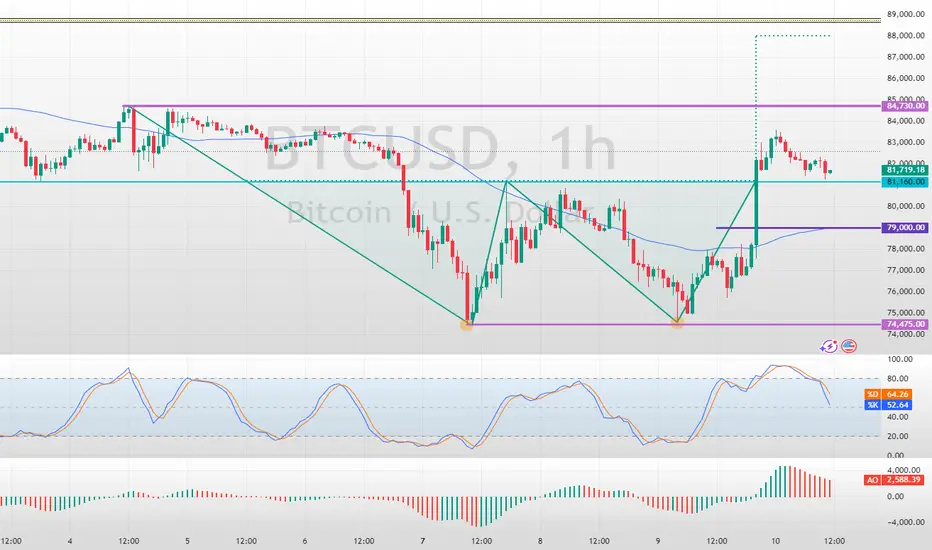
Bitcoin Double Bottom Pattern Came into PlayFenzoFx—Bitcoin jumped upward from $74,475 support as expected due to the formation of a double bottom pattern on the 1-hour chart, which is a bullish signal.
As of this writing, the price is stabilizing and testing the $81,160 mark as support. However, the 50-SMA on the 1-hour chart serves as the pivot point between the bull and bear market.
The next bullish target could be $84,730, followed by $88,000 if BTC holds above the discussed moving average.
Trade BTC/USD Swap Free at FenzoFx Decentralized Broker
BTC Update... What To Expect Now??Currently BTC is facing resistance of major trendline (Blue line)+ wedge resistance+ bearish OB resistance...
For bullish trend, currently Bitcoin have to break above all these resistances along with 89k level for confirmation of bullish trend....
If it fails and retraces back inside Monday high range, then we can expect price dropping below Monday lows where major support level is present+ Bat Harmonic Potential Reversal Zone+ 61.8 Golden Fib Level around 72000-70500 levels.

Bitcoin Eyes $81,500 Resistance Following Trump's Tariff Pause. 🚨 **Market Update** 🚨
President Donald Trump has announced a 90-day pause on the full effect of new tariffs for certain countries, and the markets are reacting strongly! 📈 Both the stock and crypto markets are surging as a result.
Right now, **Bitcoin** is testing the $81,500 resistance level on the 1-hour timeframe. 💥 Our trading strategy: let it break the resistance and sustain above it, then look for a solid entry on the pullback.
Stay tuned and trade wisely! 🚀💰

Can $DOGE Still Leapfrog $BTC...?The original thesis has not yet been invalidated, only pushed farther into the future.
The historical pattern is still there, and the reversal is part of it.
Does that mean DOGE will definitely flip BTC to the extreme upside?
Not necessarily.
But the two hypothetical trend lines will not validate/invalidate until DOGE begins to flip BTC more aggressively.
Then we'll know for sure by how much it flips BTC.
DYOR, STFU, Praise the Lord, and Pass the Ammunition.

BTC/USDT Analysis – Setup for a RangeYesterday, while we were trading within the $78,000–$80,000 zone, no significant market buying appeared, so the price moved to test the local low. The $74,500 level wasn't swept, and we saw strong absorption of market selling, which led to a rebound.
Currently, price is caught between a volume zone and an area of buyer activity, and the signs suggest a developing sideways range.
In the coming days, we expect a full test of the local low. A false breakout of this level could offer interesting long opportunities, though we also can't rule out a full breakdown and a move toward the next buyer zone.
Sell Zones:
$78,000–$80,000 (volume zone)
$82,000–$83,900 (volume zone)
$85,600–$88,000 (absorption of buyer aggression)
$95,000–$96,700 (accumulated volumes)
$97,500–$98,400 (pushing volumes)
$107,000–$109,000 (volume anomalies)
Buy Zone:
$69,000–$60,600 (accumulated volumes)

"Bitcoin vs U.S Dollar" Crypto Market Heist Plan (Scalping/Day)🌟Hi! Hola! Ola! Bonjour! Hallo! Marhaba!🌟
Dear Money Makers & Robbers, 🤑 💰💸✈️
Based on 🔥Thief Trading style technical and fundamental analysis🔥, here is our master plan to heist the BTC/USD "Bitcoin vs U.S Dollar" Crypto Market. Please adhere to the strategy I've outlined in the chart, which emphasizes long entry. Our aim is the high-risk Red Zone. Risky level, overbought market, consolidation, trend reversal, trap at the level where traders and bearish robbers are stronger. 🏆💸"Take profit and treat yourself, traders. You deserve it!💪🏆🎉
Entry 📈 : "The heist is on! Wait for the MA breakout (84.400) then make your move - Bullish profits await!"
however I advise to Place Buy stop orders above the Moving average (or) Place buy limit orders within a 15 or 30 minute timeframe most recent or swing, low or high level.
📌I strongly advise you to set an "alert (Alarm)" on your chart so you can see when the breakout entry occurs.
Stop Loss 🛑: "🔊 Yo, listen up! 🗣️ If you're lookin' to get in on a buy stop order, don't even think about settin' that stop loss till after the breakout 🚀. You feel me? Now, if you're smart, you'll place that stop loss where I told you to 📍, but if you're a rebel, you can put it wherever you like 🤪 - just don't say I didn't warn you ⚠️. You're playin' with fire 🔥, and it's your risk, not mine 👊."
Thief SL placed at the recent/swing low level Using the 30mins timeframe (82.000) Day trade basis.
SL is based on your risk of the trade, lot size and how many multiple orders you have to take.
🏴☠️Target 🎯: 87.500 (or) Escape Before the Target
🧲Scalpers, take note 👀 : only scalp on the Long side. If you have a lot of money, you can go straight away; if not, you can join swing traders and carry out the robbery plan. Use trailing SL to safeguard your money 💰.
BTC/USD "Bitcoin vs U.S Dollar" Crypto Market Heist Plan (Scalping/Day) is currently experiencing a bullishness,., driven by several key factors. 👇👇👇
📰🗞️Get & Read the Fundamental, Macro, COT Report, On Chain Analysis, Sentimental Outlook, Intermarket Analysis, Future trend targets... go ahead to check 👉👉👉🔗
⚠️Trading Alert : News Releases and Position Management 📰 🗞️ 🚫🚏
As a reminder, news releases can have a significant impact on market prices and volatility. To minimize potential losses and protect your running positions,
we recommend the following:
Avoid taking new trades during news releases
Use trailing stop-loss orders to protect your running positions and lock in profits
💖Supporting our robbery plan 💥Hit the Boost Button💥 will enable us to effortlessly make and steal money 💰💵. Boost the strength of our robbery team. Every day in this market make money with ease by using the Thief Trading Style.🏆💪🤝❤️🎉🚀
I'll see you soon with another heist plan, so stay tuned 🤑🐱👤🤗🤩

BITCOIN NEW SWING UPDATESHello folks, crypto folks. bitcoin might go to 3.168 fibs. but only if price can go lower 60k below.
THe idea of zoning for entries are a big risk for it.
This is only my view, this is a continuation pattern.
lets trade it to swing.
check my comments below I post some cool. stuff
THis is not a financial advice.
FOllow for more

Bitcoin Weekly For The Value Hunters & Range Enjoers. With lack of significant bid in the books until 70k. Ideally we drop to value sooner than later & gather demand with a range through summer. Supply has been chasing price down, with perps traders off loading latest positions yesterday in the US session.
This will be painful to most crypto traders but good for range trade enjoyers & spot value hunters.
Key levels: 70/71k Weekly & this is both spot & perps largest resting order blocks in the order books.

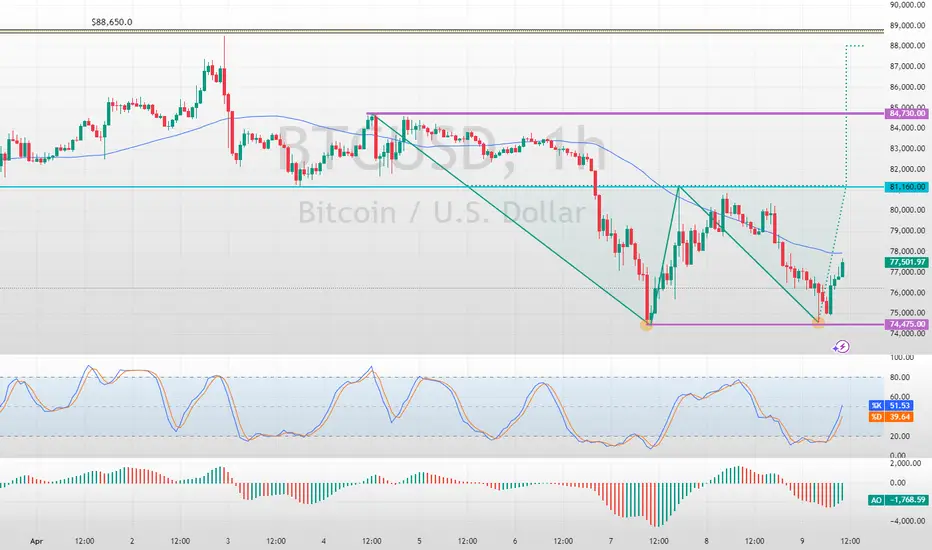
Bitcoin Formed a Double Bottom Bullish PatternFenzoFx—Bitcoin formed a double bottom bullish pattern. A consolidation phase toward $81,160 is imminent if the price holds above $74,475.
>>> Trade BTC/USD, swap free at FenzoFx Decentralized Forex Broker.

$$$ BTCUSD MACRO-BULLISH $$$ 1W CHART $$$BITFINEX:BTCUSD 1W Chart
There are many reasons to look at this weekly chart and see that there's absolutely no reason to be bearish on Bitcoin yet.
Holding strong r/s flip support.
Holding regression trend.
Holding parabolic trend.
Stoch RSI at the bottom.
Weekly bullish divergence.
Assuming this plays out in a way that's similar to the last local bottom, the current target is around $134k-$135k.
It would take a lot to invalidate all of these bullish indicators, but if that does somehow happen, with a CLOSE of the weekly candle that invalidated these, then It's pretty much definitely over for a loooong time.
NFA blah blah blah..

BTC/USDT Analysis – Expected ReboundWhile the entire market was panicking and selling off, our primary scenario was a rebound from the buyer zone at $77,000–$73,000, which has played out.
Yesterday, Bitcoin experienced an abnormal spike in volume. A breakout and consolidation either below or above the newly formed volume zone at $78,000–$80,000 will set the trend for the coming days.
Our main scenario suggests a move toward the sell zone above the current price. At the moment, we are seeing a slight absorption of market selling based on delta analysis.
In a bearish scenario, support is expected on a false breakout of the local low at $74,550.
Sell Zones:
$82,000–$83,900 (volume zone)
$85,600–$88,000 (absorption of buyer aggression)
$95,000–$96,700 (accumulated volumes)
$97,500–$98,400 (pushing volumes)
$107,000–$109,000 (volume anomalies)
Buy Zone:
$69,000–$60,600 (accumulated volumes)

Were To Buy BITCOINMartyBoots here , I have been trading for 17 years and sharing my thoughts on COINBASE:BTCUSD here.
.
BTC is very interesting chart for now that it has dipped 30% and trying to find support.
Do not miss out on BTC at the important levels as this will be a great opportunity
Watch video for more details

BITCOIN EMERGENCY!!!Please refer to my previous ideas on bitcoin it’s been a good flow on mapping where it goes :)
Bitcoin do historic moves we rally to 300k soon
Then eventually 2 million by 2030 see you guys on mars

BTCUSDT📊 Bitcoin Weekly Analysis – Smart Money Concept (SMC)
On the 1W BTC/USDT chart, we are currently observing a corrective move after a strong bullish impulse. The price is approaching a high-probability demand zone formed between two significant Fair Value Gaps (FVGs):
• 🔹 FVG 3M around $74,000
• 🔹 FVG M around $66,000
🟩 Long Setup Zone:
The area between these FVGs represents a discounted price zone where smart money is likely to step in. This is labeled as a “zone for long position” on the chart.
⸻
🧠 Smart Money Perspective:
• The market is in a retracement phase, targeting inefficiencies (FVGs).
• If price taps into this zone and shows signs of bullish intent (e.g., weekly bullish engulfing, BOS/CHOCH on lower timeframes), we can expect a strong upward move.
⸻
🎯 Mid-to-Long Term Target:
• Based on the current market structure and SMC model, the next major target is $130,000.
⸻
🔐 Risk Management:
• Ideal entry: within the FVG zone
• Stop-loss: below the lower FVG (around $65,000)
• Confirmation: bullish price action on lower timeframes or weekly candle close with strong momentum
⸻
📌 Conclusion:
This setup offers a potential high-reward opportunity if smart money reacts to this discounted zone. Patience and proper confirmation are key.
⸻

Bearish Bitcoin Faces Key ResistanceFenzoFx—Bitcoin trades bearishly below the critical resistance level of $81,160. If the price remains below this level, the downtrend will likely resume, targeting $74,000.

short op in BTCUSD on support turned resistanceShort opportunity on BTCUSD where support has turned resistance at $81k, tight stop at $81712, take 50% at $79390 and the rest at $74619
