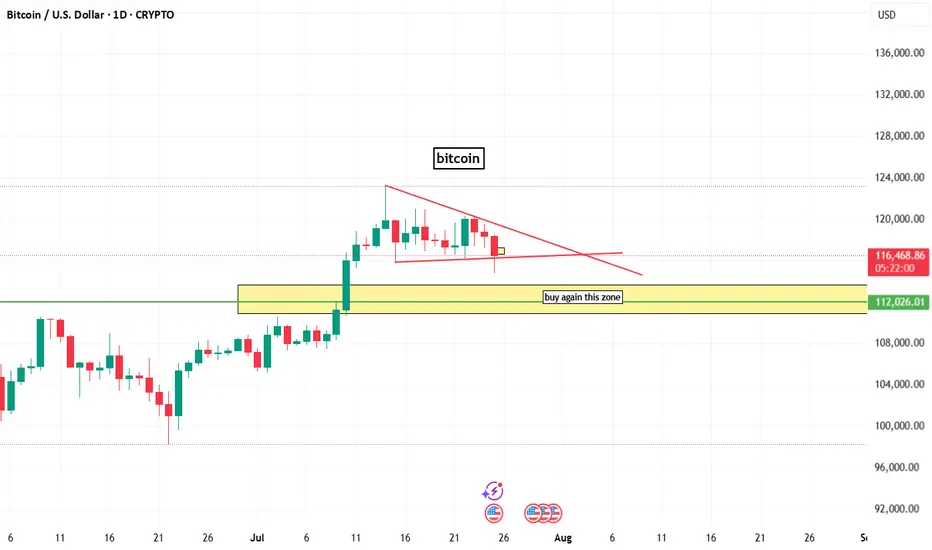
bitcoin chart analysisbitcoin chart analysis on daily time frame
here a buy zone that indicated by box and line.
and on chart bitcoin bullish but lower time frame btc is berrish.
Bitcoinprediction
Short-term BITCOIN analysisShor-term
In my opinion, Bitcoin could make a move towards $113,000-115,000 and then start moving upwards. In any case, according to previous analysis and apart from short-term fluctuations, it could touch the target of $140,000-150,000.
Good luck
NEoWave Chart

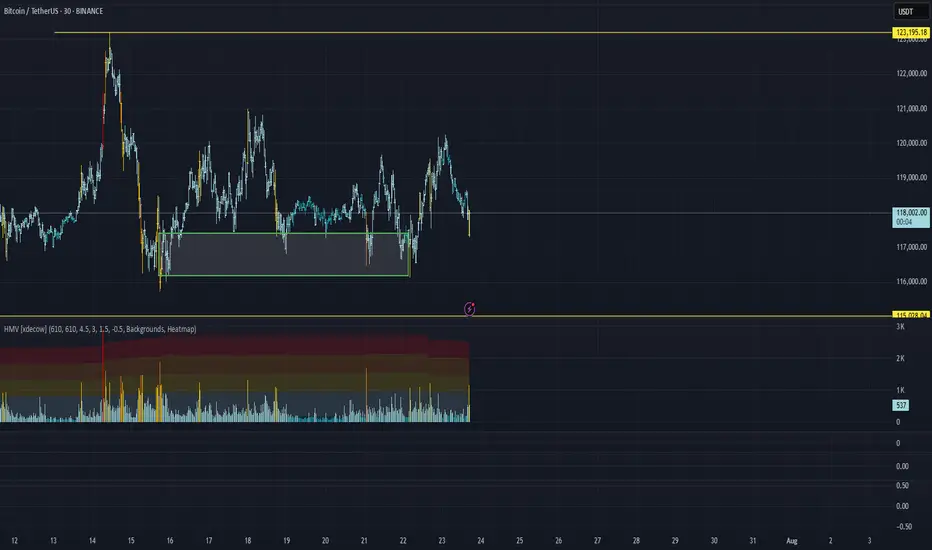
BTC/USDT Analysis. Range Breakout
Hello everyone! This is the daily analysis from a trader-analyst at CryptoRobotics.
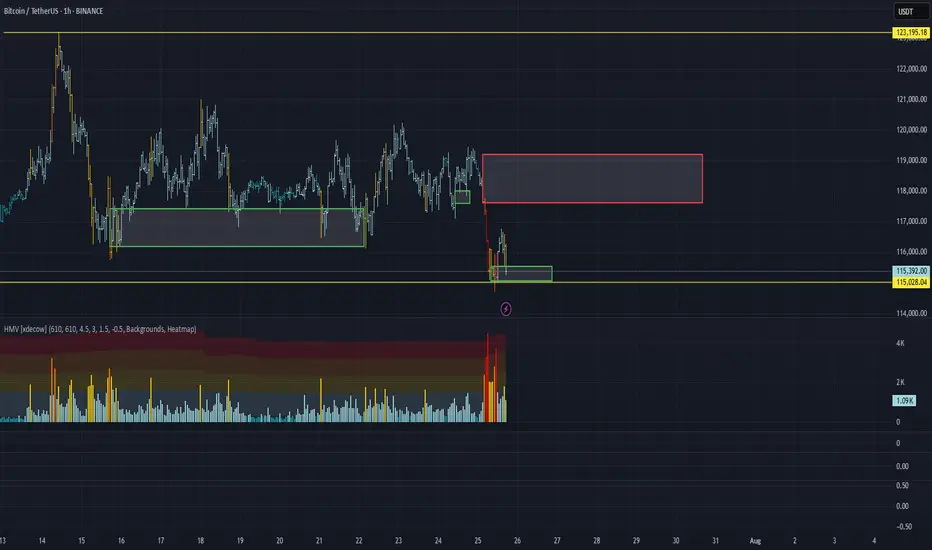
Yesterday, Bitcoin bounced off a local sell zone on the 15-minute timeframe (previously mentioned), but a full-fledged bullish move did not follow. Instead, the less likely scenario played out — we broke the range to the downside and tested an important buy zone around ~$115,000 (zone of initiating volumes). Almost immediately, anomalies appeared in the cluster search near this level, and we quickly saw an initial rebound.
At the moment, a retest of ~$115,300 is likely. If buyers show proper reaction there, we could resume an upward move toward the $117,600–$119,200 area (accumulated volumes). To continue the long scenario toward the ATH, we need to consolidate within this area or break through it without a strong seller response — which is less likely.
A short scenario becomes possible if there is no buyer reaction around ~$115,300. In that case, a decline toward the next major support zone is expected.
Buy Zone:
$110,000–$107,000 (accumulated volumes)
Sell Zone:
$117,600–$119,200 (accumulated volumes)
This publication is not financial advice.
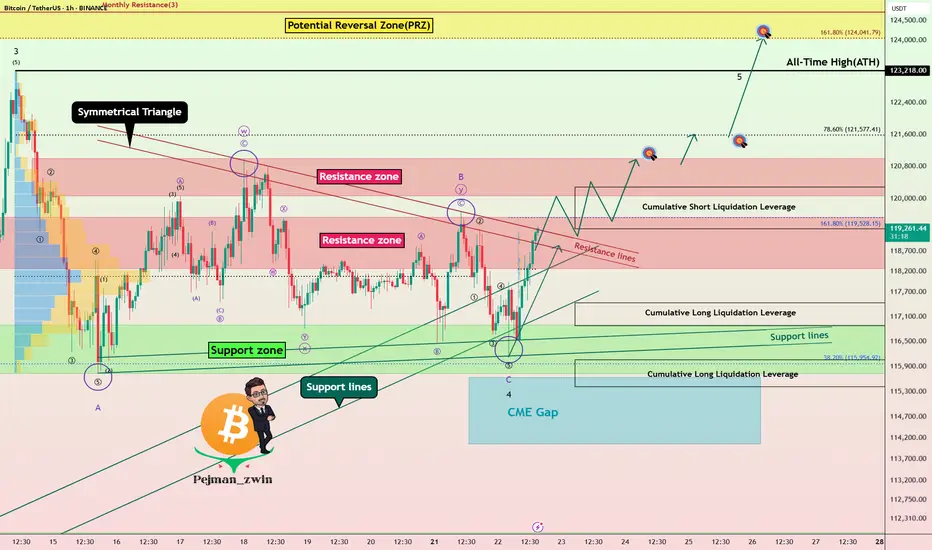
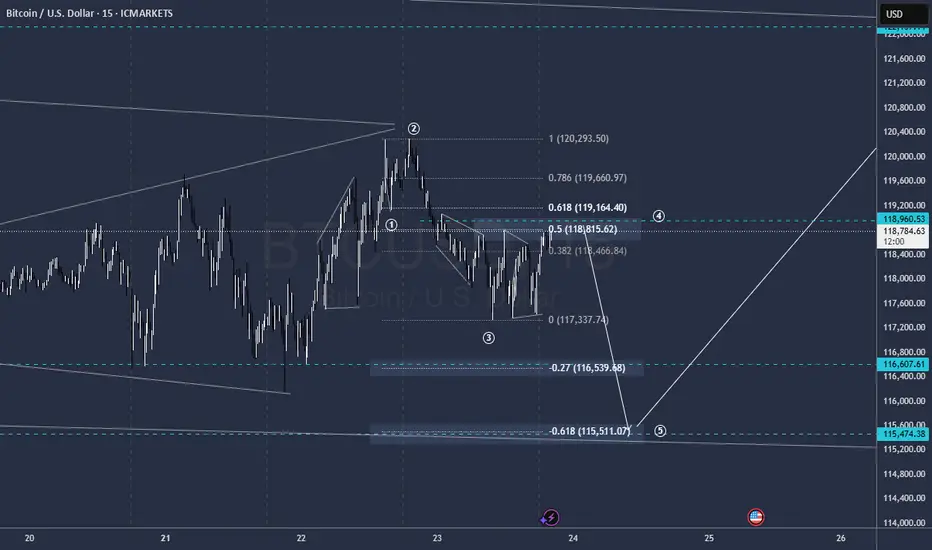
Powell’s Comments Could Decide BTC’s Fate: New ATH or Rejection!Bitcoin ( BINANCE:BTCUSDT ) has attacked the Support zone($116,900-$115,730) several times over the past week but failed to break through, meaning that buyers are still hoping for a BTC increase or even a new All-Time High(ATH) .
Bitcoin has reached a Resistance zone($119,530-$118,270) again and is trying to break the upper lines of the Symmetrical Triangle Pattern . The Cumulative Short Liquidation Leverage($117,255-$116,675) is important and includes high sell orders , so if Bitcoin can break the Resistance zone($119,530-$118,270) and the Resistance lines with high momentum , we can hope for a continuation of the upward trend.
Whether or not the Resistance zone($119,530-$118,270) and the Resistance lines break could depend on the tone of Jerome Powell’s speech today .
Jerome Powell will speak at the opening of the “ Integrated Review of the Capital Framework for Large Banks ” — the final major appearance before the Federal Reserve enters its pre-meeting blackout period.
Market Expectations:
The speech is officially about regulatory frameworks (like Basel III), but traders are watching closely for any hints regarding interest rate policy. Even indirect comments could move risk assets like BTC.
Rate Cut Signals?
With political pressure mounting (including criticism from Trump ) and markets pricing in a potential cut later this year, Powell may adopt a cautious, data-dependent tone emphasizing flexibility in decision-making.
--------------------
In terms of Elliott Wave theory , it seems that the wave structure of the main wave 4 correction is over. The main wave 4 has a Zigzag Correction(ABC/5-3-5) , so that the microwave B of the main wave 4 has a Double Three Correction(WXY) . Of course, the breakdown of the Resistance zone($119,530-$118,270) and Resistance lines can confirm the end of the main wave 4 .
Also, there is a possibility that the 5th wave will be a truncated wave because the momentum of the main wave 3 is high , and Bitcoin may NOT create a new ATH and the main wave 5 will complete below the main wave 3.
I expect Bitcoin to rise to at least the Resistance zone($121,000-$120,070) AFTER breaking the Resistance zone($119,530-$118,270) and Resistance lines .
Second Target: $121,620
Third Target: $123,820
Note: Stop Loss(SL)= $117,450
CME Gap: $115,060-$114,947
Cumulative Long Liquidation Leverage: $117,429-$116,878
Cumulative Long Liquidation Leverage: $116,053-$115,411
Please respect each other's ideas and express them politely if you agree or disagree.
Bitcoin Analyze (BTCUSDT), 1-hour time frame.
Be sure to follow the updated ideas.
Do not forget to put a Stop loss for your positions (For every position you want to open).
Please follow your strategy and updates; this is just my Idea, and I will gladly see your ideas in this post.
Please do not forget the ✅' like '✅ button 🙏😊 & Share it with your friends; thanks, and Trade safe.
Bitcoin & 150k TOPBitcoin has been trading within a rising channel for a long time, with resistance at $150,000. The middle support/resistance line also indicates $150,000, suggesting a potential significant rejection at this level.

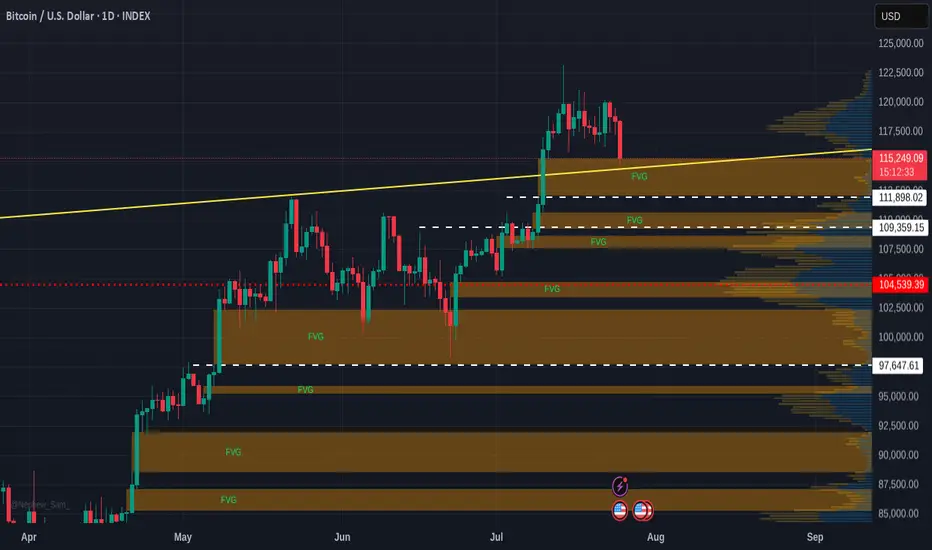
Quick BITCOIN Fair Value Gap Update -Where will dip stop
The sharp drop caused by Galaxy Digital seel off has brought PA to a line of support but also to the top of a Fair Value Gap ( FVG)
This could cause a further slide as traders decide to try and pick up some BTC from this gap.
FVG have a tendancy to be used as Good trading spots due to the lack of previous trading in that range
So, if support breaks, we could see a return to 111K as the fist gap gets filled.
We could alsp return to 109K - 107Kshuold momentum continue.
And finaly, should the move seem to attractive to some, a final Wick down to 97K is possible. This would Terrify many and would also be such a Good opportunity to buy.
I think it is unlikely though
Just my opinion but I am looking to place Buy orders between 109 - 107......just incase
Bitcoin’s Epic Run from 80K to 120K: What’s Next for BTC?Yo traders, it’s Skeptic from Skeptic Lab! 🩵 Diving into Bitcoin’s wild ride from 80K to 120K—breaking down the key supports, resistances, and what’s next for BTC.
From the $76k bounce to smashing $110K, we’re eyeing the $120K PRZ. Will it correct or keep soaring? Check the video for the full scoop! Drop your thoughts or coin requests in the comments, boost if it vibes & Let’s grow together!

BITCOIN IS CREATING A SECRET PATTERN! (Huge move incoming?!)Yello paradisers! I'm describing to you what's going on with Bitcoin right now. We are creating a secret pattern that is forming, and once its neckline is reclaimed, we are going to have a huge movement.
In this video, I'm sharing with you the most important support and resistances on multiple time frames. We are describing Elliott wave theory wave count, and taking a look at candlestick patterns. We are talking about confirmations necessary for bullish and bearish cases. I'm explaining to you what the professional trading signals need for long-term profitability.
Some of the points are great risk-reward ratios. I'm talking about that in the video. One of them is taking only the highest probability trade setups, and having the patience and discipline to wait for them.
I'm talking about proper strategy which is needed, and systemology in your overall trading and how important it is. Here on TradingView, I'm describing to you the overall bias I have on Bitcoin right now.
Don't be a gambler. Don't try to get rich quick. Make sure that your trading is professionally based on proper strategies and trade tactics.

BTC / USDT : Broke down and now going for retestBitcoin Analysis:
Bitcoin has broken down and is now retesting the support zone. As mentioned earlier, a shakeout can happen at any time, and this looks like the potential retest phase.
Bullish Scenario:
Reclaims Resistance: If BTC manages to break through the resistance after the retest, it will stabilize for the short term. This could lead to a move towards higher levels.
Bearish Scenario:
Failure to Break Resistance: If the retest fails and BTC can't reclaim the resistance, further downside could be expected.
Targets: Keep an eye on the CME gap at $114,000 and 92K as key levels to watch for potential price action.
Note:
Manage your risk carefully. The market is volatile, and a shakeout could happen anytime. If BTC fails to break resistance after retest, more pain may be ahead.

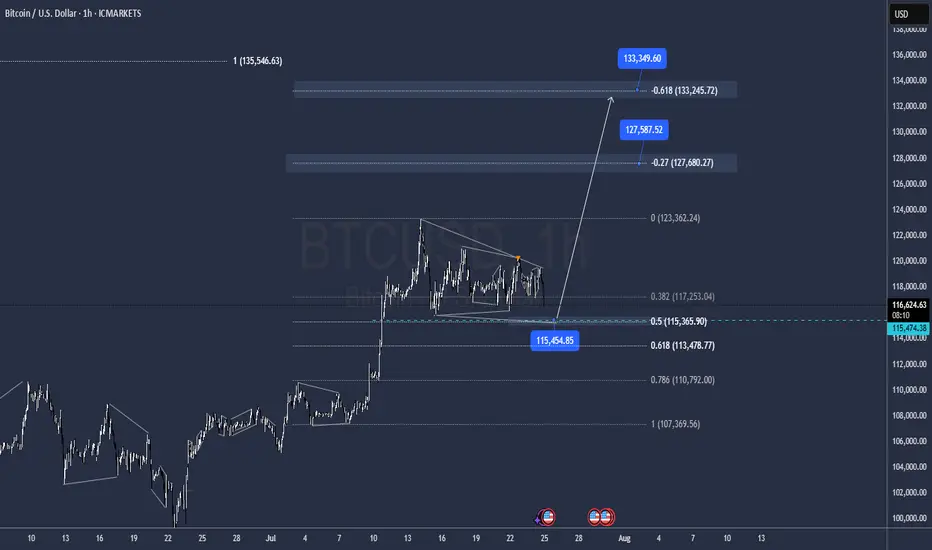
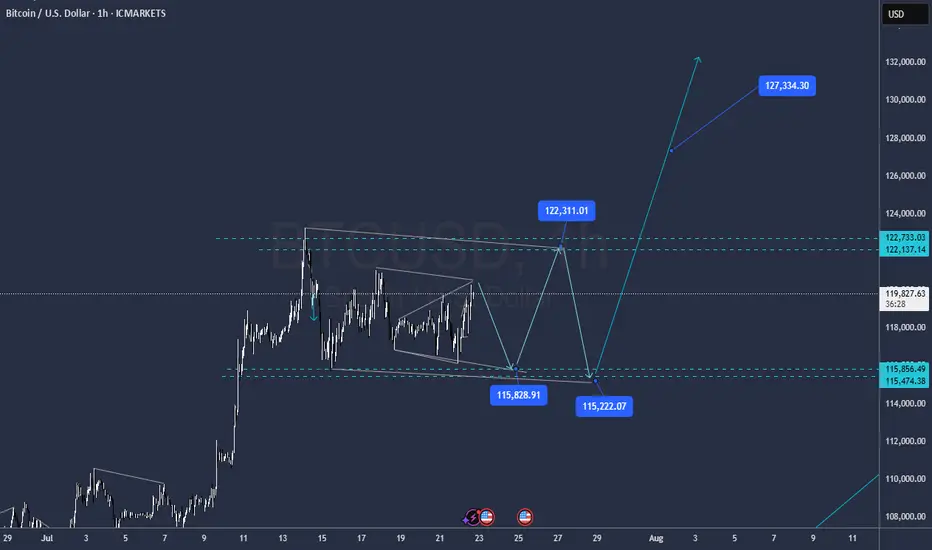
BTC Correction may be overOn a new look to the structure with the lat moves, it has the Potential to be over after tapping 115.500 and go for new Highs @ 127.500 / 133.000 as all internal impulses seeems to be matched.
BITCOIN Indicates Consolidating Moves Before StronBitcoin (BTC) Market Analysis Report
Summary and Conclusion
Bitcoin (BTC) is currently trading around $117,000 to $118,000, showing a slight pullback from its recent all-time high near $123,000. The market sentiment is moderately bullish but cautious, with technical indicators signaling some overbought conditions and short-term consolidation. Institutional interest appears to be cooling off slightly, as evidenced by recent outflows from Bitcoin ETFs, while accumulation continues across various investor tiers, including whales and retail holders.
Key resistance is near $119,400-$120,000, and support lies around $117,200-$116,900. The market is in a "perfect accumulation" phase, with strong buying support despite some profit-taking. The Fear & Greed Index is at 70, indicating greed but not extreme euphoria.
Recent news highlights a mixed picture: Bitcoin remains dominant and stable, but altcoins are gaining some momentum. Institutional flows are shifting somewhat from Bitcoin to Ethereum and other altcoins. Experts predict potential for Bitcoin to reach $200,000 to $250,000 later this year, driven by macroeconomic factors like credit expansion and fiat inflation.
Detailed Analysis
1. Price and Market Data
Market Type Last Price (USD) 24h Change 24h High 24h Low 24h Volume (USD) Funding Rate (Contract)
Spot 116,959.8 -1.65% 119,498.4 116,946.6 1.43B N/A
Contract 116,962.7 -1.65% 119,492.9 116,935.5 8.91B 0.0001
Bitcoin is consolidating below $120,000 after reaching a peak of $123,218 on July 14.
Trading volume remains robust, indicating active market participation.
2. Technical Indicators
Bullish Signals: No strong bullish technical indicators currently detected.
Bearish Signals: RSI indicates overbought conditions, suggesting short-term caution.
Support and Resistance:
Resistance: ~$119,416.6
Support: ~$117,227.4
MACD and other momentum indicators show indecisiveness, implying possible sideways movement or minor corrections before the next major move.
3. Market Sentiment
Fear & Greed Index: 70 (Greed)
Investor sentiment is bullish but tempered by profit-taking and cautious positioning.
ETF flows show a recent reversal with $68 million outflows from Bitcoin ETFs, ending a 13-day inflow streak.
Ethereum and altcoins are attracting more inflows, signaling a rotation in institutional interest.
4. Recent News Highlights
Bitcoin remains dominant but has been mostly stagnant below $120K, while altcoins struggle for momentum.
Institutional investors are shifting some capital from Bitcoin to Ethereum and other altcoins.
Bitcoin is in a "perfect accumulation" phase, with all investor tiers building positions despite some whale transfers.
Experts like Arthur Hayes predict Bitcoin could reach $250,000 by year-end, driven by credit expansion and macroeconomic factors.
Network activity shows a slight dip in active addresses, indicating a short-term pause.
Support levels around $116,952 and $114,354 are critical to watch for downside risk.
Bitcoin's dominance remains strong at around 61%.
5. Outlook
Short-term: Bitcoin may continue to consolidate between $117,000 and $120,000, with potential minor pullbacks due to overbought RSI.
Medium to Long-term: Positive macro factors and accumulation trends suggest potential for new highs, possibly targeting $150,000 to $250,000.
Watch for a breakout above $120,000 to confirm bullish momentum continuation.
Monitor ETF flows and on-chain activity for signs of renewed institutional interest or caution.
Recommendations for Traders and Investors
Traders: Consider cautious trading around current levels, watching for RSI and MACD signals for entry/exit points. Be mindful of resistance near $120,000.
Investors: Accumulation phase suggests good opportunities for long-term holding, especially if Bitcoin holds above $117,000.
Risk Management: Keep stop-loss orders near support levels to mitigate downside risk in case of a correction.

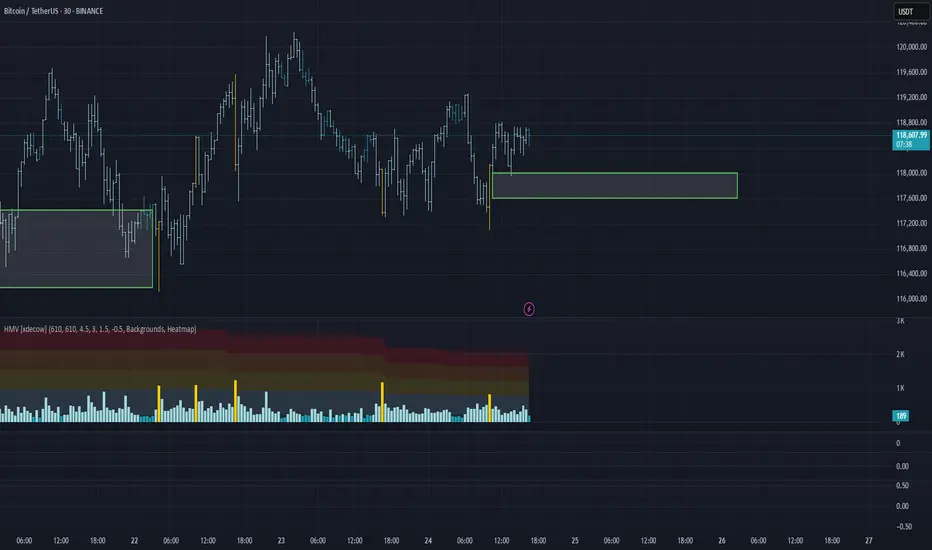
BTC/USDT Analysis. Inside the Range
Hello everyone! This is the daily analysis from a trader-analyst at CryptoRobotics.
Yesterday, Bitcoin tested the previously mentioned POC (the point of control — the area with the highest volume concentration within the range). A reaction followed: buyers prevented the price from falling below that level.
At the moment, we still expect a breakout from the range to the upside. On the lower timeframe, buyers are once again trying to gain control through delta. If the price breaks above $118,800, we can expect a move at least toward ~$120,000. A potential retest of the local zone at $118,000–$117,600 (signs of market buying aggression on the 15m timeframe) is also possible, followed by a continuation of the uptrend. Larger buy zones are marked below.
Buy zones:
~$115,000 (zone of initiating volumes)
$110,000–$107,000 (accumulated volumes)
This publication is not financial advice
BTC market update Bitcoin Market Update:
Bitcoin is currently consolidating, and the market is indecisive. It's better to watch closely for a breakout or breakdown before making any trades.
Bullish Scenario:
Breakout above resistance could lead to a strong bullish rally. Target: Next resistance level.
Pro Tip: Confirm with high volume for a valid breakout.
Bearish Scenario:
Breakdown below support could trigger strong selling. Target: Next support level.
Pro Tip: Watch for confirmation with increased selling volume to avoid fakeouts
Conclusion:
Wait for clear breakout or breakdown to trade. Avoid entering blindly.
A good time to reentry Short BTCAlways i nice to reentry in profits
entry level 119.000
targets 116.600 / 115.600
SL 119.600
Bitcoin - Trust the higher timeframe!⚔️Bitcoin ( CRYPTO:BTCUSD ) is still 100% bullish:
🔎Analysis summary:
For the past couple of months we have been seeing an overall consolidation on Bitcoin. But looking at the higher timeframe, Bitcoin remains in an underlying strong bullrun. Consolidations are always expected and no reason to freak out since everything is still bullish.
📝Levels to watch:
$100.000
🙏🏻#LONGTERMVISION
Philip - Swing Trader

BTC/USDT Analysis: Inside the Range
Hello everyone! This is a daily analysis from a trader-analyst at CryptoRobotics.
Yesterday, Bitcoin continued moving toward the upper boundary of the sideways range. Strong market buying emerged near that level, but unfortunately, it was absorbed by sellers.
At the moment, we are testing the POC (Point of Control) of the current trading range. Buyer activity is already appearing at this level. If bulls regain initiative, we can expect a move back to the upper boundary. However, if the price drops below the current level, there is a high probability of stop-loss hunting and a liquidity grab near $115,000.
Buy Zones:
~$115,000 (zone of initiating/pushing volumes)
$110,000–$107,000 (accumulated volumes)
This publication is not financial advice.
Bitcoin: Forecasting the Cycle ATHBitcoin has set a new all-time high this July, continuing the upward cycle tied to the spring 2024 halving. The decline in bitcoin dominance since early July has sparked a minor altcoin season. On this topic, I invite you to revisit my latest crypto analyses in the Swissquote market analysis archive. You can also subscribe to our account to receive alerts every time I publish a new crypto market analysis for Swissquote.
By clicking on the image below, you can read my latest perspective on Ether’s outperformance, which I now expect to last until the end of the cycle.
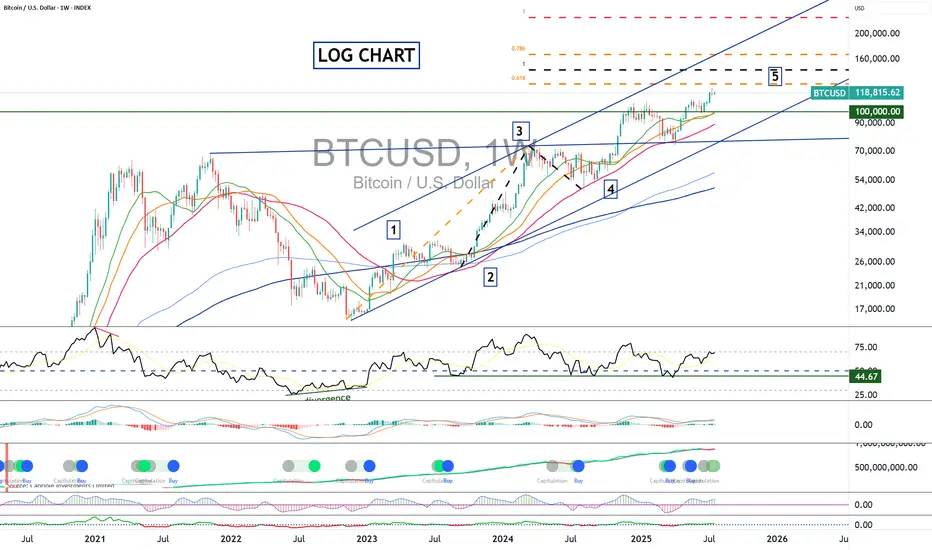
In this new article, I’ll address an important subject: the final top price for Bitcoin in this 2025 cycle. I’ll publish a separate article soon regarding timing. Today, I present three tools to combine in order to define a target zone for Bitcoin’s final cycle high by year-end.
1) Elliott Wave Technical Analysis on a Logarithmic Scale
Bitcoin is currently building wave 5 of the bullish cycle that started in autumn 2022 around $15,000. To calculate theoretical targets for wave 5, we use Fibonacci extensions, particularly projections from wave 3 and from the bottom of wave 1 to the top of wave 3. This gives a target range between $145,000 and $170,000.
2) Pi Cycle Top Prediction Tool
The Pi Cycle Top is based on the interaction of two moving averages: the 111-day MA and the 350-day MA multiplied by 2. Historically, a bullish crossover of the 111 MA above the 2×350 MA preceded the market peaks of 2013, 2017, and 2021 by a few days. This tool captures late-stage bull market speculation but can give false signals when used alone, hence the need for multiple approaches. The current 2×350-day MA stands at $175,000.
3) Terminal Price Tool
Developed by analyst Willy Woo, Terminal Price is an on-chain model based on Bitcoin’s fundamental network data. It combines the Price-to-Thermocap Ratio (market value vs cumulative mining cost) with a logarithmic metric to estimate a theoretical ceiling. Unlike the Pi Cycle Top, it does not rely on price action but on network economic activity, making it complementary. Terminal Price currently trends around $200,000.
Used together, these three approaches can help identify likely cycle top zones. The Pi Cycle Top signals excess momentum through price dynamics, while Terminal Price provides a more fundamental upper bound. Their convergence with Elliott wave analysis and Fibonacci extensions increases the probability that the final cycle top will occur by late 2025 in a range between $145,000 and $200,000.
DISCLAIMER:
This content is intended for individuals who are familiar with financial markets and instruments and is for information purposes only. The presented idea (including market commentary, market data and observations) is not a work product of any research department of Swissquote or its affiliates. This material is intended to highlight market action and does not constitute investment, legal or tax advice. If you are a retail investor or lack experience in trading complex financial products, it is advisable to seek professional advice from licensed advisor before making any financial decisions.
This content is not intended to manipulate the market or encourage any specific financial behavior.
Swissquote makes no representation or warranty as to the quality, completeness, accuracy, comprehensiveness or non-infringement of such content. The views expressed are those of the consultant and are provided for educational purposes only. Any information provided relating to a product or market should not be construed as recommending an investment strategy or transaction. Past performance is not a guarantee of future results.
Swissquote and its employees and representatives shall in no event be held liable for any damages or losses arising directly or indirectly from decisions made on the basis of this content.
The use of any third-party brands or trademarks is for information only and does not imply endorsement by Swissquote, or that the trademark owner has authorised Swissquote to promote its products or services.
Swissquote is the marketing brand for the activities of Swissquote Bank Ltd (Switzerland) regulated by FINMA, Swissquote Capital Markets Limited regulated by CySEC (Cyprus), Swissquote Bank Europe SA (Luxembourg) regulated by the CSSF, Swissquote Ltd (UK) regulated by the FCA, Swissquote Financial Services (Malta) Ltd regulated by the Malta Financial Services Authority, Swissquote MEA Ltd. (UAE) regulated by the Dubai Financial Services Authority, Swissquote Pte Ltd (Singapore) regulated by the Monetary Authority of Singapore, Swissquote Asia Limited (Hong Kong) licensed by the Hong Kong Securities and Futures Commission (SFC) and Swissquote South Africa (Pty) Ltd supervised by the FSCA.
Products and services of Swissquote are only intended for those permitted to receive them under local law.
All investments carry a degree of risk. The risk of loss in trading or holding financial instruments can be substantial. The value of financial instruments, including but not limited to stocks, bonds, cryptocurrencies, and other assets, can fluctuate both upwards and downwards. There is a significant risk of financial loss when buying, selling, holding, staking, or investing in these instruments. SQBE makes no recommendations regarding any specific investment, transaction, or the use of any particular investment strategy.
CFDs are complex instruments and come with a high risk of losing money rapidly due to leverage. The vast majority of retail client accounts suffer capital losses when trading in CFDs. You should consider whether you understand how CFDs work and whether you can afford to take the high risk of losing your money.
Digital Assets are unregulated in most countries and consumer protection rules may not apply. As highly volatile speculative investments, Digital Assets are not suitable for investors without a high-risk tolerance. Make sure you understand each Digital Asset before you trade.
Cryptocurrencies are not considered legal tender in some jurisdictions and are subject to regulatory uncertainties.
The use of Internet-based systems can involve high risks, including, but not limited to, fraud, cyber-attacks, network and communication failures, as well as identity theft and phishing attacks related to crypto-assets.
When Altseason? Clues in other chart Ex) #1Hi guys.
So Its no secret bitcoin has been ripping.
We are at new all time highs, and in full on price discovery mode.
I recently posted an ongoing macro analysis on ADA (Cardano) supporting my theory that it is one of the better alts to be investing in for alt explosion.
I want to look elsewhere to see if i can find supporting evidence that its time to invest or trade altcoins.
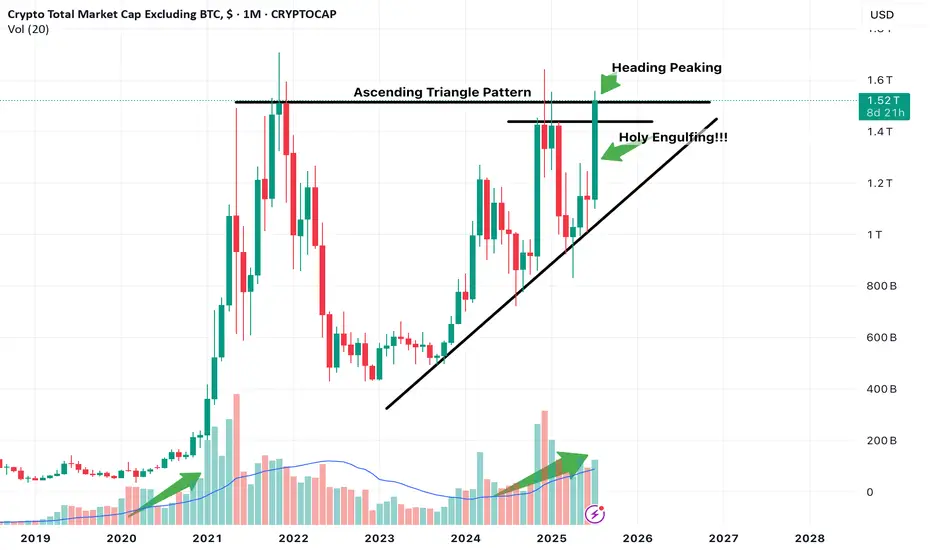
One chart that can be used is the Total Market Cap of Crypto excluding Bitcoin.
This chart showcases total altcoin market capitalization and its movements.
I believe certain Technical developments can really help us gauge at whats to come.
NOte this is on the 1 Month timeframe aka looking into Macro developments.
Just focusing on Candlestick action.
Notice we have been in this ascending channel trend, along with a potential Ascending triangle pattern development which if breakout occurs with confirmation can push Altcoin market cap higher indicating that liquidity is entering altcoins which indicates potential Uptrend.
The month of July so far is in position to print a massive engulfing Bullish candle, which is a great sign.
The upper part is also peaking its head above the Horizontal resistance line. Need to observe confirmation of this breakout. Look for it in smaller timeframes, ill look for it in the 3 day or 5 day.
We are also in position to print a higher high first time in a while.
Notice also Volume. We are seeing currently similar increasing volume as previous alt coin market cap expansion.
Keep an eye out on more posts to add to evidence that supports we are in the verge of potential altcoin season.
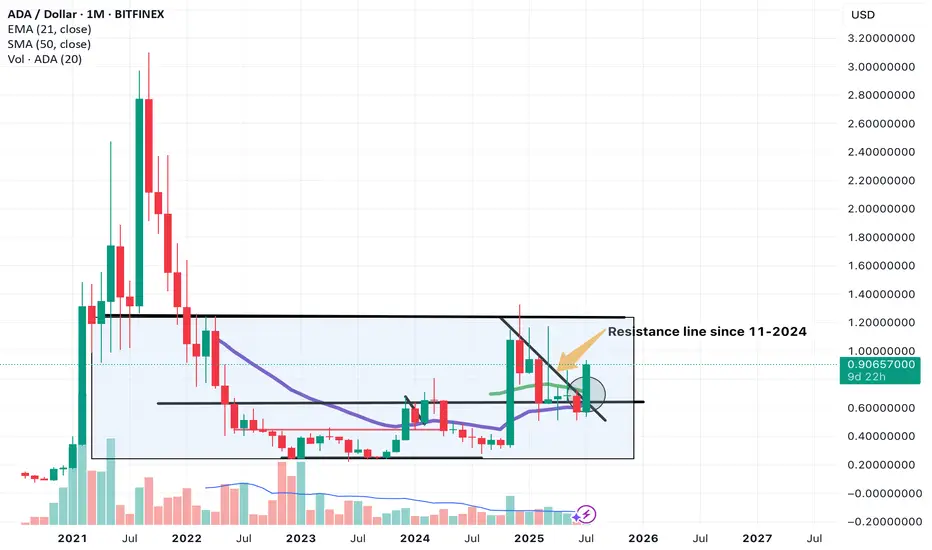
Cardano (ADA) a solid play in crypto, a Macro lookHi guys, so with Bitcoin in price discovery mode. It hints at the final phase of Crypto bull in action. With that comes altseason and in my opinion explosive growth in altcoins.
1 particular coin i've been looking at is Cardano (ADA).
This is a macro technical analysis of ADA on the 1 month timeframe. So each candle is 1 month of price action. This is very powerful on its own. And can give signs into where an asset will trend.
If you compare this to majority of other alts, its looking alot more bullish and is ahead of the game.
SO jumping right in.
Lets look at price action. Notice we are in a macro rectangle or sideways pattern.
Upper limit at $1.24
Lower limit at around $0.25.
This indicates a consolidation phase.
Real action is seen above that upper limit. Where we see explosive price action to the upside. Previously in Sept 2021 seeing highs of up to $3.07.
I believe we are making our way up to this $1.24 level.
Which in the short term will be a solid area to take profit due to it being a major supply zone in my opinion or sell zone. With a potential pull back. This is because if you look previously in price history, cardano price movement heavily involves this level with most of price history being either above or below $1.24.
A key sign but not yet confirmation is a breakout above this slanted resistance line we were being pushed down from that was created in 11-2024.
We have an engulfing candle break out currently. But still awaiting confirmation which will require august monthly candle to stay above this line and present a bullish candle print.
We will be on the look out for this.
There are other signs and signals appearing in Cardano (ADA) that support my theory and Price action developments. To take trades i always look for multiple signs that overlap.
Stay tune for more of that where ill go over many different indicators and other aspects that point to ADA being above other alts as a solid trade or investment for the next altseason.
My thoughts on Bitcoin.. ABC -> 129K Top?I think we correct down to 112K area to fill the FVG and CME then we Turn up, topping at 129K and then the rest of the Alts blow off top from there..
Thoughts?

A quick update on BYCThe correction turned a littl complex but I still seing the same structure
Levels in the chart
GG
BTC/USDT Analysis: Rotation Continues
Hello everyone! This is a daily analysis from a trader-analyst at CryptoRobotics.
Yesterday, Bitcoin continued to rotate within a narrow sideways range, and so far, there has been no breakout. We retested the lower boundary of the range and once again saw absorption of market selling at that level.
At the moment, the scenario remains valid — we expect a breakout to the upside. Several factors support this outlook: strong defense at the lows, delta absorption across the entire range, and buyer control on the most recent local upward wave.
A less likely scenario is a dip into the lower buy zone, a liquidity grab, and another attempt to move higher.
Buy Zones:
~$115,000 (zone of initiating/pushing volumes)
$110,000–$107,000 (accumulated volumes)
This publication is not financial advice.
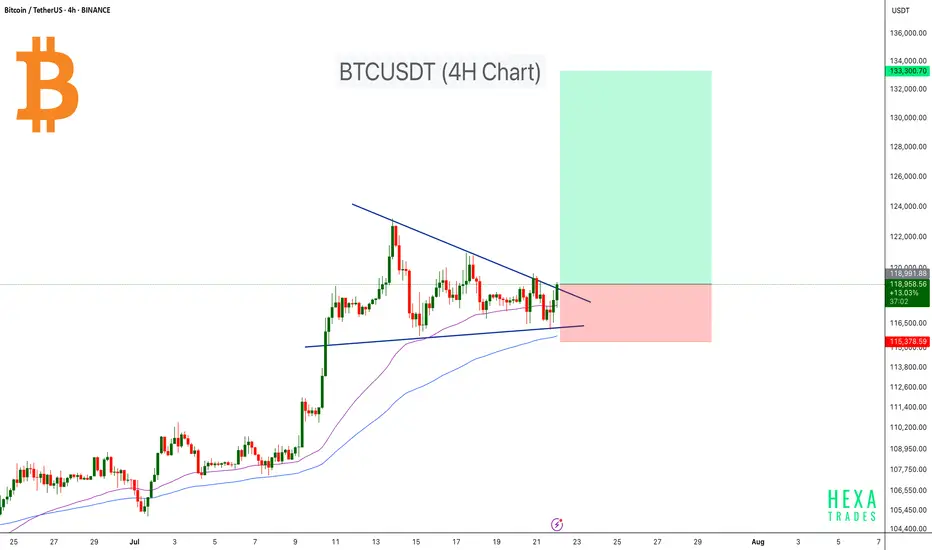
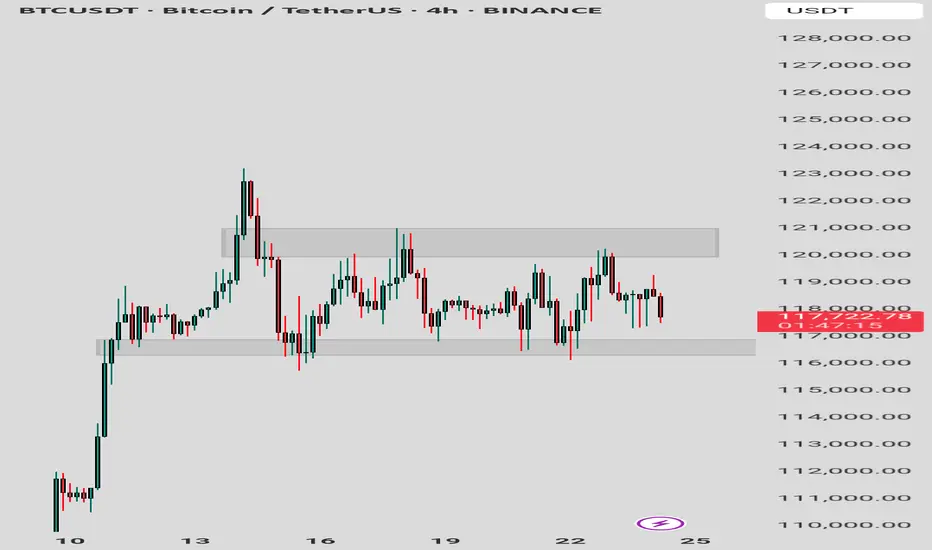
Bitcoin Ready for the Next Leg Higher!Bitcoin is currently consolidating within a symmetrical triangle on the 4-hour timeframe, showing signs of a potential breakout. After a strong rally earlier in July, BTC has entered a compression phase, forming lower highs and higher lows — a classic setup for a volatility breakout.
Price is moving near the apex of the triangle, suggesting that a decisive move is imminent. The 50 EMA and 100 EMA are both acting as dynamic support, helping bulls maintain control of the structure. A breakout above the descending trendline could initiate a sharp move toward the $130K–$133K target zone.
Cheers
Hexa
BINANCE:BTCUSDT