BTC FRACTAL : Has BTC been following THIS EXACT PATTERN?The only difference in terms of the first peak, is the duration. But even the pullback size has been similar:
Interestingly, in terms of the second peak, the increase from the corrective bottom to the new ATH is almost exact at 122%:
Here's why we MAY still have a small push upward:
- The previous time, the peak was at least 6% higher. Currently, that would put us around 116K.
- The current pennant pattern is different from the previous bearish flag.
2%:
Pattern:
Do you think the bearish cycle is starting, or is another push up likely?
___________________
BINANCE:BTCUSD
Bitcoinprice

Bitcoin-is that it for now ? Lazy summer, take off in September?
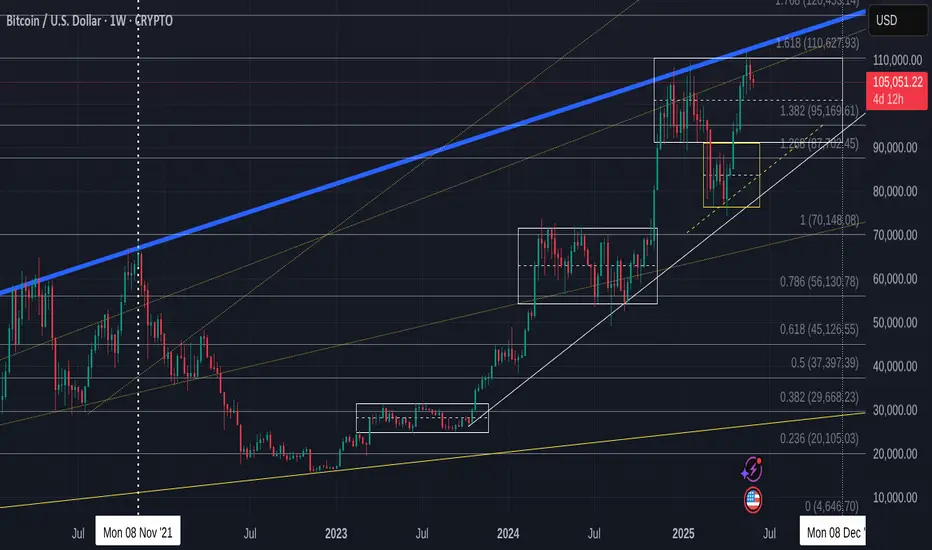
Not posted this chart for a while but we may find it has become Very relevant to what to expect for the next few months
First thing to note is that PA is once again in TOP of range box and ALSO got rejected off the Long Term Blue line that has rejected BTC PA ATH since 2017. This also coincidened with the 1.618 Fib Extension.
Rejection here was highly likely and given how PA had pushed up, it is not surprising to see PA at least taking a breath.
For me, even though we do have the ability to push higher, I am not to sure we will just yet.
The weekly MACD could offer some credence to this idea
The Arrow points to an area that could turn out to be similar to what we are doing now.
The MACD has begun curling over after a prolonged push higher. While There was strength left, PA took a breath and regrouped.
The Chart below shows this period and how BTC PA reacted...and is circled
This was in Dec 2023 to Jan 2024.
PA had just had a sustained push higher and needed a break.and following a 7 week range, PA moved up another 67%
7 weeks from now brings us to near August.
There are charts that point towards a move in August / September
Here is another chart that offers some confluence to this idea.
The Dotted line is a line of support that PA has used as support numerous times this cycle and currently, is almost bang on the 50 SMA. Assuming that PA goes back down to that and bounces again, a 67% rise takes us back up to the Top of Range
Should we drop that far, to the 50 SMA again, we are in the 92K - 95K zone, scaring a LOT of people, wrecking Leverged players and putting Fear everywhere.
PERFECT FOR BUYING
This area also happens to be the 1.382 Fib extension on the main chart, the next Major line of support below us currently.
Should we fall through that, we reach the Bottom of Range and the intersection with the 50 SMA in.......August
So, we have to wait and see. We can push higher now but to do so would require breaking through that long term Blue line of resistance. I am not sure we can do that just yet.
Also, Should we post a RED June candle, Even a small one, the ideas in the Monthly candle post I recently posted also back up the idea of a lazy summer...... and a move higher around Mid to late August
Stay safe
IBIT — Ishares Bitcoin Trust. Under Bearish PressureThe iShares Bitcoin Trust ETF (IBIT) has been a mixed performer year to date, with its price up and down around 20 percent this year and currently tracking for low double-digit returns in 2025.
The ETF currently trades around $59.36–$60.40, with assets under management of around $68 billion and a 0.1 percent premium to net asset value (NAV).
1-Hour Technical Outlook
On the 1-hour time frame, technical indicators are mixed but generally bearish:
Moving Averages: Short-term moving averages (e.g. 200-hour SMA/EMA) are currently signaling a Sell signal as the price moved below these averages in late May.
Support and resistance: The ETF faces resistance around $61, corresponding to the broken 200-hour SMA, and support around $54, with stronger volume-based support around $47, corresponding to the beginning of the April rally.
RSI indicator: Over the last 20 days, the RSI(55) indicator has already been briefly noted below the baseline of 50, highlighting the need for more active risk management, since, as we can see from the chart, the indicator has again moved into the risk zone in late May and early June (where it currently remains), accordingly, for a longer term.
Volatility: During the recovery period in April-May 2025, the ETF demonstrated moderate intraday volatility (with half the 200-hour sigma value (σ) of about 3.5 percent), while the 20-hour decline on May 22-23, which exceeded this value, has provided at that time clear arguments for more active risk management.
To summarize, we can say that NASDAQ:IBIT is experiencing a pullback, technical indicators point to local persistence of bearish sentiment, following the classic, empirically proven adage of the financial market "Sell in May - and Go away."
--
Best wishes,
@PandorraResearch Team

GBP/USD : Ready for Fall (READ THE CAPTION)By examining the GBP/USD chart on the 4-hour timeframe, we can see that the price is currently trading within the 1.35 supply zone. If a strong rejection occurs from this level, we can expect further downside movement. The potential bearish targets are 1.34915 and 1.34500. Other key supply zones are located at 1.35520, 1.35730, and 1.35930.
Please support me with your likes and comments to motivate me to share more analysis with you and share your opinion about the possible trend of this chart with me !
Best Regards , Arman Shaban

Price is coiled. Expansion is near. The setup is clean — if you BINANCE:BTCUSDT has reclaimed its 4H range low and is now driving into the midpoint of a prior leg. This isn’t random — it’s the prelude to a move Smart Money has been framing for days.
Here’s the breakdown:
Price respected the 0.618 (105,780) and rotated upward — that level is now the line between structure and noise
First objective: OB 4H at 107,839, aligning with 0.5 → 0.382 retracement
If that gets cleared with displacement, we extend into 109,621 — final premium zone before HTF liquidity is satisfied
The upper wick at 111,897 is still untouched — a long-term draw that only unlocks if we break 109k with intent
But if price fails and flips below 105,780, that signals fading momentum — and opens the door for a sweep toward the 4H OB at 104,116 or even the FVG 4H down near 101,998
Execution mindset:
Longs are valid above 105,780
Targeting: 107.8 → 109.6 → possibly 111.9
Invalidation: Daily close below 104,116
Liquidity lies above — Smart Money is already positioned
You don’t need signals when structure tells the story. You just need precision.
More entries, levels, and logic? They’re in the profile description — not in the crowd.

Price isn’t reacting — it’s delivering.BTC just tapped into the 4H FVG with surgical precision.
If you’ve been watching price the way Smart Money does, this wasn’t a surprise. It was the setup.
Here's the structure:
After reclaiming the 4H OB below, price expanded upward into the Fair Value Gap (FVG 4H)
That delivery aligns with the 0.0 fib at 106,770.4 — a premium zone engineered for liquidity harvesting
The next level above is the RB — Reversal Block — where I expect displacement to either fade or accelerate
What matters now is how price reacts on the pullback into the 0.382 → 0.618 fib range (105,338.9 to 104,454.6).
If we see structure hold, I’ll target 107,082.6 next.
If that zone fails — all eyes go back to the OB 4H at 103,023.2.
Execution clarity:
Holding above 104,454 → Long bias continues
Breaking 103,825 with follow-through? Reversal confirmed
Clean invalidation, clean targets — no guessing
The chart’s not lying. It's just speaking in algorithm.
Want trades like this before they hit the box? Check the profile description. Clarity doesn’t need noise. Just rules.

DOGEUSDT 0.2550 TPWe are seeing a price rebound from strong support around the ~0.1900 level, which may signal the end of the correction. A potential double bottom formation is forming, which often indicates a trend reversal to the upside.
Additional arguments:
The WT_LB oscillator shows an oversold zone and initial upward curvature of signal lines – a typical buy signal.
After a strong downtrend, a consolidation phase has occurred, likely acting as an accumulation zone before a potential move upward.
The risk-to-reward ratio (R/R) is very favorable (around 1:5), supporting a long entry at the current market structure.
📌Technical signals and a strong R/R ratio support a bullish scenario, with a target around 0.252 and a stop-loss set near 0.185.

BTC/USDT: Strong Bullish Alignment, All Signals Green (01/06/25)__________________________________________________________________________________
Technical Overview – Summary Points
__________________________________________________________________________________
Momentum: Bullish structure confirmed by Risk On / Risk Off Indicator (“BUY” across all timeframes).
Key Supports: 103k–104k, consolidated on every horizon (1D to 15min).
Resistances: 105.5k–108k (short-term), 110k as a main pivot.
Volume: Moderately high, with no climax or distribution signals.
Behaviour: Proprietary indicators (ISPD DIV) show strong bullish confluence across timeframes; no divergences or significant bearish signals.
__________________________________________________________________________________
Strategic Summary
__________________________________________________________________________________
Directional Bias: Dominant bullish bias across all timeframes.
Opportunities: Tactical entries on pullbacks to 103k–104k, main exits >108/110k.
Risk: Invalidation below 101k; watch for extreme volumes or major macro catalysts.
Catalysts: Strong global risk-on dynamics (tech rally, institutional flows, weak USD); monitoring SEC regulation and macro events (NFP, CPI, FED).
Plan of action: Buy defended support zones, reduce on exuberance >110k, dynamic stop below 101k, stay reactive ahead of major events.
__________________________________________________________________________________
Multi-Timeframe Analysis
__________________________________________________________________________________
1D: Major resistance at 110k (Pivot High), strong support 101–104k, Risk On / Risk Off Indicator “BUY,” healthy volume; maintained momentum.
12H: Confluent resistance 105.5–110k, support 102.5–104k, bullish indicators, no divergence or volume climax.
6H: Resistances 105.5/108k, solid support 103–104k, strict bullish confirmations.
4H: Clustered resistances 105.5/108k, dense support 103–104k, digestion phase in volume (healthy consolidation).
2H: Major pivots 105–108k, supports 103k/101.5k, strong demand on pullback.
1H: Barriers 105.5–106k, support 103.4–104.2k, no bearish signals.
30min: Spot resistance at 105.5k+, support 103.8–104.2k, microstructure favors buying, weak selling pressure.
15min: Support 104k, resistance 105.5–106k, intraday flow remains pro-buy on weakness.
Risk On / Risk Off Indicator: Consistent “BUY” signal across all timeframes — sector and behavioural momentum alignment.
ISPD DIV: Positive histogram, no red zones or distribution alerts.
Volumes: Normal to moderately high, no climax suggesting trend end.
Summary: Strong multi-timeframe technical alignment. Bullish momentum, firmly defended supports. No imminent reversal signals, healthy consolidation within dominant risk-on trend.
__________________________________________________________________________________
Strategic & Fundamental Synthesis
__________________________________________________________________________________
Technical bias: Strong bullish conviction as long as 103–104k is defended, supported by Risk On / Risk Off Indicator/ISPD.
Fundamentals: Macro momentum (Nasdaq/US tech rally, weak USD), OI and spot dominance high, growing euphoria (ATH ~111k), watch for potential distribution if buyer exuberance peaks (P/L ratio 12:1).
Scenarios: Buy on defended flows 103–104k, TP >108–110k; caution on extreme volume at support.
Macro: Anticipate reactions to major events (NFP, CPI, FED). If a key event is due within 48h: prudence, adapt post-release.
Opportunities: Potential rotation to altcoins (SOL/ETH), short-term swing as BTC momentum pauses.
Momentum prevails, but caution warranted on any volume spikes or major macro headlines. Market remains a buy at support, optimal strategy is dynamic pullback/TP management, strict discipline in case of high-volume sell-off.
__________________________________________________________________________________
Actionable Summary
__________________________________________________________________________________
Entry: Buy securely on 103–104.2k zone
Stop: Hard invalidation if <101k (on volume)
Take Profit: 108–110k+
Risk: Excessive on-chain euphoria, violent support break
Stay agile near major releases and watch flow rotations (BTC/ALT)
__________________________________________________________________________________

Liquidity was the excuse. Expansion was the goal.This BINANCE:BTCUSDT.P move was written before it happened — clean sweep, BPR fill, and now the setup is primed. You either knew where price was going, or you reacted late.
Price expanded aggressively into a clear 1H IFVG. That wasn’t just a push — it was a calculated run into a premium imbalance.
Now? We're retracing. Right into the EQ of the breaker block and the 0.5 fib (105,039). Exactly where the market wants you uncertain. I’m not.
Here’s the logic:
1H IFVG is filled. That’s done.
Price retraced directly into the 0.382 and 0.5 fib zone.
We have a defined BPR, and price is now hovering around its midpoint — ideal zone for reaccumulation.
As long as 104,999–105,039 holds, I expect a continuation back into 105,891 → 106,478.
If that range breaks clean, the low-hanging liquidity below 104,359 becomes a magnet.
But the narrative right now? HTF is still aligned bullish. We're in the phase where most traders get shaken out before the real move starts.
Trade idea: If I’m in, my invalidation is clean — under 104,699. Target is north of 106,000. I’ll scale partials at 105,799 and let the rest ride.
You want more trades like this? Check the account description. I don’t just post setups — I build conviction.
Let the influencers scream. I prefer precision.

Hello Symmetrical triangleThe appearance of this symmetrical triangle marks the end of the decline in this cycle, in which the price is stabilizing in order to continue its upward movement. 109 is the next level.


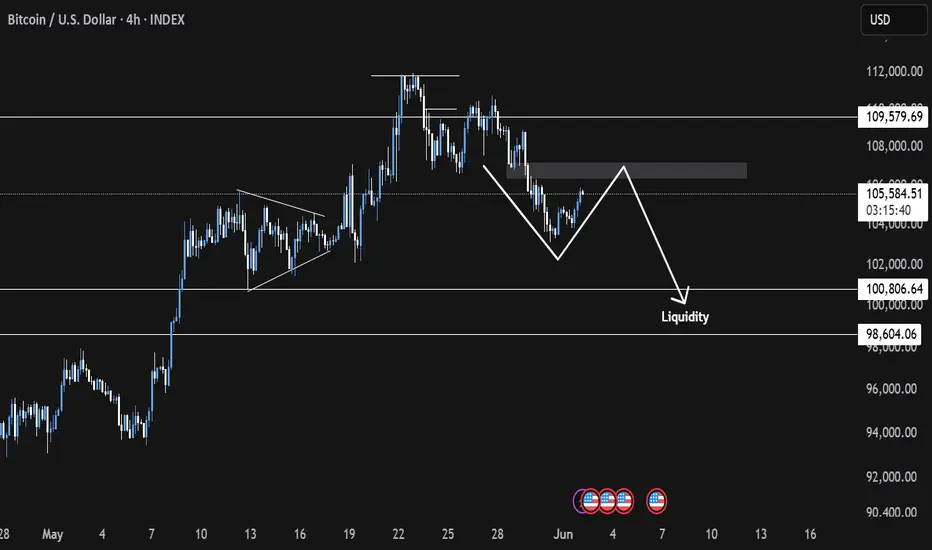
BTC Short & Trend ChangeA quick setup, i like the look of this, we've had a break of structure on the daily on 4hr in terms of the short term up trend (& 50 EMA) which is initial bias of trend change. After the break we have consolidation, a break and retest of the $105k area.
The Fib is showing a possibility the markets could draw slightly higher before falling which would make sense, especially around a level of such significance as there is likely to be manipulation and market movers here.
Short term trend change to the downside is my bias and i'll look for entry only if the markets can fake a break out up to the 61.8% ($106,750) to be exact. Good RR possibilities with good targets around 1:6.5
Target levels around $100,800 and then again around $98,500. Again, no entry unless i see confirmation from Fib levels.

Gold Sell Gold rebounded on a $100 move from 3271 to $3379. I believe this resistance zone will honor the gap downward at $3289.42 and bounce to $3,700 before the EOY.
This is not financial advice.
Good luck
-R2C

RSI suggesting BTC top prices?I have my doubts and personally believe this cycle might still extend till later this year. But according to the RSI technicals this might be the top or one of them. MACD is applied on the RSI indicator. MACD has crossed what signals a possible reversal of the bullish trend.

BTC 4H Setup – OB Rejection or Launchpad? Bitcoin is currently ranging below a 4H Order Block (OB) and forming a potential higher low. With price holding above the key 0.618 fib zone (104.1k), this could act as a springboard for continuation — or a trap.
Key Levels:
Support: 104.1k–103.6k (fib cluster & mid-volume node)
Immediate Resistance: 105.1k (OB 4H)
Breakout Target: 107.1k
Fail-safe: 103.0k
Scenarios:
🟩 Bullish Path:
Hold 104k zone
Reclaim 105.1k OB = confirmation
Push toward 107.1k & higher liquidity sweep
🟥 Bearish Path:
Rejection from OB + break below 104k
Eyes on 103.0k as next bounce zone
Plan:
Long scalp above 104.2k if volume sustains
TP1: 105.1k (retest OB)
TP2: 107.1k
SL: Below 103.6k (tight invalidation)
📌 “OB rejection or flip? Market’s next impulse hinges on this 104k–105k squeeze.”

FVG re-entry or fail – this level decides the tone.Bitcoin tapped the 0.618 fib at ~$104,100 and front-ran the 1H demand zone. Now it's hovering at a decision point just beneath the 1H Fair Value Gap.
What to watch:
→ Price is pressing into FVG (104.4k–104.7k), aiming for acceptance.
→ Value area high sits at 104,275 – acting as pivot.
→ Break + hold above 104.7k? Clean path to 105.8k.
Plan:
Entry: 104.1k–104.3k
SL: below 103.6k
TP1: 104.9k
TP2: 105.8k (liquidity sweep)
Invalidation: Rejection from 104.7k = probable retest of 103k
Narrative flip potential:
Buyers are defending the mid-range + FVG. Breakout would shift market structure bullish on the lower timeframes.
"Acceptance above the gap = momentum reclaim."

Bitcoin: What's next?BTC has lost local support around $107k and currently testing previous resistance around $104k.
If buyers are able to step in between $100k - $104k and reclaim $107k, it will signal strength.
If BTC experiences continued weakness, losing $100k as support, I would expect price to test the $95k - $97k region or 1D 200MA before signaling a reversal.

BTC didn’t dump — it tapped.BTC reached into the 1H FVG and wicked just above the OB at 104,204 — delivering premium liquidity and then reversing.
Most are staring at red candles, but the real story is the reaction zone:
Price tagged the 0.618 level (104,559) with precision and reversed with displacement.
Now what?
We're mid-delivery. If BTC can reclaim 104,800–105,000 (mid OB/FVG confluence), a strong move into 105,865 is likely — potentially sweeping for external liquidity near 106k.
Execution Plan:
Entry: 104,600–104,700 range
SL: 104,200 or beneath 103,752 swing
TP1: 105,365
TP2: 106,000+
Key invalidation: clean break below 104,200 with volume
Bias: Bullish while above 104,200
Why: Fair Value Gap fill + OB + 0.618 convergence + responsive wick
This wasn’t a sell-off.
This was a setup.

Most called rejection. I called reaccumulation — mid-trade.This wasn’t luck. It was structure.
BTC tapped directly into the 1H Fair Value Gap at 105,016 — precisely the overlap with 0.382 fib and the volume imbalance from the prior impulse. Price didn’t just react. It delivered confirmation. Fast.
Entry was clean, risk tight — and the invalidation was defined. Below 104,517, I’m out. No emotion. Just system.
I’m now watching the 105,325–105,825 pocket. That’s where the thin volume zone transitions back into resistance — and where trapped shorts begin to feel the heat.
If price breaks and holds above 105,900, expect a swift drive into 106.7–107.0 before further consolidation.
Execution clarity:
✅ Entry: FVG 1H — 105,016
🎯 TP1: 105,825
🔒 Stop: 104,517
🔓 R:R = 2.38, no drawdown, full intent
Most wait for confirmation.
I act at the point of imbalance — not after it’s obvious.

Bitcoin Monthly Candle Colour Close since 2011 - looking forward
May Closed GREEN, and We are currently on a Very small Green candle for the month open.
Last month, in this series of monthly charts posts, I mentioned this..
"On only 2 occasions have we had a GREEN JAN, RED FEB, RED MARCH, GREEN APRIL
And Both of them were on the way to ATH. ( Arrows )
On both those occasions we had a GREEN MAY, though the gains were minimal and one was followed by a Green June and the other by a Red June."
And we just closed May with a minimal GREEN candle.
This is important to understand, This month, we have a 50/50 chance of repeating the Green June candle in this pattern.
Outside of this pattern, The previous MAY closes, 7 Green to 6 Red.
Of the 7 Green, 5 were followed by a Green June
With this, we have a higher % chance of a Green June
Of All previous June Closes, we had 7 Green to 6 Red.
Of those 7 previous Green June Closes, 3 were followed by GREEN July
Of the 6 previous RED Junes, ALL were followed by GREEN July
With this in mind, we maybe in a better position if we did close June with a small RED candle, as we did in the 2020 sequence ( right hand Arrow)
Should we close June RED, I will then expect a fairly level summer period with PA beginning to start moving again around September / October
Bitcoin PA is in an excellent position to move higher now though. It is also in an excellent position to move away from previous cycle patterns and begin creating new one.
We do have to remain vigilant as markets are moving everywhere and Macro conditions could change rapidly
But the one thing that seems to remain static is that it is a VERY GOOD IDEA to Buy Bitcoin and HOLD IT

$Btc Bearish Flat Pattern Forming?Bitcoin Bearish Flat Pattern Forming? Potential Short Setup to $97K-$98K if Rejected at $106K
📉 BTC recently hit a new all-time high around $112K, followed by a series of higher lows near $110K, $108K, and potentially $106K. If price gets rejected at $106K, a bearish flat pattern may play out—triggering a high-probability short opportunity toward the $97K–$98K support zone. However, a clean breakout above $107K will invalidate this setup.

Bitcoin (BTC) Market Analysis1. Previous Analysis Validation
Our previous week's analysis played out perfectly, aligning well with the market movement.
2. Current Market Sentiment
The market remains bearish overall. However, we are seeing a short-term price pump, likely due to late short positions entering the market. This is resulting in a price move to trigger short liquidations. The recent 4H swing highs are acting as key stop-loss zones.
3. Imbalance & Rebalancing
The price is moving upward toward a daily imbalance area (highlighted in orange). We expect the market to rebalance in this zone, potentially leading to a price rejection and continuation of the downward trend.
4. Liquidity Zone
Our primary liquidity zone lies between \$100K and \$98K. We anticipate this area to be a key region for price reaction.
Unmasking the "Intrinsic Value" Debate Between Gold vs BTCFool's Gold? Unmasking the "Intrinsic Value" Debate Between Gold and Bitcoin
The assertion is a familiar one, a well-worn cudgel in the ongoing debate between traditional assets and their digital counterparts: "Gold has intrinsic value that Bitcoin doesn't." This statement often serves as the bedrock for arguments championing the yellow metal's timeless appeal while dismissing cryptocurrency as mere speculative froth. But what if this foundational claim, this appeal to gold's inherent, undeniable worth, is built on shakier ground than its proponents believe? What if the very notion of "intrinsic value" as applied to these assets is a misunderstanding, a convenient narrative rather than an objective truth?
This exploration will journey into the heart of this debate, dissecting the concept of intrinsic value and examining how it truly applies – or doesn't – to both gold and Bitcoin. We will scrutinize gold's much-vaunted industrial utility against the backdrop of its vast above-ground stocks and its overwhelming monetary premium. We will consider whether value is indeed an inherent property of an object or a subjective judgment made by individuals. Ultimately, by challenging long-held assumptions, we aim to illuminate the real sources of value for both the ancient metal and the modern digital asset, moving beyond simplistic labels to a more nuanced understanding.
1. The Elusive Nature of "Intrinsic Value"
Before we can meaningfully discuss whether gold or Bitcoin possesses intrinsic value, we must grapple with the term itself. In the realm of corporate finance, "intrinsic value" refers to the fundamental worth of a company, derived from an analysis of its assets, earnings potential, cash flows, and overall financial health. It's an attempt to ascertain what a stock should be worth, independent of its fluctuating market price. This is the world of discounted cash flow models and balance sheet scrutiny.
However, this definition struggles when applied to commodities or currencies. Gold, like Bitcoin, does not generate cash flows. It doesn't pay dividends or have earnings reports. As one observer noted, gold and Bitcoin are commodities that have a spot price; their "value" is essentially what someone is willing to pay for them at a given moment. Companies, by contrast, can have an intrinsic value tied to the future economic benefits they are expected to produce for their owners.
So, when advocates claim gold has intrinsic value, they are often pointing to something else entirely. Usually, this encompasses its tangible, physical nature – you can hold it, feel its weight. It also refers to its historical use as money and a store of value over millennia. And crucially, it implies a baseline worth derived from its utility in practical applications, particularly in industry. One might even argue, as some have, that there is simply "no such thing as intrinsic value" in an absolute sense; value is not a property embedded within an object but is assigned to it by human beings.
2. Gold's Industrial Utility: A Gilded Facade?
The argument that gold's industrial use underpins its intrinsic value is perhaps the most frequently cited. "But it's used in microchips!" is a common, almost reflexive, defense. And it's true: gold's excellent conductivity, resistance to corrosion, and malleability make it a valuable component in high-end electronics, dentistry, aerospace, and certain medical applications. But the critical question is not whether gold has industrial uses, but how much these uses contribute to its overall market price.
Consider the data for a recent year, say 2024. Global industrial gold consumption was approximately 330 tonnes. However, a staggering 90% of this demand, around 297 tonnes, was met by recycling existing gold scrap, a process that can cost as little as tens of dollars per ounce. This leaves a mere 33 tonnes of new gold required from mining to satisfy the entirety of industrial needs not covered by recycling.
Now, compare this to the annual mine production. In that same year, about 3,700 tonnes of gold were newly extracted from the earth. This means that less than 1% (33 tonnes out of 3,700 tonnes) of all newly mined gold was actually needed for industrial purposes. The vast majority, over 99%, went elsewhere – primarily into jewelry, bars, and coins, all forms of value storage.
The disparity becomes even more dramatic when we consider the total above-ground stock of gold held for these value-storage purposes. This figure stands at roughly 184,000 tonnes. If, hypothetically, gold were to suddenly lose its allure as jewelry and its status as a monetary asset, and this colossal hoard were redirected to meet industrial needs (the 33 tonnes per year not covered by recycling), we would have enough gold to last for approximately 5,600 years at current industrial consumption rates. And this is without digging a single new ounce out of the ground. Much of this 184,000-tonne supply could potentially be acquired at prices far closer to the low cost of recycling than the current market price of newly mined gold.
As one commenter aptly put it, if gold's value was solely based on industrial demand, it "would be nearly worthless" compared to its current valuation. While gold does possess certain unique properties that make it useful, these applications are a drop in the ocean when explaining its price. The idea that its utility in microchips or dental fillings provides a significant "floor" for its value is, upon closer inspection, largely a myth.
3. The Towering Monetary Premium: Where Gold's Value Truly Lies
If industrial use accounts for such a tiny fraction of gold's demand and price, what explains the rest? The answer is its "monetary premium." This is the portion of an asset's price that exceeds its direct use-value as a commodity. For gold, this premium is immense, built over centuries of human history and cultural adoption.
Gold's journey as money began thousands of years ago. Its inherent characteristics – it doesn't rust or tarnish (durability), it's relatively rare (scarcity), it's easily recognizable and has a pleasing aesthetic (acceptability), it can be melted and reformed (divisibility and fungibility), and it's dense (portability of value) – made it a superior choice for a medium of exchange and store of value in pre-industrial societies. This long history has ingrained gold into the collective human consciousness as something inherently valuable. There's a certain "magical power," as one person described it, to the shiny yellow metal, a testament to its enduring legacy.
This historical precedent and the deep-seated belief in its enduring worth are what sustain gold's monetary premium. Central banks hold it in their reserves. Individuals purchase it in the form of jewelry (which, in many cultures, serves as a primary store of family wealth) and invest in bars and coins, not primarily for its practical applications, but because they trust it will preserve purchasing power or be desired by others in the future. This shared belief, this social consensus, is the bedrock of gold's value far more than its limited industrial applications. Some estimate this monetary premium to be as high as 90% of its total price, with the remaining 10% attributable to its use in jewelry and industry.
4. The Shifting Sands of Perceived Value
The notion that value is intrinsic and immutable is challenged by history itself. Value, as many economists and observers contend, is not an inherent property of an object but is determined by human perception and utility, which can and do change over time.
Consider aluminum. There was a time when aluminum was exceedingly rare and difficult to extract, making it more precious than gold. The capstone of the Washington Monument, completed in the late 19th century, was made of aluminum to signify its value and the technological prowess of the era. Today, thanks to advancements in refining processes, aluminum is abundant and inexpensive. We use it to wrap sandwiches, a far cry from its days as a "precious" metal adorning national monuments.
Similarly, Tyrian purple dye, derived from sea snails, was once so costly and labor-intensive to produce that its use was reserved for royalty and the highest echelons of society. It symbolized power and status. The invention of synthetic dyes in the 19th century made purple accessible to everyone, and the immense value once attached to the natural version evaporated.
These examples powerfully illustrate that what society deems valuable is not fixed. It is contingent on factors like scarcity (natural or artificial), the current state of technology, cultural significance, and collective human agreement. If gold's value is predominantly a monetary premium built on historical consensus and aesthetic appeal, then it too is subject to these shifting sands of human perception. The humorous desire to one day wrap sandwiches in gold foil, should it lose its monetary status, underscores this potential for radical revaluation.
5. Bitcoin's Utility: Solving Problems of the Digital Age
If gold's claim to "intrinsic value" through industrial use is tenuous, and its primary value stems from a historically constructed monetary premium, how does Bitcoin compare? Critics often dismiss Bitcoin as having no utility beyond speculation, a digital tulip mania. However, this perspective often overlooks the specific problems Bitcoin was designed to address and the unique properties it offers in the 21st century.
Bitcoin emerged in the wake of the 2008 financial crisis as a "peer-to-peer electronic cash system," aiming to provide an alternative to the traditional financial system. Its utility lies in its ability to offer:
• Decentralization: No single entity, corporation, or government controls the Bitcoin network. It operates on a distributed ledger (the blockchain) maintained by thousands of computers worldwide. This makes it resistant to control or shutdown by any central authority.
• Permissionless Access: Anyone with an internet connection can participate in the Bitcoin network – send, receive, and store value – without needing permission from a bank or government.
• Censorship Resistance: Once transactions are confirmed and added to the blockchain, they are extremely difficult to alter or reverse. This makes it a powerful tool for individuals in environments where financial censorship is a concern.
• Provable Scarcity: The Bitcoin protocol dictates that there will only ever be a maximum of 21 million bitcoins. This hard cap on supply is a fundamental aspect of its design, making it a verifiably scarce digital asset. This contrasts with gold, where new supply is continuously mined each year, estimated by some to be around 1.5-2% of the existing above-ground stock, arguably diluting its value over time.
• Portability and Divisibility: Bitcoin is incredibly portable. Vast sums can be "carried" on a tiny device or even memorized as a seed phrase, and transferred across the globe in minutes for relatively low fees. It is also highly divisible, down to one hundred millionth of a bitcoin (a "satoshi"), facilitating transactions of various sizes.
• Verifiability: The authenticity and transaction history of every bitcoin can be publicly verified on the blockchain, eliminating the need for trust in intermediaries for this purpose.
• Durability: As a digital asset secured by a vast, decentralized network, Bitcoin is highly durable as long as the network itself remains operational and secure.
A crucial real-world utility, highlighted by observers, is Bitcoin's ability to bypass capital controls. For individuals in countries with restrictive financial regimes, Bitcoin offers a means to transact and move value across borders with a degree of freedom not possible through traditional channels. This is not a speculative feature; it is a tangible benefit solving a real problem for many.
While the number of people using Bitcoin worldwide is still relatively small compared to users of traditional financial systems, its adoption is growing. Like any transformative technology, its utility is being discovered and leveraged by an expanding user base. Its "intrinsic value," if we are to use that term, lies in its capacity to fulfill these unique functions.
6. Gold vs. Bitcoin: A Clash of Properties
When we compare gold and Bitcoin based on properties often associated with a store of value or monetary good, distinct profiles emerge:
• Tangibility: Gold is physical; you can touch it. This offers a psychological comfort that some find reassuring. Bitcoin is digital; its existence is as code and ledger entries. Its "possession" is through control of cryptographic private keys.
• Industrial Utility: Gold has limited industrial uses that account for a tiny fraction of its price. Bitcoin's "industrial utility" is the operation of its network as a global system for value transfer and verification.
• Scarcity: Gold is naturally scarce, but its total earthly and cosmic abundance is unknown, and new supply is constantly mined. Bitcoin has absolute, programmable scarcity with a fixed supply cap.
• Portability: Moving large amounts of gold is cumbersome, expensive, and risky. Bitcoin is exceptionally portable.
• Divisibility: Gold can be physically divided, but it's not a seamless process. Bitcoin is easily and precisely divisible.
• Verifiability: Authenticating gold requires specialized knowledge and tools; it can be faked. Bitcoin transactions and holdings are verifiable with mathematical certainty on its public ledger.
• Durability: Gold is physically very durable. Bitcoin, as a digital protocol, is durable as long as its decentralized network is maintained and secured.
• Historical Precedent: Gold boasts millennia of use. Bitcoin is a little over a decade old, a mere infant by comparison.
• Censorship/Seizure Resistance: Physical gold can be, and has been, confiscated. Self-custodied Bitcoin, with properly secured private keys, is highly resistant to censorship and seizure.
This comparison reveals that while gold's strengths lie in its long history and physical presence, Bitcoin excels in areas like absolute scarcity, portability, divisibility, verifiability, and censorship resistance – attributes that are arguably increasingly valuable in an increasingly digital and interconnected global landscape.
7. The "Next Person" Fallacy and the Foundation of Value
A common critique leveled at both gold (for its monetary premium) and Bitcoin is that their value depends solely on "the next person being willing to buy it." In a sense, this is true for any asset that isn't consumed directly or doesn't produce cash flows. The value of a collectible, a piece of art, or indeed a monetary good, is ultimately what someone else is prepared to exchange for it.
However, this doesn't mean their value is arbitrary or baseless. The willingness of the "next person" to buy is predicated on a shared understanding or belief in the asset's desirable properties and its potential to retain or increase its value. For gold, this belief is built on thousands of years of tradition and its perceived enduring qualities. For Bitcoin, this belief is growing based on its unique technological attributes, its potential to solve modern financial problems, and its emerging network effects. The more people who recognize and utilize these properties, the stronger the shared belief, and thus the more robust its value becomes.
8. The Cost of Production and the Illusion of a Price Floor
Some argue that gold's price cannot fall below its cost of extraction, suggesting this provides a natural price floor. While it's true that miners would cease operations if the price fell below their production costs for a sustained period, this argument largely ignores the colossal 184,000 tonnes of gold already above ground and held primarily for monetary or aesthetic purposes. If this massive hoard were to lose its monetary premium and be dumped onto the market, the price could plummet dramatically, far below current mining costs, until it reached a level where industrial demand (or perhaps a new, much lower equilibrium for aesthetic use) could absorb it. Much of this existing stock could be made available at recycling costs, which are significantly lower than mining costs. The "cost of production" floor applies primarily to newly added supply, not to the revaluation of existing, hoarded stock.
Conclusion: Beyond Intrinsic – Value in Utility and Belief
The debate over whether gold has "intrinsic value" that Bitcoin lacks often misses the mark by clinging to a nebulous and misapplied concept. If "intrinsic value" refers to a baseline worth derived from non-monetary, practical utility, then gold's claim is surprisingly weak. Its industrial applications are minimal compared to its price, which is overwhelmingly a monetary premium built on centuries of human belief, cultural acceptance, and its historical role as money.
Value, ultimately, is not an inherent property magically residing within an object. It is a subjective judgment made by individuals, a reflection of an asset's perceived utility and the collective belief in its future desirability. Gold has served humanity well as a store of value due to a set of physical properties that were optimal for pre-digital eras. Bitcoin, a product of the digital age, offers a different set of properties – provable scarcity, decentralization, censorship resistance, and unparalleled portability – that address the challenges and opportunities of our modern world.
Neither gold's sheen nor Bitcoin's bits possess a mystical "intrinsic value" independent of human perception and use. Gold's value is rooted in its long history and the enduring human affinity for its beauty and permanence. Bitcoin's burgeoning value is rooted in its innovative technology and its potential to offer a new paradigm for money and value transfer. Both are valuable because, and only because, people believe them to be. The critical difference lies in the reasons for that belief and the problems each asset is perceived to solve. As the world continues to evolve, so too will our understanding and assignment of value.
