Bitcoin: What's next?BTC has lost local support around $107k and currently testing previous resistance around $104k.
If buyers are able to step in between $100k - $104k and reclaim $107k, it will signal strength.
If BTC experiences continued weakness, losing $100k as support, I would expect price to test the $95k - $97k region or 1D 200MA before signaling a reversal.
Bitcoinprice

BTC didn’t dump — it tapped.BTC reached into the 1H FVG and wicked just above the OB at 104,204 — delivering premium liquidity and then reversing.
Most are staring at red candles, but the real story is the reaction zone:
Price tagged the 0.618 level (104,559) with precision and reversed with displacement.
Now what?
We're mid-delivery. If BTC can reclaim 104,800–105,000 (mid OB/FVG confluence), a strong move into 105,865 is likely — potentially sweeping for external liquidity near 106k.
Execution Plan:
Entry: 104,600–104,700 range
SL: 104,200 or beneath 103,752 swing
TP1: 105,365
TP2: 106,000+
Key invalidation: clean break below 104,200 with volume
Bias: Bullish while above 104,200
Why: Fair Value Gap fill + OB + 0.618 convergence + responsive wick
This wasn’t a sell-off.
This was a setup.

Most called rejection. I called reaccumulation — mid-trade.This wasn’t luck. It was structure.
BTC tapped directly into the 1H Fair Value Gap at 105,016 — precisely the overlap with 0.382 fib and the volume imbalance from the prior impulse. Price didn’t just react. It delivered confirmation. Fast.
Entry was clean, risk tight — and the invalidation was defined. Below 104,517, I’m out. No emotion. Just system.
I’m now watching the 105,325–105,825 pocket. That’s where the thin volume zone transitions back into resistance — and where trapped shorts begin to feel the heat.
If price breaks and holds above 105,900, expect a swift drive into 106.7–107.0 before further consolidation.
Execution clarity:
✅ Entry: FVG 1H — 105,016
🎯 TP1: 105,825
🔒 Stop: 104,517
🔓 R:R = 2.38, no drawdown, full intent
Most wait for confirmation.
I act at the point of imbalance — not after it’s obvious.

Bitcoin Monthly Candle Colour Close since 2011 - looking forward
May Closed GREEN, and We are currently on a Very small Green candle for the month open.
Last month, in this series of monthly charts posts, I mentioned this..
"On only 2 occasions have we had a GREEN JAN, RED FEB, RED MARCH, GREEN APRIL
And Both of them were on the way to ATH. ( Arrows )
On both those occasions we had a GREEN MAY, though the gains were minimal and one was followed by a Green June and the other by a Red June."
And we just closed May with a minimal GREEN candle.
This is important to understand, This month, we have a 50/50 chance of repeating the Green June candle in this pattern.
Outside of this pattern, The previous MAY closes, 7 Green to 6 Red.
Of the 7 Green, 5 were followed by a Green June
With this, we have a higher % chance of a Green June
Of All previous June Closes, we had 7 Green to 6 Red.
Of those 7 previous Green June Closes, 3 were followed by GREEN July
Of the 6 previous RED Junes, ALL were followed by GREEN July
With this in mind, we maybe in a better position if we did close June with a small RED candle, as we did in the 2020 sequence ( right hand Arrow)
Should we close June RED, I will then expect a fairly level summer period with PA beginning to start moving again around September / October
Bitcoin PA is in an excellent position to move higher now though. It is also in an excellent position to move away from previous cycle patterns and begin creating new one.
We do have to remain vigilant as markets are moving everywhere and Macro conditions could change rapidly
But the one thing that seems to remain static is that it is a VERY GOOD IDEA to Buy Bitcoin and HOLD IT

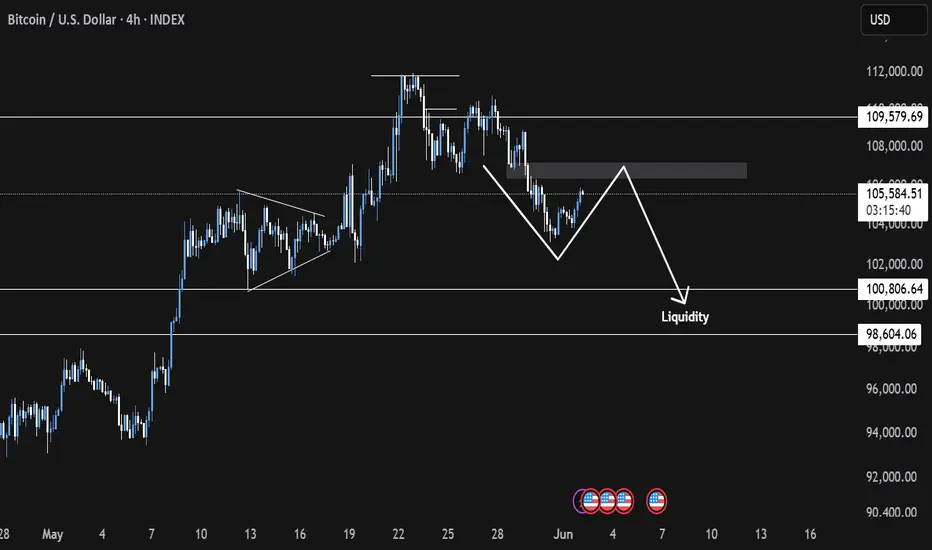
$Btc Bearish Flat Pattern Forming?Bitcoin Bearish Flat Pattern Forming? Potential Short Setup to $97K-$98K if Rejected at $106K
📉 BTC recently hit a new all-time high around $112K, followed by a series of higher lows near $110K, $108K, and potentially $106K. If price gets rejected at $106K, a bearish flat pattern may play out—triggering a high-probability short opportunity toward the $97K–$98K support zone. However, a clean breakout above $107K will invalidate this setup.

Bitcoin (BTC) Market Analysis1. Previous Analysis Validation
Our previous week's analysis played out perfectly, aligning well with the market movement.
2. Current Market Sentiment
The market remains bearish overall. However, we are seeing a short-term price pump, likely due to late short positions entering the market. This is resulting in a price move to trigger short liquidations. The recent 4H swing highs are acting as key stop-loss zones.
3. Imbalance & Rebalancing
The price is moving upward toward a daily imbalance area (highlighted in orange). We expect the market to rebalance in this zone, potentially leading to a price rejection and continuation of the downward trend.
4. Liquidity Zone
Our primary liquidity zone lies between \$100K and \$98K. We anticipate this area to be a key region for price reaction.
Unmasking the "Intrinsic Value" Debate Between Gold vs BTCFool's Gold? Unmasking the "Intrinsic Value" Debate Between Gold and Bitcoin
The assertion is a familiar one, a well-worn cudgel in the ongoing debate between traditional assets and their digital counterparts: "Gold has intrinsic value that Bitcoin doesn't." This statement often serves as the bedrock for arguments championing the yellow metal's timeless appeal while dismissing cryptocurrency as mere speculative froth. But what if this foundational claim, this appeal to gold's inherent, undeniable worth, is built on shakier ground than its proponents believe? What if the very notion of "intrinsic value" as applied to these assets is a misunderstanding, a convenient narrative rather than an objective truth?
This exploration will journey into the heart of this debate, dissecting the concept of intrinsic value and examining how it truly applies – or doesn't – to both gold and Bitcoin. We will scrutinize gold's much-vaunted industrial utility against the backdrop of its vast above-ground stocks and its overwhelming monetary premium. We will consider whether value is indeed an inherent property of an object or a subjective judgment made by individuals. Ultimately, by challenging long-held assumptions, we aim to illuminate the real sources of value for both the ancient metal and the modern digital asset, moving beyond simplistic labels to a more nuanced understanding.
1. The Elusive Nature of "Intrinsic Value"
Before we can meaningfully discuss whether gold or Bitcoin possesses intrinsic value, we must grapple with the term itself. In the realm of corporate finance, "intrinsic value" refers to the fundamental worth of a company, derived from an analysis of its assets, earnings potential, cash flows, and overall financial health. It's an attempt to ascertain what a stock should be worth, independent of its fluctuating market price. This is the world of discounted cash flow models and balance sheet scrutiny.
However, this definition struggles when applied to commodities or currencies. Gold, like Bitcoin, does not generate cash flows. It doesn't pay dividends or have earnings reports. As one observer noted, gold and Bitcoin are commodities that have a spot price; their "value" is essentially what someone is willing to pay for them at a given moment. Companies, by contrast, can have an intrinsic value tied to the future economic benefits they are expected to produce for their owners.
So, when advocates claim gold has intrinsic value, they are often pointing to something else entirely. Usually, this encompasses its tangible, physical nature – you can hold it, feel its weight. It also refers to its historical use as money and a store of value over millennia. And crucially, it implies a baseline worth derived from its utility in practical applications, particularly in industry. One might even argue, as some have, that there is simply "no such thing as intrinsic value" in an absolute sense; value is not a property embedded within an object but is assigned to it by human beings.
2. Gold's Industrial Utility: A Gilded Facade?
The argument that gold's industrial use underpins its intrinsic value is perhaps the most frequently cited. "But it's used in microchips!" is a common, almost reflexive, defense. And it's true: gold's excellent conductivity, resistance to corrosion, and malleability make it a valuable component in high-end electronics, dentistry, aerospace, and certain medical applications. But the critical question is not whether gold has industrial uses, but how much these uses contribute to its overall market price.
Consider the data for a recent year, say 2024. Global industrial gold consumption was approximately 330 tonnes. However, a staggering 90% of this demand, around 297 tonnes, was met by recycling existing gold scrap, a process that can cost as little as tens of dollars per ounce. This leaves a mere 33 tonnes of new gold required from mining to satisfy the entirety of industrial needs not covered by recycling.
Now, compare this to the annual mine production. In that same year, about 3,700 tonnes of gold were newly extracted from the earth. This means that less than 1% (33 tonnes out of 3,700 tonnes) of all newly mined gold was actually needed for industrial purposes. The vast majority, over 99%, went elsewhere – primarily into jewelry, bars, and coins, all forms of value storage.
The disparity becomes even more dramatic when we consider the total above-ground stock of gold held for these value-storage purposes. This figure stands at roughly 184,000 tonnes. If, hypothetically, gold were to suddenly lose its allure as jewelry and its status as a monetary asset, and this colossal hoard were redirected to meet industrial needs (the 33 tonnes per year not covered by recycling), we would have enough gold to last for approximately 5,600 years at current industrial consumption rates. And this is without digging a single new ounce out of the ground. Much of this 184,000-tonne supply could potentially be acquired at prices far closer to the low cost of recycling than the current market price of newly mined gold.
As one commenter aptly put it, if gold's value was solely based on industrial demand, it "would be nearly worthless" compared to its current valuation. While gold does possess certain unique properties that make it useful, these applications are a drop in the ocean when explaining its price. The idea that its utility in microchips or dental fillings provides a significant "floor" for its value is, upon closer inspection, largely a myth.
3. The Towering Monetary Premium: Where Gold's Value Truly Lies
If industrial use accounts for such a tiny fraction of gold's demand and price, what explains the rest? The answer is its "monetary premium." This is the portion of an asset's price that exceeds its direct use-value as a commodity. For gold, this premium is immense, built over centuries of human history and cultural adoption.
Gold's journey as money began thousands of years ago. Its inherent characteristics – it doesn't rust or tarnish (durability), it's relatively rare (scarcity), it's easily recognizable and has a pleasing aesthetic (acceptability), it can be melted and reformed (divisibility and fungibility), and it's dense (portability of value) – made it a superior choice for a medium of exchange and store of value in pre-industrial societies. This long history has ingrained gold into the collective human consciousness as something inherently valuable. There's a certain "magical power," as one person described it, to the shiny yellow metal, a testament to its enduring legacy.
This historical precedent and the deep-seated belief in its enduring worth are what sustain gold's monetary premium. Central banks hold it in their reserves. Individuals purchase it in the form of jewelry (which, in many cultures, serves as a primary store of family wealth) and invest in bars and coins, not primarily for its practical applications, but because they trust it will preserve purchasing power or be desired by others in the future. This shared belief, this social consensus, is the bedrock of gold's value far more than its limited industrial applications. Some estimate this monetary premium to be as high as 90% of its total price, with the remaining 10% attributable to its use in jewelry and industry.
4. The Shifting Sands of Perceived Value
The notion that value is intrinsic and immutable is challenged by history itself. Value, as many economists and observers contend, is not an inherent property of an object but is determined by human perception and utility, which can and do change over time.
Consider aluminum. There was a time when aluminum was exceedingly rare and difficult to extract, making it more precious than gold. The capstone of the Washington Monument, completed in the late 19th century, was made of aluminum to signify its value and the technological prowess of the era. Today, thanks to advancements in refining processes, aluminum is abundant and inexpensive. We use it to wrap sandwiches, a far cry from its days as a "precious" metal adorning national monuments.
Similarly, Tyrian purple dye, derived from sea snails, was once so costly and labor-intensive to produce that its use was reserved for royalty and the highest echelons of society. It symbolized power and status. The invention of synthetic dyes in the 19th century made purple accessible to everyone, and the immense value once attached to the natural version evaporated.
These examples powerfully illustrate that what society deems valuable is not fixed. It is contingent on factors like scarcity (natural or artificial), the current state of technology, cultural significance, and collective human agreement. If gold's value is predominantly a monetary premium built on historical consensus and aesthetic appeal, then it too is subject to these shifting sands of human perception. The humorous desire to one day wrap sandwiches in gold foil, should it lose its monetary status, underscores this potential for radical revaluation.
5. Bitcoin's Utility: Solving Problems of the Digital Age
If gold's claim to "intrinsic value" through industrial use is tenuous, and its primary value stems from a historically constructed monetary premium, how does Bitcoin compare? Critics often dismiss Bitcoin as having no utility beyond speculation, a digital tulip mania. However, this perspective often overlooks the specific problems Bitcoin was designed to address and the unique properties it offers in the 21st century.
Bitcoin emerged in the wake of the 2008 financial crisis as a "peer-to-peer electronic cash system," aiming to provide an alternative to the traditional financial system. Its utility lies in its ability to offer:
• Decentralization: No single entity, corporation, or government controls the Bitcoin network. It operates on a distributed ledger (the blockchain) maintained by thousands of computers worldwide. This makes it resistant to control or shutdown by any central authority.
• Permissionless Access: Anyone with an internet connection can participate in the Bitcoin network – send, receive, and store value – without needing permission from a bank or government.
• Censorship Resistance: Once transactions are confirmed and added to the blockchain, they are extremely difficult to alter or reverse. This makes it a powerful tool for individuals in environments where financial censorship is a concern.
• Provable Scarcity: The Bitcoin protocol dictates that there will only ever be a maximum of 21 million bitcoins. This hard cap on supply is a fundamental aspect of its design, making it a verifiably scarce digital asset. This contrasts with gold, where new supply is continuously mined each year, estimated by some to be around 1.5-2% of the existing above-ground stock, arguably diluting its value over time.
• Portability and Divisibility: Bitcoin is incredibly portable. Vast sums can be "carried" on a tiny device or even memorized as a seed phrase, and transferred across the globe in minutes for relatively low fees. It is also highly divisible, down to one hundred millionth of a bitcoin (a "satoshi"), facilitating transactions of various sizes.
• Verifiability: The authenticity and transaction history of every bitcoin can be publicly verified on the blockchain, eliminating the need for trust in intermediaries for this purpose.
• Durability: As a digital asset secured by a vast, decentralized network, Bitcoin is highly durable as long as the network itself remains operational and secure.
A crucial real-world utility, highlighted by observers, is Bitcoin's ability to bypass capital controls. For individuals in countries with restrictive financial regimes, Bitcoin offers a means to transact and move value across borders with a degree of freedom not possible through traditional channels. This is not a speculative feature; it is a tangible benefit solving a real problem for many.
While the number of people using Bitcoin worldwide is still relatively small compared to users of traditional financial systems, its adoption is growing. Like any transformative technology, its utility is being discovered and leveraged by an expanding user base. Its "intrinsic value," if we are to use that term, lies in its capacity to fulfill these unique functions.
6. Gold vs. Bitcoin: A Clash of Properties
When we compare gold and Bitcoin based on properties often associated with a store of value or monetary good, distinct profiles emerge:
• Tangibility: Gold is physical; you can touch it. This offers a psychological comfort that some find reassuring. Bitcoin is digital; its existence is as code and ledger entries. Its "possession" is through control of cryptographic private keys.
• Industrial Utility: Gold has limited industrial uses that account for a tiny fraction of its price. Bitcoin's "industrial utility" is the operation of its network as a global system for value transfer and verification.
• Scarcity: Gold is naturally scarce, but its total earthly and cosmic abundance is unknown, and new supply is constantly mined. Bitcoin has absolute, programmable scarcity with a fixed supply cap.
• Portability: Moving large amounts of gold is cumbersome, expensive, and risky. Bitcoin is exceptionally portable.
• Divisibility: Gold can be physically divided, but it's not a seamless process. Bitcoin is easily and precisely divisible.
• Verifiability: Authenticating gold requires specialized knowledge and tools; it can be faked. Bitcoin transactions and holdings are verifiable with mathematical certainty on its public ledger.
• Durability: Gold is physically very durable. Bitcoin, as a digital protocol, is durable as long as its decentralized network is maintained and secured.
• Historical Precedent: Gold boasts millennia of use. Bitcoin is a little over a decade old, a mere infant by comparison.
• Censorship/Seizure Resistance: Physical gold can be, and has been, confiscated. Self-custodied Bitcoin, with properly secured private keys, is highly resistant to censorship and seizure.
This comparison reveals that while gold's strengths lie in its long history and physical presence, Bitcoin excels in areas like absolute scarcity, portability, divisibility, verifiability, and censorship resistance – attributes that are arguably increasingly valuable in an increasingly digital and interconnected global landscape.
7. The "Next Person" Fallacy and the Foundation of Value
A common critique leveled at both gold (for its monetary premium) and Bitcoin is that their value depends solely on "the next person being willing to buy it." In a sense, this is true for any asset that isn't consumed directly or doesn't produce cash flows. The value of a collectible, a piece of art, or indeed a monetary good, is ultimately what someone else is prepared to exchange for it.
However, this doesn't mean their value is arbitrary or baseless. The willingness of the "next person" to buy is predicated on a shared understanding or belief in the asset's desirable properties and its potential to retain or increase its value. For gold, this belief is built on thousands of years of tradition and its perceived enduring qualities. For Bitcoin, this belief is growing based on its unique technological attributes, its potential to solve modern financial problems, and its emerging network effects. The more people who recognize and utilize these properties, the stronger the shared belief, and thus the more robust its value becomes.
8. The Cost of Production and the Illusion of a Price Floor
Some argue that gold's price cannot fall below its cost of extraction, suggesting this provides a natural price floor. While it's true that miners would cease operations if the price fell below their production costs for a sustained period, this argument largely ignores the colossal 184,000 tonnes of gold already above ground and held primarily for monetary or aesthetic purposes. If this massive hoard were to lose its monetary premium and be dumped onto the market, the price could plummet dramatically, far below current mining costs, until it reached a level where industrial demand (or perhaps a new, much lower equilibrium for aesthetic use) could absorb it. Much of this existing stock could be made available at recycling costs, which are significantly lower than mining costs. The "cost of production" floor applies primarily to newly added supply, not to the revaluation of existing, hoarded stock.
Conclusion: Beyond Intrinsic – Value in Utility and Belief
The debate over whether gold has "intrinsic value" that Bitcoin lacks often misses the mark by clinging to a nebulous and misapplied concept. If "intrinsic value" refers to a baseline worth derived from non-monetary, practical utility, then gold's claim is surprisingly weak. Its industrial applications are minimal compared to its price, which is overwhelmingly a monetary premium built on centuries of human belief, cultural acceptance, and its historical role as money.
Value, ultimately, is not an inherent property magically residing within an object. It is a subjective judgment made by individuals, a reflection of an asset's perceived utility and the collective belief in its future desirability. Gold has served humanity well as a store of value due to a set of physical properties that were optimal for pre-digital eras. Bitcoin, a product of the digital age, offers a different set of properties – provable scarcity, decentralization, censorship resistance, and unparalleled portability – that address the challenges and opportunities of our modern world.
Neither gold's sheen nor Bitcoin's bits possess a mystical "intrinsic value" independent of human perception and use. Gold's value is rooted in its long history and the enduring human affinity for its beauty and permanence. Bitcoin's burgeoning value is rooted in its innovative technology and its potential to offer a new paradigm for money and value transfer. Both are valuable because, and only because, people believe them to be. The critical difference lies in the reasons for that belief and the problems each asset is perceived to solve. As the world continues to evolve, so too will our understanding and assignment of value.

Daily BTC/USD Analysis - Smart Money PerspectivePrice recently swept liquidity above the previous weekly high, indicating a classic liquidity grab. After this move, we observed a market structure shift (MSS) to the downside, followed by a break and a mitigation of a bearish imbalance (BAG).
Currently, price is reacting from a small fair value gap (FVG), but this is likely just a retracement. I'm expecting the market to drop further and target the larger FVG zone that aligns on both the weekly and daily timeframes (highlighted in blue). This zone also aligns with a potential POI (point of interest) for smart money accumulation.
📌 Short-term bias: Bearish
🎯 Target: 99,000–97,000 zone
🔍 Watch for rejection at current FVG or possible internal liquidity grab before the drop.
Smart money is likely to seek deeper liquidity before any meaningful bullish continuation. Stay patient and let price come to the premium zone.

BTCUSDT Hello traders, wishing everyone a great weekend!
I’ve identified a sell opportunity on BTCUSDT and decided to share it with you as well.
🔍 Trade Details:
✔️ Timeframe: 15-Minute
✔️ Risk-to-Reward Ratio: 1:2 / 1:4
✔️ Trade Direction: Sell
✔️ Entry Price: 103,826.28
✔️ Take Profit: 103,428.15
✔️ Stop Loss: 104,025.48
🔔 Disclaimer: This is not financial advice. I’m simply sharing a trade I’ve taken based on my personal trading system, strictly for educational and illustrative purposes.
📌 Interested in a systematic, data-driven trading approach?
💡 Follow the page and turn on notifications to stay informed about upcoming trade ideas and advanced market insights.

No breakout. Just engineered liquidity. Watch how I step in.This setup didn’t need noise. Just clarity.
We took sell-side liquidity below the FVG FF with precision, tapping into a 4H OB nested at a deeper 78.6% retracement. That’s where the mispricing ends. That’s where I step in.
Price didn’t reverse because of “oversold.” It reversed because Smart Money engineered the imbalance, swept stops, and delivered into a value zone. Nothing more. Nothing less.
The rejection from that 102,067 level formed the base. From there, I expect delivery up into the 104,953 handle — where the 0.618 confluence and the upper OB sit. That’s the decision point.
Above that, we’ve got unfinished business at 107,614. If price pierces through 106,955 — where the 0.5 lines up with a previous supply — expect the full expansion into the 109,500s.
But I’m not rushing it. Liquidity above that OB at 108,122 has weight — and may serve as distribution before another push lower.
What I’m watching:
✅ Buy-side liquidity resting above 104,953
✅ OB rejection zone at 108,122
❌ 102,067 invalidation if price closes with displacement through the low
🔻 If that fails — price wants the inefficiency down near 102,051
I’m not here to catch every move.
I’m here to catch the right one.
I don’t need confirmation. I am the confirmation.

BTC/USD – Double Top Breakdown Signals Bearish Wave- 4H chart. 🧨
🔍 Chart Analysis:
🟢 Recent Price Action:
Bitcoin formed a double top pattern near the Recent All-Time High (ATH) 📈 — a strong bearish signal 🔔.
A trendline break occurred right after the second peak, confirming potential weakness ⚠️.
🟠 Supply Zone:
Price re-entered a previous supply zone (resistance area) and failed to hold above it 🧱 — indicating sellers are active again.
🔵 EMA 70 (Blue Line):
The price has dropped below the 70 EMA, signaling momentum shift from bullish to bearish 📉.
🔴 STOP LOSS ZONE:
Positioned above 110,555 🚫 — risk level for this short setup if bulls reclaim control.
🟡 Bearish Pathway (Expected Move):
Price may retest the broken zone 🔁.
Followed by a sharp drop to the 1st support near $101,503 🎯.
Confirmed by large bearish volume spikes 📊.
💥 Trade Idea:
Entry: Near 106,000 (on retest of supply zone).
Stop Loss: Above 110,555 🔺.
Target: $101,500 🎯.
Risk/Reward Ratio: 🔥 Favorable setup for swing short sellers!
📛 Pattern Breakdown:
⚠️ Double Top = Reversal Signal.
🔻 Trendline Break = Shift in Market Structure.
🧊 Supply Zone Rejection = Bearish Confirmation.

Bitcoin(BTC/USD) Daily Chart Analysis For Week of May 30, 2025Technical Analysis and Outlook:
Bitcoin has undergone a significant decline during the current week's trading session and is presently situated at the Mean Support level of $103,000. This downward trajectory has the potential to establish a temporary pause, which may facilitate the emergence of upward momentum from this level, and it could pose a challenge to the Key Resistance level at 109500. A successful breach of this resistance may lead to the completion of the Inner Coin Rally target at $114500. However, it is crucial to acknowledge the possibility of renewed downward momentum from the current level, as this could result in a decline toward the Mean Support of 99000.

Bitcoin Cash Respects Trendline Again – Is Another Rally LoadingBitcoin Cash is showing strong trendline respect, with multiple successful bounces from the ascending support.
Price is once again bouncing off this trendline, signaling bullish intent. As long as this structure holds, the uptrend remains intact and a potential move toward higher levels looks likely.
Key support and trendline confluence continues to act as a launchpad.

Bitcoin Is Entering Into Very Difficult TimesHello, Skyrexians!
I have been thinking what will happen next with BINANCE:BTCUSDT and it was obvious that correction has been started, you can easily find my recent update on Bitcoin and check it, but what will happen after. Today I decided that the first impulse has not been finessed yet and we need one more small leg up to complete this growth before significant correction.
Let's take a look at the yellow Elliott waves cycle. Awesome Oscillator gave me an idea that only wave 3 has been finished above $110k. Now price is printing wave 4. Wave 4 has a target between 0.38 and 0.5 Fibonacci, but this time it will be definitely 0.38 at $101k. Here was the smaller degree wave's 4 bottom. Wave 5 will be shortened because wave 3 was extended, it's very logically. After $111k retest the major wave 2 will go to $90k approximately. Difficult times ahead for crypto, I think this period will be finished only at the end of June.
Best regards,
Ivan Skyrexio
___________________________________________________________
Please, boost this article and subscribe our page if you like analysis!

King BTC - Bitcoin Dominance Continues to Go Up OnlyIf market cycles still matter, this current one will be remembered as a disappointment by many crypto traders. With Bitcoin Dominance up-only, this has been the cycle of institutional traders who accumulate Bitcoin. For years, crypto traders hoped that institutions would 'buy our bags'. But for now, only 'King BTC' has benefitted. From its low point at less than 40%, Bitcoin market cap dominance versus the rest of the crypto markets is now sitting at 65%. The times when crypto traders would 'hunt gems' and hold Altcoins that would go up 10-100x are over. Between the 'crypto trenches' of memecoin traders hunting very low cap memes that can go up multiples and then go back to 0 even quicker and 'King BTC', not much of the rest of the market has caught a bid.
The picture is completely different on the institutional side. For many funds, Bitcoin is now part of a core treasury strategy. Pensions and endowments dip in through ETF exposure. Especially in the US, the regulatory and legal outlook are improving rapidly under a pro-crypto US administration. Asset managers like BlackRock are promoting BTC as a long-term store of value with lower correlation to equities than previously assumed.
In fact, institutional Bitcoin FOMO is accelerating rapidly. Michael Saylor's MicroStrategy famously leveraged its balance sheet to borrow funds, buy Bitcoin for its treasury and then rinse and repeat. The strong performance of MicroStrategy has unsurprisingly led to copy-cats. This week, GameStop became the latest one, confirming that it had bought 4,710 BTC worth about $513 million. In a sign that the buck might not stop here, SharpLink, a performance-based marketing company serving the U.S. sports betting and global iGaming industries, launched a $425million private placement to accumulate Ethereum into its treasury.
Leaving aside the question of who would lend so much money to a sports marketing company, other burning questions remain. Will Bitcoin FOMO lead to another parabolic rally? Will Ethereum treasury-buys finally lead to new all-time-highs for the 2nd largest Crypto Coin by market cap? And will that lead to a 'more traditional' Altcoin rally? Maybe most importantly: how sustainable is the MicroStrategy Treasury accumulation?
As always in Crypto markets, reflexivity is strong on the way up, but critical on the way down. If the BTC price ever drops below the average purchase price of its Bitcoin and debt-rollover deadlines are approaching, will MicroStrategy end up having to sell Bitcoin in a fire sale? Past market history tends to agree with Murphy's Law: usually, whatever can go wrong in crypto, eventually does go wrong. Maybe the day will come when the rise of Bitcoin dominance will stop 'the hard way'.

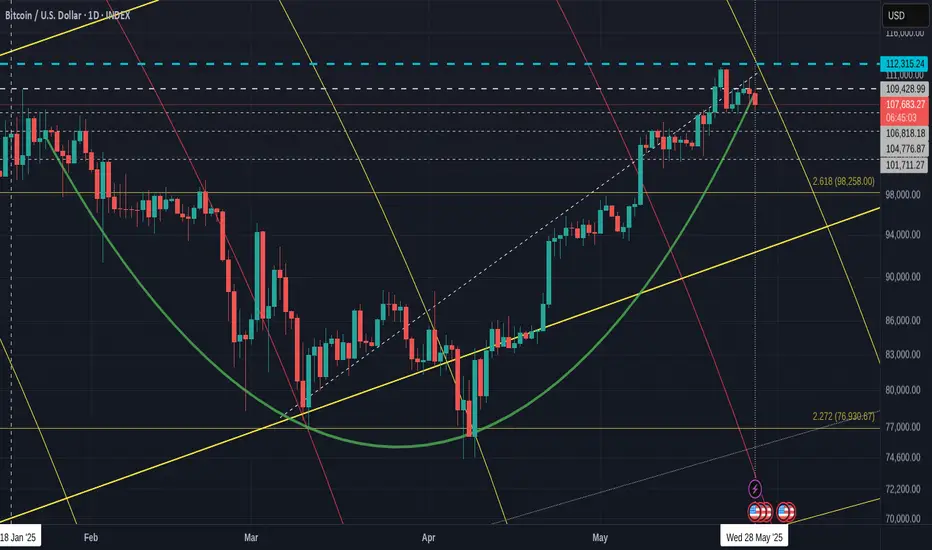
Bitcoin - Fib circles Happen. PA knocked down a little.
Been warning you about this Fib circle coming up and now we know it is resistance... but how strong ?
We do not know just yet but we can lok to the left to see what happened last time.
Over pn the left, we can See PA droped for 7 days bwfore breaking away.
This could happen again and support is below.
The 4 hour chart gives us a better insight
PA has already found the first line of support and we currently have a small green candle.
Further support below at 104700 and 101700
If they fail, we have the 2.618 Fib extension at 98200 - This should be a strong line of support
If that fails, there is ther support and I will talk abou tthat when the time comes.
It is wise to be cautious with Bitcoin right now as the 4 hour and Daily MACD are Bearish.
This could change anytime and the Bullish "Sentiment" still exists
Bitcoin Dominance is dipping again but has the strength to bounce, so be cautious with the ALTS
More Soon
Bitcoin 150k is very likely On weekly timeframe bitcoin broke the yellow resistance few weeks ago, now the support on weekly is about 99.6k and resistance about 148k

BTC/USDT Technical Analysis and Trade Idea📉 BTC Pullback or Full Reversal? Let's Break It Down 🔍
Looking at the Bitcoin chart right now, we’re seeing more than just a minor pullback. On the 30-minute timeframe, there’s a clear bearish market structure shift setting in. In my opinion, this isn't a quick dip before continuation — we may be in for a deeper retracement. 🧐
When we overlay NASDAQ (which Bitcoin is often closely correlated with), it becomes even clearer — tech stocks look overextended and are showing signs of a potential pullback. 📉
So here’s the plan:
If BTC pulls back into my point of interest, I’ll be watching for a bullish break of structure to consider a long position. Simple, structured, and in line with what the charts are telling us. 🔁💹
⚠️ As always, this is not financial advice — just sharing how I'm reading the market right now.
💬 What are your thoughts? Are you watching the same levels? Drop a comment below 👇 and let’s talk trade setups! 🚀

Bitcoin: Will it surpass $109k in its upward trend?Since April, Bitcoin has traded in a clearly defined upward channel with two lower and upper trend lines. This channel was formed three touchpoints both on the lower and upper trendlines.
Near a critical zone
Now, BTC is at a key resistance zone where it previously peaked around $109,000, holding its all-time high. This level resists both judgement as well as forensic level significantly of a psychological barrier because it was the peak of the last major bull cycle. The price is currently hovering around the everyday resistance line while BTC is still in the upward channel. In conjunction with the historic all-time high and the upper channel resistance, range bound price action gives us an accurate capture of BTC’s behaviour.
Bullish breakout
The scenario outlined for this resistance zone makes the most sense as a rejection may lead to a temporary pullback, likely to the somewhat lower boundary of the rising channel. This in itself would not be the termination of the bullish trend, but instead a healthy retracement within the confines of an uptrend structure. But, if the market does break out above the $109,000 level with ample volume and bullish momentum, then things could start changing in the market for the better from there. Such breakout will confirm the uptrend is strong and valid where else new breakout targets will also be set turning the old high into new low. The $109,000 level would then probably move from resistance to support, making it a critical area for bulls to protect on any retests in the future.
A bearish breakout
The ramifications of a breakdown below the rising channel should also be understood by traders. It is crucial to keep an eye on the channel's lower barrier, which is presently at about $104,000. A significant decline below this level would signal a loss of short-term bullish momentum and lead to a more thorough correction. In that scenario, Bitcoin would probably go for the imbalanced area between $97,500 and $100,500, where the price has previously moved quickly without forming any solid support or resistance. Buyers may be able to intervene in this zone and try to restore bullish dominance, which may pave the way for a new breakout attempt and another surge toward the $109,000 barrier.
Conclusion
In conclusion, Bitcoin is at a critical point right now. Bitcoin is currently facing a significant resistance zone at its prior all-time high, but the upward channel that has directed price action since April is still in place. The degree of market momentum and the actions of buyers and sellers at these critical levels will determine whether the price hits new highs or declines. Investors and traders should be alert and ready for both situations since the next action could determine how Bitcoin develops over the following few weeks.
I appreciate your help.
To ensure you do not miss the upcoming analysis, be sure to follow me!
Please leave a remark and a like!

BTC/USDT Analysis – Still Long
Hello everyone! This is the daily analysis from a trader-analyst at CryptoRobotics.
Yesterday, Bitcoin bounced off the volume zone at $109,200–$106,500, but then faced resistance in the $110,100–$111,500 area — a zone we previously overlooked due to the strong bullish context.
Currently, the positive trend remains intact, and we are still expecting a new local high. However, before that happens, a decline and a retest of the local low at $106,600 is likely. Supporting the continuation of the overall uptrend are the following factors: absorption on the cumulative delta, an unbroken ascending trendline, and volume distribution.
Buy zones:
$109,200–$106,500 (volume zone)
$103,200–$102,000 (absorption of market sells)
Around $100,000 (aggressive buying volumes)
$98,000–$97,200 (local support)
$93,000 level
$91,500–$90,000 (strong buy-side imbalance)
This publication is not financial advice.

LongTerm BITCOIN LINEAR chart & NUPL tells a story -August Top
We can start with the main chart.
This is a LONG TERM LINEAR chart, showing the price action Directly, unaltered by mathmatics,
Long Term charts usualy are shown by logarithmic charts.
Linear and logarithmic trading charts differ in how they represent price changes. Linear charts display equal price changes the same, making them suitable for short-term traders focusing on exact price movements. On the other hand, logarithmic charts show percentage changes, which makes them better for long-term investors or volatile assets, as they help in analyzing trends and patterns more clearly over time.
This chart starts just before the 2017 ATH and you can easily see the line that rejects ATH and how PA is up near that area right now.
Things to note are the day count from 2017 ATH to 2021 Final ATH and the day count between that double Top in 2021.
These numbers are projected to our current cycle and show we are near the projected Top using this style of Chatr, The Log charts project further into the year.
It may also be worth noting how the 50 EMA (red) was used by PA after the Drop after the first ATH, to bounce back up to the next ATH at the end of that year.
We have just done exactly the same again, PA was rejected by that long term Line and Dipped down to the 50 EMA and has since bounced back up to the rejecting line.
IS REJECTION LIKELY NOW? [/b
This is something that is impossible to answer with any real Fact But we can look at data and make eductaed projections.
PA has the ability and strength right now, to range high, running up under this line of rejection until it becomes overbought on the long term MACD, RSI , TSI etc
But something that will absolutely decide when the top is in is the Profit taking by Holders.
We are currently seeing Selling taking place and we can see the potential profit by looking at NUPL
NUPL, or Net Unrealized Profit/Loss, is an indicator used in trading to measure the difference between unrealized profits and losses in the Bitcoin market.
Here is the chart from all the way back to 2010
Lots to see here but to summerise.
See how there are Peaks each cycle of Maximum available profit. The point where profit taking Tops out is arrowed. This area, up to the red line, shows us the TOP zone.
What is VERY noticable this cycle is how we have not yet reached that upper Red line.
Sellers appear to be taking theor profits earlier.
The upper day counts have been consistant in the past, with 2 double tops of potential profit before the selling sold it all off.
Many people, including me, have been saying "This time is different" and this is VERY clearly shown here by the fact that we have already had the 2 peaks of potential profit and we are currently climbing to the 3rd
This has NEVER happened before and, technicaly, this could continue.
The Lower day counts are from Mid Double Tops to the Next Mid double top of potential profits mentioned above,
The Next "Mid point" is projected to be around July.
This NUPL also shows ua how the high level of potentia profits was reached Quicker this cycle than previously. This was helped by the Corporations buying Early and Massive amounts, putting Large numbers of coins into profit
In Conclusion [/i
We have the Linear Bitcoin chart pointing towards a JULY / August Top
We have the NUPL also pointing towards a July / August Mid point of Potential profits.
If you loo cloely, BOTH charts, using differnet data, suggest 28 July
What also maybe worth considering here is how we see that Potential profits are reducing in availability. As the asset becomes more expensive to buy, it also gets harder to push the price higher and so make more profit. I,E. It was eaier to double the price of Bitcoin when it was $50 a coin
Of course, non of this may play out, Things ARE DIFFERNT but I have now decided to have another plan ready for August and we need to wait and see what happens Next
BE PREPARED FOR ALL POSSIBILITIES

Short-Term BTC Scalping Opportunity⚡Say less
💥Setup and forget
💥the position is off if price hits 111,959 first.
💥leverage maybe used according to your risk management

This 3 Step System Will Show You The Trending StockThis is a powerful chart for you to watch.
Because its following the Rocket booster
strategy.
The Rocket booster Strategy has 3 Steps;
1-The price has to be above the 50 EMA
2-The price has to be above the 200 EMA
3-The price should gap up or trend up.
In order for us to know whether the price
will trend up we are using the ADX indicator.
We make sure that the Blue line
Is rising between the Green line
and the Red line .
This confirms the last step of the rocket booster
strategy.Also remember that the NASDAQ is up-trending.
Rocket boost this content to learn more.
Disclaimer;Trading is risky please use a simulation account
for trading before you trade with real money.
Also learn risk management and profit taking strategies.
