#Bitcoin's long-term road plan!-396 days Processed Between 2013 High and 2015 Bottom!
-365 days Processed Between 2017 High and 2018 Bottom!
-365 days Processed Between 2021 High and 2022 Bottom!
-1065 days processed between 2015 Bottom and 2017 Peak!
-1065 days processed between 2018 Bottom and 2021 Peak!
-1430 days Processed Between 2015 Bottom and 2018 Bottom!
-1430 days Processed Between 2018 Bottom and 2022 Bottom!
If the 1065 model is processed between 2022 Bottom and 2025 Peak, I think we will see a local peak in October.
If the 365 days Model is processed, I think we will see a 2025 Peak in October and a 2026 October Bottom.
I will be grateful if you appreciate...
Bitcoinprice

Bitcoin Total Market Cap Update – Strategic Scenarios AheadAs of May 8, 2025, the total cryptocurrency market capitalization stands at approximately \$3.012 trillion, reflecting a 2.17% increase from the previous day . Bitcoin's market cap is around \$1.962 trillion, with a current price of \$98,798.11 .
Given these figures, we are considering the following potential scenarios for the crypto market:
---
1. Break Above \$3T and Hold ✅ (30% Probability)
* The market breaks through the \$3 trillion level.
* Retests it as support.
* Continues the bullish momentum from there.
---
2. Rejection and Consolidation 🔁 (50% Probability)
* Price gets rejected at \$3T.
* Moves sideways between \$2.8T and \$3T.
* Eventually breaks out and retests \$3T as support before resuming upward.
---
3. Bearish Turn Below \$2.8T 🔻 (20% Probability)
* Rejection at \$3T.
* Market loses \$2.8T support.
* Retests \$2.8T as resistance, followed by further downside pressure.
---
Key Levels to Watch
* \$2.8T and \$3T are critical zones. Movements between these levels indicate uncertainty and should be approached with caution.
---
Our Perspective
A retest of \$3T as support could present the strongest buying opportunity of this cycle. We urge everyone to stay alert, analyze carefully, and prepare accordingly.
Golden Cross is looming — remain focused and disciplined.
---
Stay updated and connected:
With best regards,
Team ProCryptoEdge
Educate. Empower. Elevate.

Bitcoin Dominance - the two scenarios!Bitcoin dominance continues to rise after breaking out of a rising wedge pattern on the weekly chart. It has now also broken through the 0.786 Fibonacci level.
Next stop is Rectangle 1, where Bitcoin dominance is expected to reach 68% — and most likely, this will mark the top of dominance before it starts to drop, triggering a historic altcoin season.
Scenario 2:
Dominance keeps pushing higher toward Rectangle 2, potentially surpassing 70%. At that point, many altcoins may form new lows, and weak projects could get wiped out.
Fear in the market will hit extreme levels —
but that could signal the beginning of an altseason and the collapse of BTC dominance.
Best regards Ceciliones 🎯

Bitcoin Daily - heading towards resistance with strength
Bitcoin is continuing to head towards that red 236 Fib circle while being Kept below the 2.618 Fib Extension
This could see PA Drop back to the 92K area where it will bump into the Cup shape it has created.
This Cup has strength . It has been tested 3 times previously and on each occasion, PA Bounced well off it
The overhead resistance and the Daily MACD are two reasons why this may happen
As you can see, the Daily MACD is touching its signal line, potentially Bearish but most likely only on a short term basis
But we should be ready incase things continue to turn Bearish, as it did before. See the rise in MACD on the left.
Not the similarity in the Histogram on both occasions.
Today, we have the DXY support group, otherwise known as the FED reserve, announcement on Rates.
This could trigger a move in either direction, depending on the choice.
Expectation is for Rates to remain unchanged
PA has the ability to move in both directions,.
We need to wait and see

BITCOIN BEARISHGigaAlgo BTC Market Outlook – May 7, 2025
Sentiment: Still bullish overall, but short-term timeframes are starting to weaken.
Price Action: BTC recently tapped into a key premium supply zone and is showing signs of rejection.
Structure: The trend remains in a bullish structure with higher highs and higher lows, but a minor break of structure has occurred near the recent high.
Support Zones: If the current support level fails, the next major support lies at the equilibrium zone, with stronger demand lower in the discount area.
Volume Analysis: Heavy volume was seen near the highs, indicating potential exhaustion or smart money selling.
Oscillator Insight: Momentum is slowing, suggesting a possible consolidation or deeper retracement before any further move up.

Bitcoin Fibo Levels - next step 150kSo by looking at Fibo levels, one can see that in the previous cycle (2017-2021) Bitcoin top was around 3.618 fibo level with respect to the previous ATH.
Now, in this cycle we can see every leg up is also following Fibo levels:
First leg from fibo 0 to 0.236
Second leg from fibo 0.236 to 0.5
Third leg from fibo 0.5 to 1
FOurth leg from fibo 1 to 1.618
So next leg could take us from 1.618 to around 2.618, which is 157k USD. Now it may be a bit more higher, aorund 180k, which would take us to the orange / red zone of the bitcoin rainbow pricing model.
Now the timeframe to achieve that price level should be around July to September if we follow a similar pattern to previous legs, which would also coincide with the timing of peaks of previous cycles, following the rainbow model and halving cycles.

Bitcoin and the 2013 - 2017 Fractal Update - Have we left it >?
For now, I am going to say YES but maybe not completely.
If we look at the shape of the Fractal and what BTC PA is currently doing, it could be said that we have just completed 2 ranges in one go..the little one that Took us below the fractal and the other one that is next up the Fractal line.
But it is the next 8 weeks that will define this fully and for now, so as to not get caught short, literally, I am looking to that Dashed Arrow that comes off the circle.
Noe, I drew that circle back in late Feb ( posted in March ) and PA has just entered it, as can be seen on this Daily version of the same chart ( but with candles and not a line)
The fact that we have even entered this area tells me that the dashed Arrow is the path PA will take as a route of least resistance and with a possible ATH in Dec of around 322K USD.
That ATH is on the line of resistance drawn from the 2017 ATH and has rejected every Cycle ATH since. ( The line shown on the chart irons out detail but be assured, that line passes throgh the 2021 Nov ATH )
The possibility does exist, thogh gettign slimer, that PA could climb back over the top of the Fractal, though the push to do that would take a LOT of investment... possibly to much now.
So, I will sit happy, looking forward to a 370K -> 322K ATH later in the year..
And it MUST be said, as I always say, Look on both sides. There is a possibility that PA could Drop back to the 80K - > 72K line though I feel this is highly unlikely but we are now entering a zone of strong resistance
Things may get Volatile Soon.
But I would just like to say "THANK YOU" to the 2013 -2017 Fractal. You have taken us on a ride since Nov 2021 and shown us how to do things properly.
And so now.........New Adventures and Horizons await........Onwards and upwards

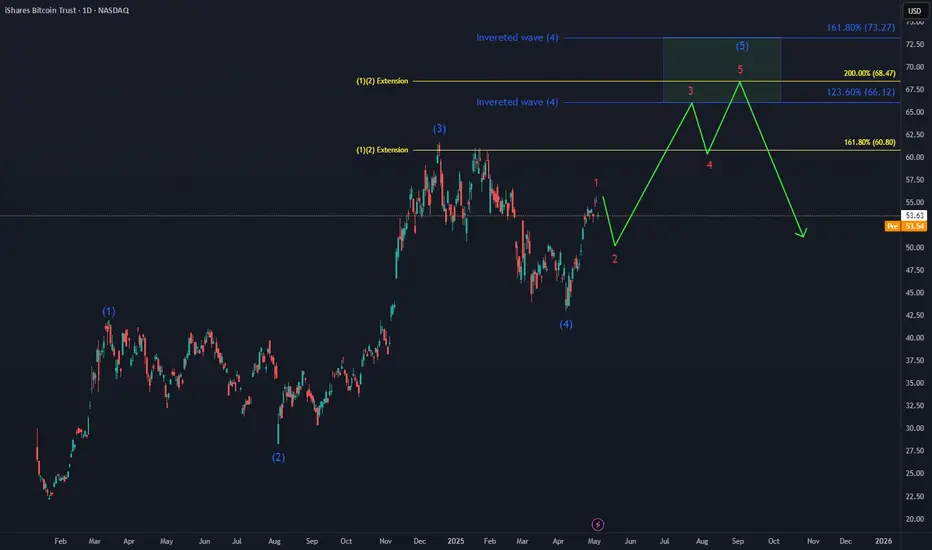
Bitcoin ETF IBIT Next TargetThe Bitcoin INDEX:BTCUSD ETF NASDAQ:IBIT is shaping a 5-wave move toward a new ATH, set to complete its cycle within a regular impulse.
Key technical area for the next move higher:
🔵 Inverted wave (4) target : $66 - $73
🟡 Wave (1)(2) extension : $68
BTC/USDT Update – GigaAlgo SMC | May 6, 2025
Price action continues to respect the previous analysis — BTC remains in the premium zone, now showing clear rejection with back-to-back bearish candles. Although overall sentiment remains labeled as BULLISH, the multi-timeframe JASMINN AI and Regression tools reflect short-term downside momentum, especially below the 94K zone.
Key updates:
94K has turned into immediate resistance — failure to reclaim could signal a deeper pullback.
Support at 93K remains critical. If that fails, BTC may retrace to the equilibrium zone around 85K, consistent with earlier charts.
Watch for volume shifts — bearish volume is now increasing (25%), reflecting stronger sell-side interest.
Structure Breakdown:
BOS (Break of Structure) has been followed by a lower high, hinting at a potential shift if a lower low forms next.
Still within the overall bullish market structure, but correction looks imminent unless bulls step in above 94.5K.

BTC testing support or more downside?After breaking out of last week's range, BTC failed to flip R to S. Currently testing potential support, if price fails to hold it current price range between $93.k, we could see a retest of GETTEX:92K or the 1D 200MA around $90k.

Chainlink Trend update on 06/May/2025Chainlink market update on 06/May/2025. Currently, it break 13.8$ and keep our eye to see whether it touch 12.8$ zone and reverse or not.
#Chainlink #Defi

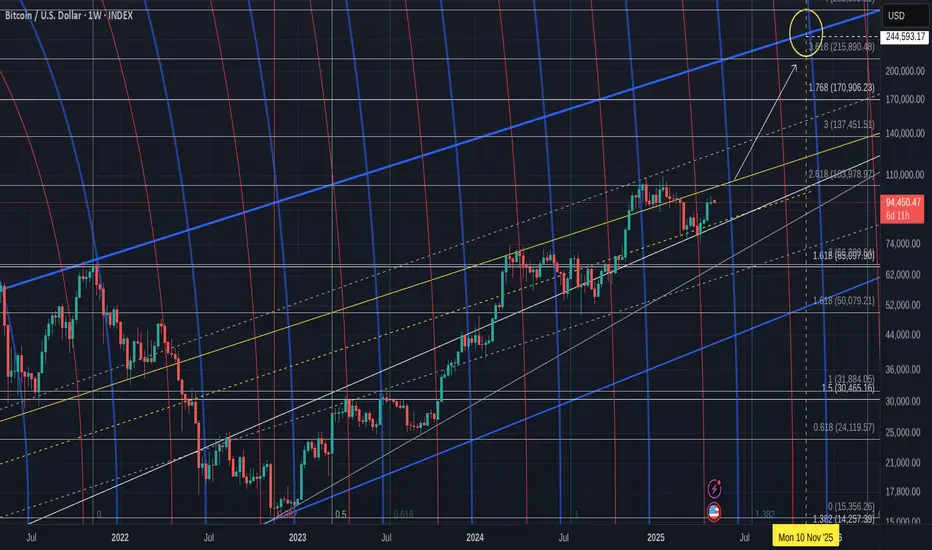
Bitcoin Weekly Long Term Chart showing realistic Cycle ATH
Bitcoin PA taking a breath of Air having pushed up off the lower trend line
Currently facing short term resistance as mentioned in the Daily chart just posted.
The Weekly MACD has yet to Croos its signal line ( red)
There is currently little reason to expect this to not happen.
PA currently sits Mid point of its rising channel with strong support below. We may well stay in this area till Mid Month, depending on the Macro influences.
The projected ATH in the circle top right of chart is on the ATH line created sine the 2017 ATH top.
It is a projection and an Expectation but there is confluence with many charts as to this Cycle Top price range. There are charts that show a Much higher price, though I feel they are possibly more pointing towards the Next cycle Top in 2029 ( If the cycle pattern continue as they have since 2017 )
We are on the edge of moves higher and we just need to remain patient......
Bitcoin Daily Bullish CUP pattern but with resistance coming in
Please excuse the number of lines here but this is my working chart and I am short of time but I wanted to share this.
Bitcoin Daily has printed a Bullish CUP and is back on the Rim but we have still to reach the edge of the Cup, which is expected around 15th May, 10 days. When PA entered thhis Cuo, it also ranged sideways for a while.....
Something that PA has to face in the near future is that red 236 fib circle. And PA may be already reacting to that.
Look to the left and see what happened last time we hit a red 236 fib circle.
I think we are in a stronger position this time though but a Drop to the Long term rising trend line is a very real possibility
That is around 92K - > 87K -Not a Major drop and it would actually play into the Bulls hands by resetting the Daily MACD that is already beginning to turn slightly Bearish
This is NOT a reason to PANIC or Sell but is more an opportunity, maybe the last one, to Buy BTC at around this price.
I think a drop back down to the 2.272 Fib extension at 77K is highly unlikely but we should have a plan should this happen.
We do have the DXY support group, sorry, THE FED announcing the Next decision of Rates on 7th and it is very likely that PA will Drop till then, slowly hopefully, resetting the MACD as previously mentioned, and then push through that 236 Fib circle after the continued Freeze on Rates is announced.
We have to wait and see......

BITCOIN BULLISH BTC/USDT Analysis – GigaAlgo SMC | May 5, 2025
Price has recently tapped into a premium OB zone with strong volume rejection. Although JASMINN ML flags bearish sentiment, the structure still supports bullish momentum up to 96K unless the 93K support fails. If that breakdown occurs, the next significant support lies around 83K, aligning with previous volume zones and the STATION marker.
The GigaAlgo Oscillator shows a deep red bar print, hinting at increasing bearish pressure short-term, while multi-timeframe sentiment shows a mix of red and green — signaling indecision and potential range-bound action.

Bitcoin Price Action Analysis – Bearish Correction Toward DemandHello Guys!
Let's analyze btc!
Rising Trendline Break: The bullish structure has broken down as the price failed to hold above the key support region around $96,000–$96,200.
Targeted Demand Zone: The highlighted purple box between $94,200 and $94,700 represents a demand zone that has previously shown strong buyer interest. The current structure suggests Bitcoin may revisit this zone for a potential bounce.
Bearish Momentum: A large arrow indicates the directional bias toward the downside, aligning with the correction and market sentiment.
Fake RSI Divergence: The RSI panel indicates a “Fake Divergence” pattern, which may have misled early bulls. RSI has since dropped and currently hovers in the neutral zone, with no strong bullish signals yet.
_____________________________
Conclusion:
Unless a strong bounce occurs around current levels, Bitcoin looks poised to correct further toward the $94,200–$94,700 demand zone. Traders should watch for reactionary price action and bullish reversal patterns before considering long entries.

"...I'm tired, I'm leaving..."Well, that’s it — Bitcoin is tired of resisting the bears. As long as there was enough buy volume, the bears were offloading quietly. But now, we’re heading down.
Happy May holidays, everyone. I’ll post a more detailed update tomorrow — stay tuned!

Cold shower for bitcoinAs I mentioned earlier — when gold cools down, Bitcoin tends to rise. And when gold climbs, Bitcoin usually takes a breather. Don’t forget this dynamic.

The worst-case scenario for Bitcoin📉 Potential Dip to $70,000 in 2026
Some analysts suggest that Bitcoin could experience a correction to around $70,000 in 2026. This potential downturn may be influenced by:
Market Cycles: Bitcoin's price has historically followed cyclical patterns, with periods of rapid growth followed by corrections.
Regulatory Changes: Shifts in global regulatory stances toward cryptocurrencies could impact investor sentiment and market dynamics.
Macroeconomic Factors: Economic events, such as changes in interest rates or geopolitical tensions, could influence risk appetite among investors.
It's important to note that while a dip to $70,000 is within the realm of possibility, other forecasts for 2026 are more optimistic. For instance, CoinCodex projects Bitcoin trading between $94,836 and $160,074 in 2026, with an average price of $119,743 .
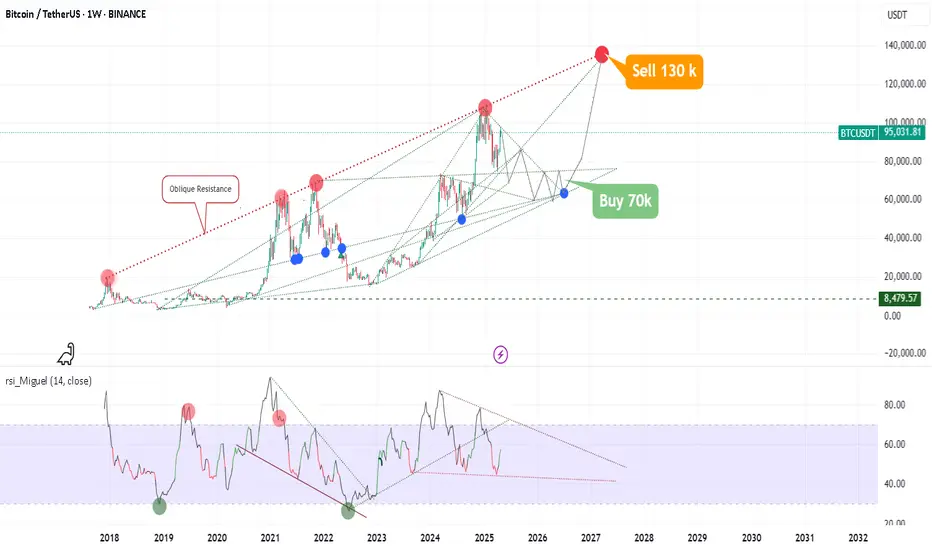
🚀 Surge to Over $130,000 in 2027
Looking ahead to 2027, several factors could contribute to a significant increase in Bitcoin's price:
Institutional Adoption: Growing interest from institutional investors could drive demand.
Technological Advancements: Improvements in blockchain technology and scalability solutions may enhance Bitcoin's utility.
Global Economic Conditions: In times of economic uncertainty, Bitcoin is often viewed as a hedge against inflation.
Analysts have provided various projections for 2027:
Binance forecasts a price range between $140,491 and $216,738, with an average of $170,100 .
Bittime estimates an average price of $138,000, with potential highs up to $150,000
BTCUSDTI’ve cancelled this trade. The new setup will be the one I’m sharing now. 🔄📉
A potential short signal is forming on BTCUSDT. However, it's not ideal to open the sell position right now — we need to wait for the price to reach a specific level. Once it does, we can execute the trade.
So, what are the entry, TP, and SL levels for this setup?
If you’ve just started following me, let’s get started!
🔍 Criteria:
✔️ Timeframe: 15M
✔️ Risk-to-Reward Ratio: 1:1.50 / 2
✔️ Trade Direction: Sell
✔️ Entry Price: 95652.05
✔️ Take Profit: 95300.05
✔️ Stop Loss: 95827.73
🔔 Disclaimer: This is not financial advice. It's a trade I’m taking based on my own system, shared purely for educational purposes.
📌 If you're also interested in systematic and data-driven trading strategies:
💡 Don’t forget to follow the page and subscribe to stay updated on future analyses.

AI BTC Prediction Next 24–48 Hours !May 3, 2025, 11:13 pm. BTC/USD. BTC/USD Trading Plan
Timeframe: Next 24–48 Hours
Long Scenario
- Entry: 96,550 (confirmed close above 96,500 with rising volume + RSI > 50).
- SL: 95,700 (below immediate support 95,800).
- TP: 96,800 (below resistance 97,000).
- Trailing Stop: 1.5x ATR (~162 pips) after surpassing 96,800.
- Confirmation: MACD histogram reversal + Bollinger Band breakout above midline.
Short Scenario
- Entry: 95,750 (confirmed close below 95,800 with rising volume + RSI < 40).
- SL: 96,600 (above resistance 96,500).
- TP: 95,200 (above support 95,000).
- Trailing Stop: 1x ATR (~108 pips) after breaking 95,500.
- Confirmation: Supertrend remains bearish + EMA crossover downward.

BITCOIN 3 x Double Top, Dip, Range, Bounce since Jan 2023
The Chart says it all really.
The 3 times PA has gone sideways, it can be seen as a Double Top, Dip and Range.
The Accumulation / Distributions was similar on Both previous occasions ( 2023, 2024 ) and, so far, are also very similar on this occasion in 2025.
But there are some major differences.......
IF these were to be seem as forms of WYCKOFF Ranges, then the longer the Range period, the stronger the move higher after and I find it very clear, that the move higher after the 2023 range was a lot higher than the move higher after the 2024 Range
2023 Range was approx 189 days ( marked on a Weekly chart so up to 7 days inaccuracy )
2024 Range was approx 168 days.
Currently, we are on 147 days. ( I mark this as a significant date as there was a 20 day difference between 2023 ane 2024 and the 147 is 20 days short of the 2024)
However, this is slightly different this time as we Dropped out of original Range box and have Just pushed back higher into original range Box, so, even though we have had a good few weeks, we are still in Range, the Original Range Box
On the original Chart, the dotted line just below PA is the approx line of the 50 Week SMA and we bounced off that Twice in 2024 to push higher and we just bounced off that again to return to original range box.
But as you can see, that was only a Wick down. It may not have been a Full on bounce to take us out of the upper range box and I see Momentum slowing for a while now
This also happened on previous occasions but on a smaller scale.
This can be seen better on the Daily chart, that includes the SMA's
SMA's 50 Red, 100 Blue, 128 Green & 200 Yellow
The first thing to note is how the 200 is about to cross the 100
This is NOT a thing to panic about as the recent push higher will not be reflected in these Averages for a while but it does show the Depth of the Dip we just came out of.
What IS important is how PA is ABOVE the Averages..
But the Candle size are small and we are cooling off on a Daily MACD
We are NOT overbought on this MACD yet and so we could see a turn higher but Longer term, so long as we remain in the upper Range Box, it would be good if this cooled off to Neutral again
For me, I am hoping for a GREEN MAY candle Close and that could very well happen but the candle may not be Large, which leaves PA still in this Range by month end, but maybe in the upper edges of it....around 110K
This would then allow for the possible Small RED June, that would take PA back to lower range. as we saw in 2020 - .THEN we have a nice cooled PA
OR we could just go for it NOW and see what happens as we did in 2017
it is impossible to predict this but we can be ready ..
BUY BOTCOIN - HOLD BITCOIN

New Bitcoin ATH Incoming? Key Bullish Signals & Decoupling AnalyBitcoin at the Precipice: Analyzing the Confluence of Bullish Signals, Decoupling Dynamics, and the Looming Question of a New All-Time High
The cryptocurrency market, and Bitcoin in particular, exists in a perpetual state of flux, analysis, and fervent speculation. In recent weeks and months, a compelling narrative has begun to coalesce, woven from disparate threads of technical indicators, on-chain data, market dynamics, and historical parallels. Bitcoin, after a period of consolidation and correction, appears to be sending signals that have historically preceded significant upward movements. Analysts are pointing to specific indicators flashing green, a potential local bottom seems confirmed, and intriguing shifts are occurring in mining difficulty and Bitcoin's relationship with the wider altcoin market. All this culminates in the tantalizing question echoing across trading desks and social media: Is a new Bitcoin All-Time High (ATH) incoming, perhaps even within the next year?
This article delves deep into the multifaceted factors fueling this speculation. We will dissect the analyst flags suggesting a major rally, examine the evidence for a confirmed local bottom, explore the significant decoupling of Bitcoin from altcoins, analyze the implications of the shifting mining difficulty, evaluate the compelling comparison to Gold's historical breakout, and assess the technical picture presented by indicators like the Stochastic RSI and Taker Buy/Sell ratio. By synthesizing these elements, we aim to provide a comprehensive overview of the forces currently shaping Bitcoin's trajectory and the arguments underpinning the bullish outlook for a potential new ATH, possibly targeting Q2 2025.
Part 1: Reading the Tea Leaves – Indicators Flagging a Potential Rally
Experienced market analysts often rely on a combination of technical and on-chain indicators to gauge market sentiment and predict future price movements. Recently, several reports have highlighted specific indicators whose current state mirrors conditions observed just before previous major Bitcoin bull runs. While the exact proprietary indicators used by every analyst vary, common themes emerge:
• On-Chain Metrics: These look at the activity happening directly on the Bitcoin blockchain. Key metrics often cited include:
o Supply Dynamics: Tracking the amount of Bitcoin held by long-term holders versus short-term speculators. An increase in long-term holding often suggests accumulation and reduced selling pressure. Metrics like "Supply Last Active 1+ Years Ago" reaching high levels can indicate strong conviction among holders.
o Network Activity: While not always a direct price predictor, sustained growth in active addresses or transaction counts can signal underlying adoption and utility growth.
o Profit/Loss Indicators: Metrics like Net Unrealized Profit/Loss (NUPL) or Spent Output Profit Ratio (SOPR) help gauge whether the market is overheated or potentially finding a bottom. A shift from capitulation (heavy losses) towards profitability can be a bullish sign.
• Technical Indicators: These are derived from price and volume data.
o Moving Averages: Crossovers of key moving averages (e.g., the 50-day moving average crossing above the 200-day moving average, known as a "Golden Cross") are classic bullish signals for many traders. The positioning of price relative to these averages is also crucial.
o Momentum Oscillators: Indicators like the Relative Strength Index (RSI) and the Moving Average Convergence Divergence (MACD) measure the speed and change of price movements. Emerging from oversold conditions or showing bullish divergences can signal strengthening momentum.
• Market Sentiment Indicators: While harder to quantify, tools analyzing social media sentiment, futures market positioning (funding rates, open interest), and options market data (put/call ratios) can provide clues about the prevailing mood among traders.
The core argument presented by analysts is that a confluence of these diverse indicators, many of which have strong historical track records in predicting Bitcoin rallies, are simultaneously aligning in a bullish formation. It's not just one signal, but a pattern across multiple datasets suggesting that the groundwork for a significant upward move is being laid. This historical resonance provides a powerful argument for those anticipating a break towards previous highs.
Part 2: The Confirmed Local Bottom – Building a Foundation for Growth?
Complementing the forward-looking indicators is the assertion that Bitcoin has successfully established a "local bottom." This implies that a recent period of price decline has concluded, and a new support level has been found from which price can potentially rebound. Confirmation of a bottom is often a multi-step process:
1. Price Action: A clear cessation of the downtrend, often marked by a specific low point that holds despite retests. This might involve candlestick patterns indicating reversal (like hammers or engulfing patterns) or the formation of a sideways consolidation range after a fall.
2. Volume: Capitulation volume (a spike in selling volume near the low) followed by declining volume during consolidation, and then potentially increasing volume on upward moves, can support the idea of a bottom.
3. Indicator Confirmation: Technical indicators like the RSI moving out of oversold territory (<30) or MACD showing a bullish crossover below the zero line often accompany bottom formations.
4. Holding Key Support: The price successfully defending a significant historical support level or a key Fibonacci retracement level adds weight to the bottoming argument.
The claim that "all indicators flash bullish" in conjunction with a confirmed local bottom suggests a powerful technical setup. It implies that the selling pressure that drove the price down has exhausted itself, buyers are stepping back in at these levels, and multiple technical measures are signaling renewed upward momentum. Establishing a firm bottom is crucial; without it, any rally attempt could be short-lived. This confirmed base provides psychological reassurance to bulls and a defined level for risk management (placing stop-losses below the confirmed low). The question then shifts from "Will it stop falling?" to "Where is the price headed next?"
Part 3: The Great Crypto Decoupling – Bitcoin Forges Its Own Path
One of the most significant market structure shifts observed over the past year is the growing divergence between Bitcoin and the broader altcoin market. Historically, Bitcoin often acted as the tide lifting all crypto boats; when Bitcoin rallied, altcoins typically followed, often with even greater percentage gains (and vice-versa). However, recent data points to a stark change:
• Record Market Cap Gap: The difference in total market capitalization between Bitcoin and the entire altcoin sector has reportedly reached its largest point ever. This signifies that capital inflows are disproportionately favoring Bitcoin.
• Performance Divergence: While Bitcoin has made significant strides, reclaiming substantial portions of its previous losses and challenging key resistance levels, many altcoins have lagged considerably. Some have even continued to trend downwards relative to both the US Dollar and Bitcoin itself.
• Shift from Tandem Movement: The lockstep correlation that characterized previous cycles appears broken, or at least significantly weakened. Bitcoin is charting a course influenced more by its own specific drivers than by the general sentiment across the entire crypto asset class.
•
Several factors likely contribute to this decoupling:
• Institutional Adoption & ETFs: The launch and success of spot Bitcoin ETFs in the US (and similar products elsewhere) have provided a regulated, accessible channel for institutional capital to flow directly into Bitcoin. This capital is often focused solely on Bitcoin as a digital store of value or portfolio diversifier, largely ignoring the more speculative altcoin market.
• Narrative Strength: Bitcoin's core narrative as "digital gold" – a decentralized, scarce, censorship-resistant store of value – has gained traction, particularly in environments of macroeconomic uncertainty or inflation concerns. This narrative is unique to Bitcoin and doesn't necessarily extend to most altcoins, which often have different value propositions (utility tokens, DeFi platforms, etc.).
• Regulatory Clarity (Relative): While regulatory landscapes are still evolving globally, Bitcoin generally enjoys a greater degree of regulatory clarity (often classified as a commodity in key jurisdictions like the US) compared to many altcoins, which face ongoing scrutiny regarding their potential classification as securities. This perceived lower regulatory risk can make Bitcoin more attractive to cautious investors.
• Flight to Quality: During periods of market uncertainty or following negative events within the broader crypto space (like exchange collapses or protocol exploits), investors may rotate capital from riskier altcoins into the perceived safety and established network effect of Bitcoin.
•
This decoupling has profound implications. For investors, it means diversification within the crypto space is becoming more complex; owning altcoins is no longer a guaranteed way to amplify Bitcoin's gains. For Bitcoin, it suggests a maturation of its asset class status, attracting capital based on its unique properties rather than just general crypto market sentiment. This potentially makes Bitcoin's price action more robust and less susceptible to negative developments in obscure corners of the altcoin market.
Part 4: Mining Difficulty Adjustment – A Breather for the Network's Backbone
The Bitcoin network's health and security rely on miners who dedicate vast computational power to validating transactions and adding new blocks to the blockchain. The "Difficulty" is a crucial network parameter that automatically adjusts roughly every two weeks (every 2016 blocks) to ensure that new blocks are found, on average, every 10 minutes, regardless of how much total mining power (hash rate) is connected to the network.
• How it Works: If blocks are being found too quickly (more hash rate online), the difficulty increases, making it harder to find the next block. If blocks are being found too slowly (hash rate has dropped), the difficulty decreases, making it easier.
• Recent Trend: The report notes that difficulty had increased in the four previous adjustments, indicating a sustained rise in the total hash rate competing on the network.
• Expected Drop: Now, on-chain data forecasts an almost 5% drop in difficulty for the upcoming adjustment. This implies that a noticeable amount of hash rate has recently come offline.
•
Why might hash rate decrease, leading to a difficulty drop?
• Profitability Squeeze: Mining profitability is determined by the price of Bitcoin, the miner's electricity costs, the efficiency of their mining hardware (ASICs), and the current network difficulty. If Bitcoin's price stagnates or drops while difficulty remains high (or energy costs rise), less efficient miners or those with higher operating costs may become unprofitable and shut down their rigs.
• Hardware Cycles: Older generation ASICs become obsolete as newer, more efficient models are released. A difficulty drop might reflect a temporary lull before newer hardware is fully deployed or older hardware being permanently retired.
• External Factors: Regional energy price fluctuations, regulatory changes affecting mining operations in certain areas, or even extreme weather events impacting large mining facilities can temporarily reduce the global hash rate.
What are the implications of a difficulty drop?
• A Break for Miners: For the remaining miners, a lower difficulty means they have a slightly higher chance of finding the next block with the same amount of hash power. This can improve their profitability, potentially reducing the need for them to sell mined Bitcoin immediately to cover operational expenses. Reduced selling pressure from miners is generally considered a positive market factor.
• Network Self-Regulation: It demonstrates the robustness of Bitcoin's design – the network automatically adjusts to maintain its target block time, ensuring consistent transaction processing regardless of fluctuations in mining participation.
• Not Necessarily Bearish: While a significant drop could signal miner capitulation in a deep bear market, a moderate drop after a period of sustained increases might simply be a healthy cooldown or consolidation phase in hash rate growth, allowing the ecosystem to adjust.
This expected difficulty drop, therefore, provides a welcome respite for miners, potentially easing selling pressure and showcasing the network's adaptive capabilities.
Part 5: Technical Signals and Historical Echoes – Stochastic RSI, Taker Ratio, and the Gold Fractal
Beyond the broader indicators and market dynamics, specific technical signals and historical chart patterns are adding fuel to the bullish fire:
• Bitcoin Stochastic RSI: The Stochastic RSI is a momentum indicator that uses RSI values (rather than price) within a stochastic oscillator formula. It ranges between 0 and 100 and is used to identify overbought and oversold conditions, but often more effectively in identifying strengthening momentum. A signal suggesting "brewing bullish momentum" likely means the Stochastic RSI is rising from oversold levels or showing a bullish crossover, indicating that underlying momentum (as measured by RSI) is accelerating upwards. Such signals often precede periods of strong price appreciation.
• Taker Buy/Sell Ratio (Binance): This ratio measures the aggression of buyers versus sellers executing market orders (takers) on a specific exchange (in this case, Binance, a major hub for crypto trading). A "sharp increase" in the Taker Buy Ratio (or Buy/Sell Ratio) signifies that buyers are aggressively hitting the ask price to acquire Bitcoin, willing to pay the market price rather than waiting for their limit orders to be filled. This indicates strong immediate demand and buying pressure, often interpreted as a bullish signal suggesting conviction among buyers.
• Bitcoin Mirroring Gold's Breakout Structure: This is a fascinating observation based on fractal analysis – the idea that chart patterns can repeat themselves across different time scales and different assets. The claim is that Bitcoin's current price structure (consolidation patterns, corrections, subsequent recovery) closely resembles the structure Gold exhibited before one of its major historical breakouts. If this fractal pattern holds true, it suggests Bitcoin might be in the final stages of consolidation before a significant upward move, mirroring Gold's past trajectory. This analysis leads to the specific, albeit highly speculative, prediction of a potential new ATH occurring in Q2 2025. While historical parallels are not guarantees, they provide a compelling narrative and roadmap for traders looking for historical context.
• Sandwiched Between Support & Resistance: This describes the immediate technical battleground. Bitcoin's price is currently caught in a range defined by a significant support level below (a price floor where buying interest has previously emerged) and a major resistance level above (a price ceiling where selling pressure has previously intensified). The outcome of this battle is critical. Can the bulls, bolstered by the positive indicators and dynamics discussed, muster enough strength to break decisively above resistance? Or will the bears successfully defend that level, potentially leading to another rejection or further consolidation? This price zone represents the current line in the sand.
Part 6: Synthesis and Outlook – Weighing the Evidence for a New ATH
Synthesizing these diverse factors paints a complex but potentially bullish picture for Bitcoin:
• The Bullish Case: Multiple historically reliable indicators are signaling conditions that preceded past rallies. A local bottom appears confirmed, providing a stable base. Bitcoin is increasingly decoupling from the riskier altcoin market, potentially attracting more focused institutional capital via ETFs. A looming drop in mining difficulty could ease selling pressure from miners. Specific technical indicators like the Stochastic RSI and Taker Buy/Sell Ratio point towards growing buying momentum and aggression. Furthermore, a compelling (though speculative) historical parallel with Gold's breakout structure offers a potential roadmap towards a new ATH, perhaps by Q2 2025.
• The Hurdles and Risks: Despite the bullish signals, significant resistance levels lie ahead, representing areas where sellers have previously overwhelmed buyers. Macroeconomic uncertainty (inflation, interest rates, geopolitical events) can always impact risk assets like Bitcoin. Regulatory developments, while potentially clarifying for Bitcoin, remain a source of potential volatility. The crypto market is inherently volatile, and unforeseen events ("black swans") can rapidly alter market sentiment. The Gold fractal is a historical observation, not a guarantee.
Conclusion:
Bitcoin currently stands at a fascinating juncture. The confluence of bullish indicators flagged by analysts, the apparent confirmation of a local bottom, the significant decoupling from altcoins driven partly by institutional flows, the potential easing of pressure on miners via a difficulty drop, and specific technical signals like the Stochastic RSI and Taker Buy Ratio collectively build a strong case for optimism. The comparison to Gold's historical breakout adds another layer of intrigue, offering a specific (though speculative) timeline for a potential new All-Time High.
However, optimism must be tempered with caution. Major resistance levels loom large, representing the immediate challenge for bulls. The broader macroeconomic and regulatory environments remain key variables. While the indicators suggest brewing momentum and historical patterns offer encouraging parallels, breaking through established resistance and embarking on a sustained rally towards a new ATH is never a certainty in the volatile world of cryptocurrency.
The coming weeks and months will be crucial in determining whether the bullish signals translate into decisive price action. Can the bulls overcome the resistance that currently sandwiches the price? Will the decoupling trend continue to funnel capital into Bitcoin? Will the mining landscape stabilize favorably? The answers to these questions will likely determine if the whispers of an incoming ATH, potentially mirroring Gold's path towards Q2 2025, become a roar or fade back into the market noise. The stage seems set, the indicators are aligning, but the final act is yet to be written.

BITCOIN INCOMING MOVES Hello Traders
As i can Bitcoin is trying to break 97K$ which seems hard i am expecting a drop rill design levels if not break 97K$ and then it shoot if market break and Close above 97K$ on weekly chart then it a possibility to break previous ATH and make a new ATH till desing levels Share ur thoughts with us we appriciate ur comments and support presonally i am selling from this zone with a very small SL 97300 and MY TPs showing inchart make a proper research before taking any trade
Stay Tuned for more updates ......
