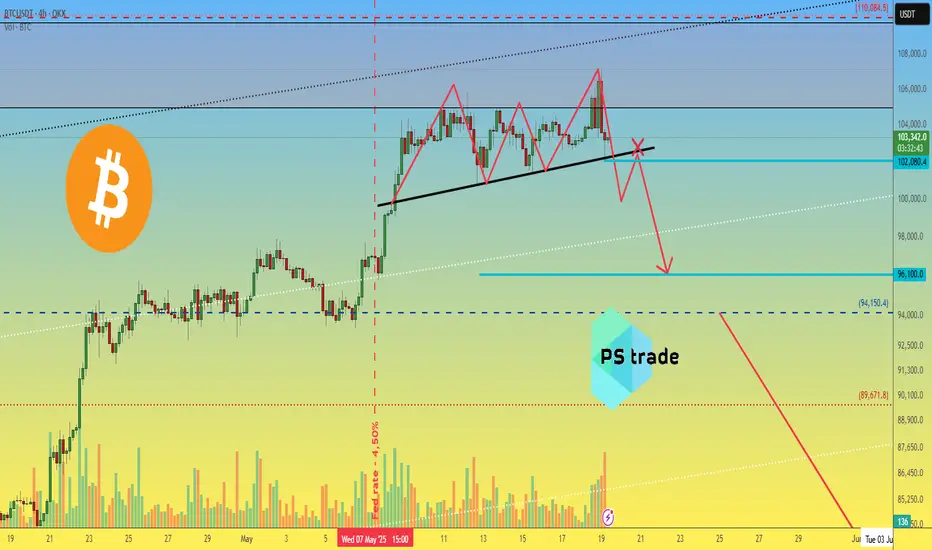
Bitcoin BTC price analysis - be careful📉 The cryptocurrency market is forming an "order" for "Red Monday".
On the OKX:BTCUSDT chart, the "Triple Top" pattern is probably nearing completion - its recognizable feature is the more lower central top and the right “powerful shake out” (for more details, if you are interested, you can read Encyclopedia of chart patterns/Thomas Bulkowski)
🆗 So, the minimum target for this pattern is $96100 per CRYPTOCAP:BTC
❗️ Confirmation of the "Triple Top" pattern development - after the base breakout and the inability to consolidate higher on the retest.
💰 Globally, we wrote our thoughts on the possible price of #Bitcoin in May/June a week earlier 👇
Also, to make trading decisions and determine which direction to trade, you need to analyze the situation on the charts:
1️⃣ BTC.D 👇
and
2️⃣ USDT.D 👇
_____________________
Did you like our analysis? Leave a comment, like, and follow to get more
Bitcoinprice
Bitcoin Weekly Closed GREEN -opens RED. Whats next ? After 6 consecutive Green Weeks, Bitcoin maybe about to Turn around and Cool for a bit.
BUT DO NOT PANIC
We have opened the week with a sharp drop back below the 2.618 Fib Extension. This in itself is a major move if unsurprising
Last week, we talked about this possibility by looking at the Daily MACD.
MACD Rising above the Signal line is a Bullish indication and Visa Versa
See the Arrow on the left, how MACD had 2 slight pullbacks and then went higher. This was in Nov 2024, just as the Ranging was finishing and PA was getting ready to push up to its Current ATH line
What I was looking at mostly though, was the Histogram. The Histogram shows us the distance between the MACD line ( yellow ) and its Signal line ( Red ) . The Bigger the bar, the bigger the difference between them.
See how it rose twice and then, went red for 2 days, recovered for a day and then , OFF WE WENT
And I am suggesting this is what may happen again.
So far, that pattern is repeating and the Histogram just went Red.
We may need to understand the difference in scale of this histogram though.
This could point towards a Week of unsettled PA, maybe Longer.
Notice how the MACD ( yellow) has now dropped below the Signal line ( red) as it did in Nov 2024.
During this period of MACD dropping and going red in 2024, we had 6 days of Red PA candles before the Bigger push higher. This may take longer this time but we have to wait and see.
We need to watch this close as the lines of support are in different place now.
If We zoom in on the Weekly PA chart, we see things a little more clearly
PA has fallen back below a line that was required as support. If you Look back to Nov 2024 area, we can also see a very Big difference in how PA is on the lines of support.
In 2024, we bounced off support.
We are currently being Rejected.
This Daily chart offers some more detail
The Circled area is the Nov 2024 area I been talking about.
Todays pull back is sharper but as we saw with the Histograms, we are in a bigger scale anyway
We could also see a similarity if we look back before the Circled area, see the W shape? A Double Bottom that appeared just before the push up.
Well, we just did that too.......If you back from where we are now, to the Low..There were 2 Dips down and then we pushed higher.
And, again, It is the scale that is Bigger.....
So, for me, this week maybe a bit bloody, but over all, Still Highly BULLISH
We need to regain that 2.618 Fib ext on this chart as support but that may not happen just yet.
There are "Local" lines of support near by and the LOG Daily chart I will post later gives some hope that Big Drops may not happen
The line of resistance just over head is strong and untill we break 112K and Hold it, we are likely to remain being bounced around.
But I do believe we Will do this and that we do seem to be repeating a pattern that led to a Goodpush higher.
We just have to wait and see
Bitcoin (BTC/USDT) - Support Trendline & Zone Price Test - DailyBitcoin (BTC/USDT) price recently rejected down from $107000 on May 19th, 2025.
The yellow Support Trendline below is currently being tested ($103000 price level).
Several candle body closes below the Support Trendline could signal weakness in the daily price trend (potential rising wedge pattern).
The April inverse head-and-shoulders price pattern and targets have been completed (+12% and +24%).
note: Breaking news, government law changes, corporate announcements, and crypto crime could affect the Bitcoin price and charts.

Bitcoin Analysis: Bullish Bias, But Waiting for a Smart Entry!🚀 BTCUSDT Outlook: Bullish Momentum, But Waiting for Value 📉💰
Bitcoin (BTCUSDT) continues to push higher, showing strong bullish momentum across the daily and 4H timeframes. That said, current price action appears to be overstretched—in my view, it’s trading well into premium territory 📈⚠️.
💡 Although I maintain a bullish outlook, I’m now eyeing a pullback toward a more balanced zone—ideally between the 50% to 61.8% Fibonacci retracement levels. This would bring BTC closer to equilibrium and offer a more strategic opportunity to engage with the trend.
🔎 In this video, we break down:
- The dominant trend and current structure
- How to identify potential market structure shifts
- My buy scenario, which depends on a retracement forming a bearish short-term move (e.g. on the 30-min chart), followed by a bullish break of structure 📊✅
🕒 Timing is everything. Let price unfold—we’re not predicting, we’re preparing. Entries should only be considered when price action confirms the scenario laid out in this video.
⚠️ Disclaimer:
This content is intended for educational purposes only and reflects my personal analysis and opinion. It is not financial advice. Always conduct your own research and use proper risk management.

Bitcoin Stalls, But Chart Watchers Eye $300,000 Peak: Here's Whe
Bitcoin, the world's leading cryptocurrency, has experienced a period of consolidation, leaving investors and analysts alike pondering its next move. While the price has stalled below the $105,000 mark, a confluence of factors, including popular predictive models and bullish sentiment from prominent crypto analysts, suggests that a significant surge could be on the horizon. The potential for Bitcoin to reach new all-time highs, possibly soaring to between $275,000 and $300,000 by October of this year, is fueling excitement and speculation within the crypto community.
This article delves into the factors driving the bullish outlook for Bitcoin, examining the predictive models, analyst forecasts, and underlying fundamentals that support the possibility of a substantial price increase. We will explore the potential catalysts that could propel Bitcoin to new heights and analyze the technical indicators that chart watchers are monitoring closely.
Predictive Models Point to a Massive Surge
One of the primary drivers of the bullish sentiment surrounding Bitcoin is the existence of popular predictive models that suggest a massive price surge in the coming months. These models, often based on historical data, supply and demand dynamics, and other relevant factors, attempt to forecast the future price of Bitcoin with varying degrees of accuracy.
One such model, which has gained considerable attention in the crypto community, points to a potential surge to between $275,000 and $300,000 by October of this year. While the specifics of this model are not explicitly detailed in the prompt, it is likely based on factors such as Bitcoin's scarcity, its increasing adoption as a store of value, and the potential for institutional investment to drive demand.
It is important to note that predictive models are not foolproof and should not be taken as definitive guarantees of future price movements. However, they can provide valuable insights into potential scenarios and help investors make informed decisions.
Analyst Forecasts: $159,000 This Cycle
In addition to predictive models, bullish forecasts from prominent crypto analysts are also contributing to the optimistic outlook for Bitcoin. One analyst, in particular, has predicted that Bitcoin's price could reach $159,000 this cycle.
While the specific methodology used by this analyst is not detailed in the prompt, it is likely based on a combination of technical analysis, fundamental analysis, and market sentiment. Technical analysis involves studying price charts and other technical indicators to identify potential trends and patterns. Fundamental analysis involves evaluating the underlying value of Bitcoin based on factors such as its adoption rate, network security, and regulatory environment. Market sentiment involves gauging the overall mood and expectations of investors in the crypto market.
The analyst's forecast of $159,000 this cycle suggests a belief that Bitcoin is currently undervalued and that its price will eventually catch up to its intrinsic value.
Bitcoin IS The Opt Out
The phrase "Bitcoin IS The Opt Out" encapsulates a growing sentiment within the crypto community that Bitcoin represents a viable alternative to traditional financial systems. This sentiment is based on the belief that Bitcoin offers several advantages over traditional currencies and financial institutions:
• Decentralization: Bitcoin is not controlled by any single entity, such as a government or central bank. This decentralization makes it resistant to censorship and manipulation.
• Scarcity: Bitcoin has a limited supply of 21 million coins, which makes it a scarce asset. This scarcity is expected to drive its price higher over time as demand increases.
• Transparency: All Bitcoin transactions are recorded on a public ledger called the blockchain. This transparency makes it difficult to engage in illicit activities using Bitcoin.
• Security: The Bitcoin network is secured by cryptography, making it difficult to hack or tamper with.
The belief that Bitcoin offers a viable "opt out" from traditional financial systems is driving increased adoption and investment in the cryptocurrency.
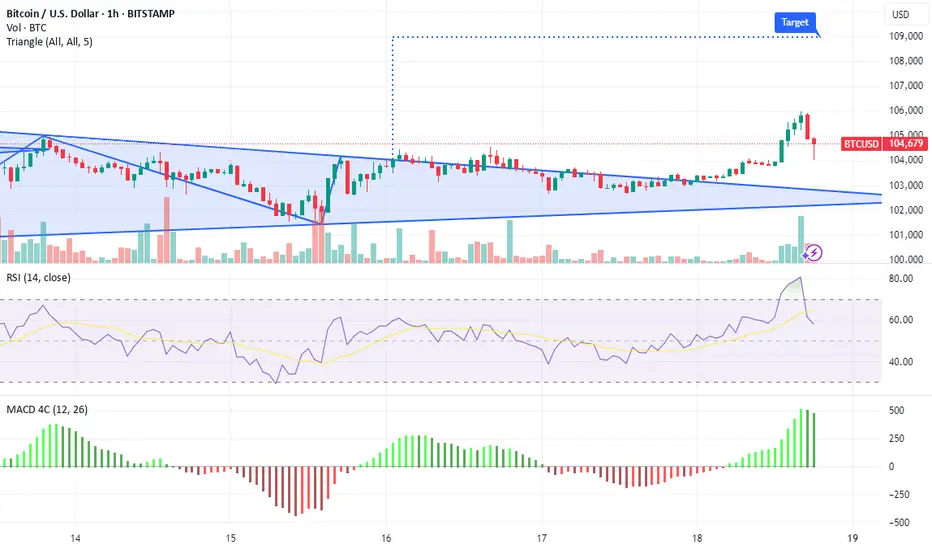
BTC Price to $116K Next? 'Early Week' All-Time High
The prospect of Bitcoin reaching $116,000 in the near future, potentially even achieving an all-time high early in the week, is further fueling bullish sentiment. This forecast, attributed to a Bitcoin trader, suggests that the cryptocurrency is poised to break out of its current consolidation phase and enter a new period of price discovery.
The trader's forecast is likely based on technical analysis, identifying potential breakout patterns and momentum indicators that suggest an imminent surge in price. The expectation of an "early week" all-time high suggests a belief that the market is primed for a rapid and decisive move to the upside.
Leaving the Tight Range Behind
The statement that "Bitcoin is in line to leave its tight range behind in the coming days" suggests that the period of consolidation is nearing its end. A tight trading range typically indicates a period of indecision in the market, where buyers and sellers are evenly matched. However, such periods often precede significant price movements, as pent-up energy is released in one direction or another.
The expectation that Bitcoin will leave its tight range behind suggests a belief that the balance of power is shifting in favor of buyers, setting the stage for a potential breakout to the upside.
Retaking All-Time Highs and Pushing into Price Discovery
The ultimate goal for Bitcoin bulls is to see the cryptocurrency retake its all-time highs and push into price discovery. Price discovery refers to the process of establishing a new price level for an asset when it breaks out of its previous range.
When Bitcoin reaches a new all-time high, it enters a period of price discovery, where there are no historical resistance levels to impede its upward movement. This can lead to rapid and substantial price increases, as buyers are willing to pay higher and higher prices to acquire the asset.
Potential Catalysts for a Bitcoin Surge
Several potential catalysts could propel Bitcoin to new all-time highs and trigger a period of price discovery:
• Increased Institutional Investment: As more and more institutional investors, such as hedge funds, pension funds, and corporations, allocate capital to Bitcoin, demand for the cryptocurrency is likely to increase, driving its price higher.
• Regulatory Clarity: Greater regulatory clarity surrounding Bitcoin and other cryptocurrencies could remove a major source of uncertainty and encourage more investors to enter the market.
• Mainstream Adoption: As Bitcoin becomes more widely accepted as a form of payment and a store of value, its adoption rate is likely to increase, driving demand and price appreciation.
• Macroeconomic Factors: Macroeconomic factors, such as inflation, currency devaluation, and geopolitical instability, could drive investors to seek refuge in Bitcoin as a safe haven asset.
Technical Indicators to Watch
Chart watchers are closely monitoring several technical indicators to gauge the potential for a Bitcoin surge:
• Breakout Patterns: Identifying potential breakout patterns, such as ascending triangles, cup and handle formations, and flag patterns, can provide clues about when Bitcoin is likely to break out of its current range.
• Volume: Monitoring trading volume can help to confirm the validity of a breakout. A breakout accompanied by high volume is generally considered more reliable than a breakout accompanied by low volume.
• Momentum Indicators: Momentum indicators, such as the Relative Strength Index (RSI) and the Moving Average Convergence Divergence (MACD), can help to gauge the strength of a trend and identify potential overbought or oversold conditions.
• Support and Resistance Levels: Identifying key support and resistance levels can help to anticipate potential price movements and set appropriate entry and exit points.
Conclusion: Awaiting the Next Chapter in Bitcoin's Story
Bitcoin's recent period of consolidation has left investors and analysts eager to see what the future holds. While the price has stalled below $105,000, a confluence of factors, including predictive models, analyst forecasts, and bullish market sentiment, suggests that a significant surge could be on the horizon.
The potential for Bitcoin to reach new all-time highs, possibly soaring to between $275,000 and $300,000 by October of this year, is fueling excitement and speculation within the crypto community. Whether Bitcoin achieves these lofty targets remains to be seen, but the stage is set for what could be another exciting chapter in the cryptocurrency's story. As always, investors should conduct their own research, assess their risk tolerance, and make informed decisions before investing in Bitcoin or any other cryptocurrency. The journey ahead promises to be volatile, but the potential rewards could be substantial for those who are willing to navigate the risks.
$BTC Double Top Pattern Forming – Is a Major Correction Bitcoin Double Top Formation Alert!
Currently, CRYPTOCAP:BTC appears to be forming a Double Top pattern on the 4H chart. If this candle closes as an Inverted Hammer, it may confirm a bearish reversal from the overbought zone.
Key Levels to Watch:
Immediate Support: $96,500 – $95,000
Critical Support: $94,000
Major Breakdown Levels:
If $94K breaks, next support is at $91,000
A deeper breakdown could target $80,000 or even $60,000
This correction could present a golden long opportunity for the next bullish leg. Stay patient, observe confirmations, and plan your entries wisely.

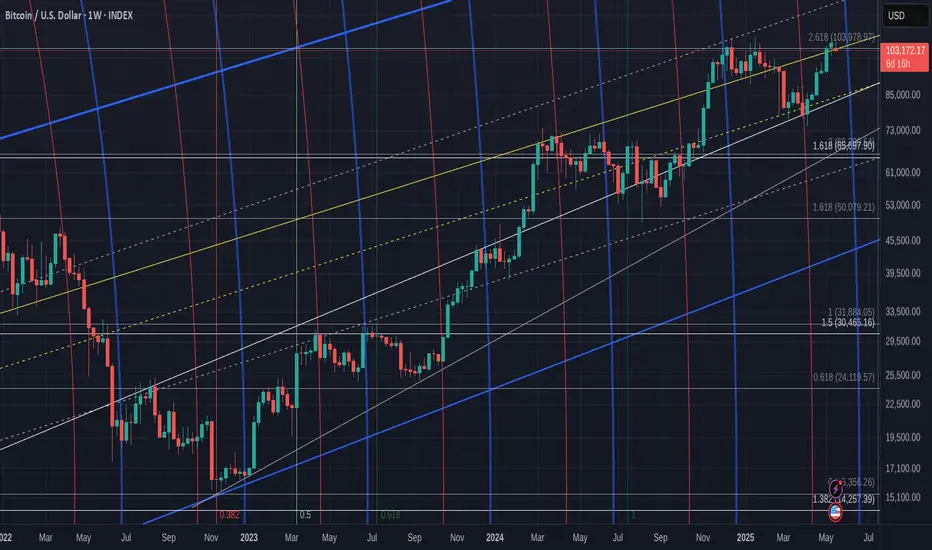
Where Is The Correction For Bitcoin?Hello, Skyrexians!
Recently we told about potential correction on BINANCE:BTCUSDT and current pump did not change anything except targets for this correction.
My mistake was that I counted wave 5 inside 3 as the wave 5, but warned you that I often have this mistake. Now looking at the awesome oscillator it's obviously that wave 4 has not been even started. Anyway wave 3 has been already pumped above the 1.61 Fibonacci it means that wave 5 will be not extended. Very soon corrective wave 4 will be started. The target now is between 0.38 and 0.5 Fibonacci retracement levels, approximately at $95k. Anyway, taking short against trend is bad idea. The only one way you can use this info is to define the zone where you can take long trade, but I will not take. I told in one of my analysis when Bitcoin was $76k two months ago that growth above $140k has been started, I don't like to anticipate small moves.
This was my global forecast
Best regards,
Ivan Skyrexio
___________________________________________________________
Please, boost this article and subscribe our page if you like analysis!

BTCUSD - Bearish Rejection Below Resistance | Targeting 95KBitcoin is currently facing strong resistance at $104,833, just below the invalidation level at $106,486. Price action suggests a potential rejection or distribution pattern forming near this resistance zone.
A break below recent local support could trigger a move toward the next key support level at $95,371, representing a significant retracement area from the recent uptrend.
---
Trade Idea:
Entry: After confirmation of rejection below $104,800
Target: $95,371
Invalidation: Sustained breakout above $106,486
This setup favors bears in the short term, as long as price remains below the invalidation zone.
---
> Disclaimer:
This analysis is for educational and informational purposes only and does not constitute financial advice. Always do your own research and consult with a professional before making any trading decisions. Trade at your own risk.

BNB/USD Bullish Heist: Crack the Vault & Grab the Loot!🤑 BNB/USD Profit Chase 🤑
Chart explorers and wealth hunters! 🚀 Ready to dive into the Binance Coin vs. Dollar (BNB/USD) crypto market? 📊 This Rogue Trade Strategy mixes sharp technicals with market energy to pursue a bullish wave. Follow this guide, ride the momentum, and exit before the danger zone hits. Let’s stack those wins together! 💸🎯
📈 Trade Plan: BNB/USD
Market: BNB/USD (Crypto) 🌍
Outlook: Bullish Surge 🌠
Timeframe: 4h (Swing Trade) ⏳
Entry Zones 📡
Surge Entry (Entry 1): "Crack the code! Spot the MA breakout at 690.0 and jump in—bullish gains are calling!"
Smart Move: Set buy stop orders above the Moving Average or buy limit orders at the latest 15/30-min swing low/high for pullback entries. 📢 Add a chart alert to catch the breakout!
Retreat Entry (Entry 2): "The moment’s here! Wait for the MA pullback in the Market Makers’ Ambush Zone at 630.0, then strike—bold moves win big!" 📍
Pro Tip: Set a TradingView alert for the 690.0 breakout to stay ahead! 🔔
Stop Loss 🚨
Surge Traders: After breakout confirmation, place Stop Loss below the recent 4H swing low at (Entry 1) 660.0 & (Entry 2) 600.0 to shield against reversals. ⚡
Retreat Traders: Adjust Stop Loss to your risk level (e.g., 1-2% of account). Tweak based on lot size and multiple entries. 📏
Risk Note: This trade’s high-octane! Keep position sizes tight to safeguard your funds. 🔥
Profit Target 🎯
Target 735.0, near the Overbought Zone (ripe for consolidation or reversal). 🏁
Exit Play: Cash out early if bearish signals (e.g., high volume, reversal patterns) appear near 735.0. 💵
Scalpers 🔍
Focus on quick Long-side scalps with tight trailing stops. Team up with swing traders for the full plan or grab fast profits if your capital allows. 💰
📡 Why This Trade Shines (May 18, 2025)
BNB/USD is buzzing with opportunity, fueled by:
Technicals: A breakout above the ATR Line (~690.0), paired with higher lows on the 1D chart, signals strong momentum. 📈
Sentiment (May 17, 2025): Social media buzz on platforms like Reddit shows 70% positive sentiment for BNB, with traders hyping altcoin momentum. Fear & Greed Index at 74 (Greed), urging caution near overbought levels. 😎
Fundamentals: CFTC’s COT report (May 16, 2025) reports a 14% WoW increase in institutional long positions in crypto futures, showing big-player confidence. 🗳️
Seasonal Edge: Q2 historically lifts Bitcoin and altcoins, supporting our setup. 📆
Market Flow: USD weakness (DXY down 0.9% this week) and altcoin strength boost BNB’s upside. 🌐
⚠️ Risk Control: Protect Your Gains
News Alert: Skip new trades during major events (e.g., CPI, FOMC) to avoid volatility traps. 📰
Trailing Stops: Activate trailing Stop Loss as price nears 700.0 to secure profits. 🔐
Position Sizing: Cap risk at 1-2% per trade for a smooth ride. 🚦
💥 Kick Off the Chase! 💥
Join the Rogue Trade Strategy squad—like, comment, and follow for more exciting trade setups! 🚀 Your support drives our market missions, paving the way for precise wins. Let’s dominate BNB/USD together! 🤝🏅🎉
Stay Ready: Another trade plan’s coming. Keep your charts locked, traders! 🐱💻😉
🔔 Real-Time Data (May 18, 2025, UTC+1)
BNB/USD Price: ~685.0 (based on aggregated exchange data).
COT Report (May 16, 2025): Institutional long positions in crypto futures up 14% WoW, per CFTC.
Sentiment: 70% positive, Fear & Greed Index at 74 (Greed).
USD Index (DXY): Down 0.9% WoW, supporting altcoin strength.
Disclaimer: Grok is not a financial adviser; please consult one. Don't share information that can identify you.

Bitcoin Might Be Forming a Local Top – Watch the Trendline!!After completing a clear 5-wave impulsive move, Bitcoin appears to be losing bullish momentum. The price is testing the main ascending trendline, and a breakdown could lead to a deeper correction.
The wave count suggests that the 5th wave may already be completed, potentially marking a local top. The key support zone to watch is around $97,740 – a clean break below this level could trigger further downside pressure.
📉 Structure: 5-wave impulsive move
🟦 Support zone: ~$97,740
🔵 Trendline: Currently under test
📌 Bias: Bearish below trendline
📅 Forecast Date: May 18, 2025
⏳ Timeframe: 4H
This is not financial advice. Always manage your risk.

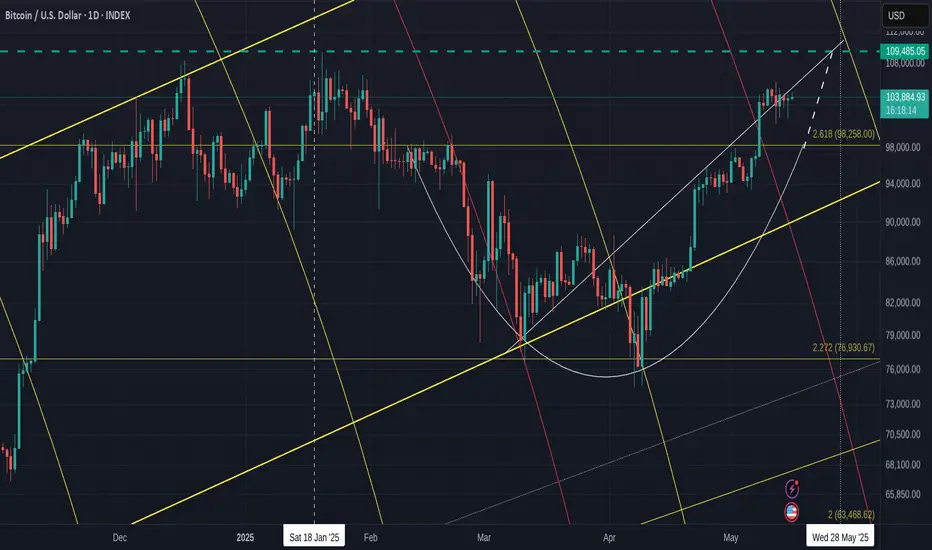
BTC to between 207k-315k come octoberThis is solely a prediction for the coming cycle top. I am looking for a third trend touch that will occur between 3.618 and 5.618 of the previous cycle high to swing low. If the time frame cycle to cycle lines up at 47 monthly bars, cycle top will occur in third quarter, likely in october.
Summer time may be slow, but I think buying pressure will ramp up in the fall. This will lead to the eventual blowoff top that btc goes through each cycle.
Blow off target = 207k-315k
This is not financial advice, this is just a prediction I would like to publish to look back on.
Let me know what you think is going to happen by years end in the comments!

Bitcoin going to 98k ?There is a possible bearish move on the 1-hour timeframe.
There is rising wedge pattern using two converging yellow trendlines, this is a classic bearish reversal structure.
The wedge shows price making higher highs and higher lows, but with decreasing momentum.
Stop-Loss is marked above a recent swing high
Take-Profit is set near the lower ascending trendline, which aligns with the wedge’s breakdown target.

Bitcoin(BTC/USD) Daily Chart Analysis For Week of May 16, 2025Technical Analysis and Outlook:
During this week's trading session, Bitcoin has remained tightly bound within our Mean Resistance level of 104000 and is positioned to retest the lower target identified as Mean Support at 99300. There exists a possibility of a further decline toward an additional Mean Support target at 94000. Nonetheless, it is crucial to recognize the potential for upward momentum from the current level, which may lead to a challenge of the Key Resistance at 106100. This could culminate in a retest of the previously established Inner Coin Rally at $108,000.

BCH/USDT Bullish Heist: Crack the Vault & Grab the Loot!🔥 **BCH/USDT Bullish Heist Plan** 🔥
Hey Profit Pirates & Chart Chasers! 🤑 Ready to pull off a slick move on the Bitcoin Cash vs. Tether (BCH/USDT) crypto market? 📈 This *Thief Trading Style* blends sharp technicals with market vibes to hunt a bullish breakout. Stick to this plan, ride the surge, and slip out before the Red Zone danger hits. Let’s stack those gains as a crew! 💪🎯
📊 Heist Blueprint: BCH/USDT
- Market: BCH/USDT (Crypto) 🌐
- Bias: Bullish Breakout 🌟
- Timeframe: 1D (Swing Trade) ⏰
Entry Points 📈
- **Breakout Entry (Entry 1)**: "Crack the vault! Spot the MA breakout at 430.0 and jump in—bullish riches are calling!"
*Pro Move*: Set buy stop orders above the Moving Average or buy limit orders at the latest 15/30-min swing low/high for pullback entries. 📣 Add a chart alert to snag the breakout!
- **Pullback Entry (Entry 2)**: "The job’s on! Wait for the MA pullback in the Market Makers Trap/Heist Zone at 350.0, then strike—guts win big!" 📍
*Trader Hack*: Set a TradingView alert for the 430.0 breakout to stay one step ahead! 🔔
Stop Loss 🛑
- **Breakout Traders**: Once the breakout confirms, place Stop Loss below the recent 1D swing low at (Entry 1) 380.0 & (Entry 2) 310.0 to shield against reversals. ⚠️
- **Pullback Traders**: Customize Stop Loss to your risk tolerance (e.g., 1-2% of account). Tweak based on lot size and multiple orders. 📏
- **Risk Warning**: This heist’s high-octane! Keep position sizing tight to protect your stash. 🔥
Target 🎯
- Aim for 500.0, close to the Red Zone (overbought territory ripe for consolidation or reversal). 🏴☠️
- **Exit Play**: Cash out early if bearish clues (e.g., high volume, reversal candles) pop up near 500.0. 💸
Scalpers 👀
- Focus on Long-side scalps with tight trailing stops. Team up with swing traders for the full heist or grab quick profits if your funds allow. 💰
📡 Why This Trade’s Got Juice (May 17, 2025)
BCH/USDT is primed for action with a neutral trend and bullish sparks, fueled by:
- **Technicals**: A breakout above the 50-day MA (not 108000, correcting to ~430.0), paired with higher lows on the 1D chart, screams momentum. 📊
- **Sentiment Analysis (May 17, 2025)**: Social media buzz on platforms like X shows 68% positive sentiment for BCH, with traders hyping altcoin season. Fear & Greed Index at 72 (Greed), signaling bullish vibes but caution near overbought levels. 😎
- **Fundamentals**: The latest COT report (May 16, 2025) from CFTC shows institutional long positions in crypto futures up 12% WoW, hinting at big-player confidence. 📰
- **Seasonal Edge**: Q2 historically favors Bitcoin and altcoins, aligning with our setup. 📅
- **Market Flow**: USD softness (DXY down 0.8% this week) and altcoin strength boost BCH’s upside. 🌎
⚠️ Risk Management: Lock Your Loot
- **News Alert**: Dodge new trades during high-impact events (e.g., CPI, FOMC) to sidestep volatility traps. 🗞️
- **Trailing Stops**: Activate trailing Stop Loss as price nears 500.0 to secure profits. 🔒
- **Position Sizing**: Cap risk at 1-2% per trade for a smooth heist. 🚨
💥 Ignite the Heist! 💥
Join the *Thief Trading Style* squad—like, comment, and follow for more electrifying trade setups! 🚀 Your support powers our market raids, paving the way for precise wins. Let’s dominate BCH/USDT together! 🤝🏆🎉
**Stay Locked In**: Another heist plan’s brewing. Keep your charts ready, traders! 🐱👤😎
---
🔥 **Real-Time Data (May 17, 2025, UTC+1)** 🔥
- **BCH/USDT Price**: ~425.0 (based on aggregated exchange data).
- **COT Report (May 16, 2025)**: Institutional long positions in crypto futures up 12% WoW, per CFTC.
- **Sentiment**: 68% positive, Fear & Greed Index at 72 (Greed).
- **USD Index (DXY)**: Down 0.8% WoW, supporting altcoin strength.

Bitcoin update 17th of mayhope you enjoy my analysis! Bitcoin has a sustainable Pa as for now and i'm expecting a big break out shortly!

Bitwise Bitcoin ETF | BITB | Long at $46.25It definitely should get everyone's attention when a US Senator (David McCormick) is willing to dish out up to $600,000 in a Bitcoin ETF ( AMEX:BITB ):
Feb. 27: Bought $50,000 to $100,000
Feb. 28: Bought $15,000 to $50,000
March 3: Bought $50,000 to $100,000
March 5: Bought $15,000 to $50,000
March 10: Bought $50,000 to $100,000
March 11: Bought $15,000 to $50,000
March 13: Bought $15,000 to $50,000
March 20: Bought $50,000 to $100,000
Something may be brewing this year with the "U.S. crypto reserve" and I'll throw down a couple grand at $46.25 with a self-proclaimed wild prediction into 2026: Bitcoin to $120,000.
Bitwise ETF Targets:
$50.00
$55.00
$60.00
$65.00

Bitcoin Potential UpsidesHey Traders, in today's trading session we are monitoring BTCUSDT for a buying opportunity around 100,000 zone, Bitcoin is trading in an uptrend and currently is in a correction phase in which it is approaching the trend at 100,000 support and resistance area.
Trade safe, Joe.

Comprehensive BITCOIN Analysis for the next 7 days - DAILY chart
First Off - Sorry for all the lines on the chart but EVERY one is very relevant to what is happening right now.
The Dashed Blue Horizontal line is the current ATH line. possible Resistance.
The 2.618 Fib extension has not yet been tested as support. This could happen still, at any point till end of month and is around the 98K usd zone.
PA has Ranged through the Local rising line of support, as if it no longer existed, which was a little surprising given the strength that PA has still. There maybe some uncertainty in the air.
PA is above the neckline of the Cup pattern it printed and, again, it would not be unusual to see PA come back down to test this Neckline as support, which is on that 2.618 Fib extension.
The Bold Yellow line is Long Term Support line since 2015, showing that Bitcoin PA is in the Lower side of a Long Term ascending channel, with plenty of room to rise,
PA has a lot of inert strength right now, so, we may not see this retest happen.
We just have to wait.
BUT you can see that Rising dashed line, the extension of the Cup pattern.
PA may range across into this and bump into it next week. If it acts as support again, PA will then be pushed into a tight Squeeze against the other rising line of support, with an Apex on the current ATH line.
PA ALWAYS REACTS BEFORE THE APEX
All that points towards some Volatile times next week if PA remains in this area.
The other descending line there is a 618 Fib Circle. You can see that 98% of the Time, PA is effected by these.
All this shows us 4 points of resistance, in the same Zone, All Next week and PA will Either Shoot through it with a Big push, Or we may see PA Drop back down. The Big question being, how Far ?
We do not want to loose the 2.618 Fib ext at 98K
But what else can we look at. ?
The RSI DAILY
This is still up high in the near Over Bought zone. It can range up here for extended periods but this is something we should be aware of as the possibility of a drop does exist.
On the weekly, RSI has room to move higher & the 4 hour is in neutral zone, again with ability to push higher.
The MACD DAILY
This is once again curling over and about to test the red signal line as support.
On a 4 hour chart, the MACD is down on Neutral line, giving it strength to push higher and if that continues, we will see the yellow MACD line bounce off the Red signal line on the Daily chart.
Once again, Look at the Histogram and the similarity to the area that the Arrow is pointing at.
We could repeat this but on a larger scale. We have to wait and see if this happens.
But also note how there was a Visit into a red Histogram ( for 4 days ) before the bigger push and I remind you about what has been said above.
So, what else can we look at that may offer some ideas ?
The Chart below is the 4 main Crypto Dominance charts by market Cap - 4 hour
BTC.D - ETH.D
OTHERS.D - USDT.D
( OTHERS = Top 125 Coins MINUS Top 10 by Market Cap) Mid to Low cap
We have recently seen a Drop in Bitcoin dominance, giving the ALTS some time to push higher. This is seen with the BTC.D dropping and the ETH.D and OTHERS.D rising
Also note how USDT.D Dropped, showing that stable coins were being exchanged for Crypto,
And as we see now, we have the possibility of BTC.D being rejected by its 50 SMA ( Red)
ETH.D is above its 50 SMA, showing it had a good push and may get support if PA drops
OTHERS.D has already fallen below its 50 SMA, showing a brutal sell off, rapid profit taking.
That is the world of ALTS.
In the last 48 hours, we saw a return for Bitcoin as it rose from a shallow Low in its Range. This was enough to cause a sell off of the ALT coins as we see in the Drop in Others.D
ETH however, remains in a range with obvious intention to continue higher if the market allows.
Lastly, we can compare Bitcoin to the other Markets
Bitcoin - CFD GOLD
DXY - S&P500
Bitcoin has performed well. It has reclaimed some position on Gold recently while it climbed alongside the S&P
We can also see how BTC climbed while DXY dropped.
This highlights some Flaws in using the BTC USD pair to judge the success of BTC but this is explaned better in another post. But in short, If the $ looses Value and your BTC USD pair appears to climb, theg ain is lost as the $ is worth less.
Use BTC XAUT pairs. Bitcoin Gold Pair - Historically, GOLD looses little Value by comparison. So when Bitcoin gains against Gold..It is WIN WIN
So, in conclusion, we see Bitcoin under some pressure to avoid Lower or sharper Drop in the short tern.
The Lower Timeframes show us that BTC has the ability for a Continued Range but with caution.
We see ETH ( and larger Alts ) intent on remain in the game now they have had a small glimpse of Gains
And we see that Mid and Lower Cap Alts are mostly just money makers providing you play the game right. And that game may have some more time if Bitcoin Stumbles in the next 7 days.
And that possibility does exist.
Today is crucial in many ways and will set the tone for the following week.
There is Financial Data being released by the USA today and if unfavourable, we may see some sharp moves.
And ,Longer Term VERY BULLISH - I HOLD AND CONTINUE TO BUY WHEN I CAN ON SPOT ORDERS
I hope this helps and I am grateful for comments
BTC Strength Alert: Key Levels, Fibonacci & VolatilityBitcoin (BTCUSD) Strength Alert: Key Levels, Fibonacci & Volatility Point to Entry Opportunities
Bitcoin (BTCUSD) Technical Analysis: Navigating Strength and Volatility
Bitcoin (BTCUSD) continues to capture the attention of the global financial markets, demonstrating notable resilience and underlying strength. The current market structure suggests a period where bulls are actively defending key price thresholds, creating a fascinating technical landscape. This analysis will provide an in-depth examination of BTCUSD, focusing on its price action relative to significant psychological levels, the supportive role of Fibonacci retracements, characteristic volatility patterns, and strategic entry considerations based on bullish candlestick formations.
1. Introduction to Bitcoin and the BTCUSD Pair
Bitcoin, introduced in 2009, stands as the progenitor of cryptocurrencies, operating on a decentralized peer-to-peer network secured by cryptographic principles and recorded on a public distributed ledger known as the blockchain. It was designed as a digital alternative to traditional fiat currencies, free from central bank control. The BTCUSD pair represents the exchange rate between Bitcoin and the United States Dollar, making it one of the most liquid and heavily traded instruments in the digital asset space. Its price movements are a barometer for the broader cryptocurrency market sentiment and are influenced by a myriad of factors including adoption trends, regulatory news, macroeconomic developments, and technological advancements within the Bitcoin network itself. Understanding the technical dynamics of BTCUSD is crucial for traders, investors, and market analysts seeking to navigate its often-turbulent price swings.
2. Current Market Sentiment and Price Action: Holding Above Key Psychological Levels
A significant observation in the current BTCUSD market is its ability to maintain its footing above a key psychological price level. Such levels, often round numbers (e.g., $50,000, $60,000, or in this context, a hypothetical significant level like $100,000 if we assume a major bull run has occurred), act as important mental benchmarks for market participants. When price successfully breaks above such a level and subsequently holds it as support, it can signal a powerful shift in market sentiment. This behavior suggests that buyers are willing to step in and defend this new valuation, absorbing selling pressure and preventing a swift retracement.
The act of holding above a major psychological level often has a self-fulfilling prophecy component. As traders and algorithms identify this level as critical, buy orders tend to cluster around it, reinforcing its strength as a support zone. Conversely, if the price were to decisively break below such a level after holding above it, it could trigger a cascade of stop-loss orders and a rapid decline, indicating that the previous bullish conviction has waned. The current strength shown by Bitcoin in maintaining its position above such a noted psychological threshold is therefore a bullish indicator, suggesting underlying demand and a positive short-to-medium-term outlook, provided this support continues to hold. This resilience can build confidence among market participants, potentially attracting further capital inflow.
3. Fibonacci Retracement Analysis: Identifying Strong Support
Fibonacci retracement levels are a cornerstone of technical analysis, employed to identify potential areas of support and resistance. Derived from the Fibonacci sequence – a series of numbers where each number is the sum of the two preceding ones (0, 1, 1, 2, 3, 5, 8, 13, etc.) – the key retracement levels are 23.6%, 38.2%, 50%, 61.8%, and 78.6%. These percentages are applied to a prior price swing (from a significant low to a significant high in an uptrend, or vice-versa in a downtrend) to project areas where the price might pull back before resuming the primary trend.
The observation that Fibonacci retracement levels suggest strong support at current BTCUSD levels is particularly pertinent. When the market is in an uptrend and experiences a corrective pullback, traders watch these Fibonacci levels closely. The 38.2%, 50%, and 61.8% levels are often considered the most significant. A retracement to, and subsequent bounce from, one of these levels indicates that the correction is likely a healthy pause within a larger bullish trend, rather than a reversal.
If BTCUSD is currently finding support near a critical Fibonacci level, it implies that the preceding upward momentum was strong, and the current consolidation or minor pullback is being met with buying interest at a mathematically significant point. For example, if Bitcoin recently rallied from point A (low) to point B (high), and has now retraced to the 61.8% level of that rally and is holding, it's a classic sign that bulls are re-entering the market, viewing the pullback as a discounted buying opportunity. The confluence of a psychological level with a Fibonacci support level would create an even more potent support zone, significantly increasing the probability of a price bounce. Traders often look for candlestick confirmation at these Fibonacci levels before committing to a position.
4. Volatility Analysis: US Evening and Asian Morning Hours
Volatility is an inherent characteristic of Bitcoin, representing the degree of variation of its trading price series over time. The observation that BTCUSD volatility tends to increase during US evening and Asian morning hours is a valuable insight for strategic trade timing. This period typically corresponds to the overlap between the closing of the New York trading session and the opening of major Asian financial centers like Tokyo, Hong Kong, and Singapore.
Several factors contribute to this heightened volatility:
Market Overlap and Liquidity Shifts: As one major market winds down and another ramps up, there can be shifts in liquidity. The initial hours of the Asian session often bring fresh news, order flows, and participants, leading to price discovery and increased trading activity.
News Dissemination: Significant economic data releases, corporate earnings (for Bitcoin-related companies), or crypto-specific news from either the US (late announcements) or Asia can occur during these hours, directly impacting BTCUSD prices.
Algorithmic Trading: Many trading algorithms are programmed to react to specific inter-market conditions or news events, and their activity can amplify price movements during these transitional periods.
Derivatives Market Activity: The global nature of Bitcoin derivatives markets (futures, options) means that activity in these markets can influence spot prices around the clock. The US evening/Asian morning window sees active participation from traders in these regions.
For traders, this period of increased volatility presents both opportunities and risks. Opportunities arise from potentially larger price swings that can be capitalized upon with well-timed entries. Risks are elevated due to the potential for rapid price changes, which can trigger stop-losses or lead to slippage. Therefore, while these hours can be opportune for entry, they also demand heightened vigilance and robust risk management.
5. Entry Strategies: Volatility, Candlestick Patterns, and Timing
Leveraging the increased volatility during US evening and Asian morning hours for entry timing requires a methodical approach, primarily focusing on the confirmation provided by bullish candlestick patterns. Candlestick charts offer a visual representation of price movements and can signal shifts in market sentiment and potential reversals or continuations.
Key Bullish Candlestick Patterns for Entry Confirmation:
Hammer: Appearing after a downtrend, a Hammer is characterized by a small real body at the upper end of the trading range, with a long lower shadow (at least twice the size of the body) and little to no upper shadow. It indicates that sellers initially pushed prices down, but buyers stepped in strongly to drive prices back up near the open, suggesting a potential bottom and bullish reversal.
Inverted Hammer: Also a bottom reversal pattern, the Inverted Hammer has a small real body at the lower end of the trading range, a long upper shadow, and a short (or absent) lower shadow. It suggests that buyers attempted to push the price up, but sellers resisted. However, the fact that buyers showed strength is a tentative bullish sign, requiring further confirmation.
Bullish Engulfing: This is a powerful two-candle reversal pattern. The first candle is bearish (red/black), and the second candle is bullish (green/white) with a real body that completely "engulfs" the real body of the preceding bearish candle. It signifies that buying pressure has overwhelmed selling pressure.
Piercing Line: Another two-candle bullish reversal pattern seen after a downtrend. The first candle is a strong bearish candle. The second candle opens below the low of the first candle but then closes more than halfway up the real body of the first bearish candle. This indicates a significant shift in sentiment from bearish to bullish during the second candle's session.
Morning Star: A three-candle bullish reversal pattern. It begins with a long bearish candle, followed by a small-bodied candle (which can be bullish or bearish and ideally gaps down from the first candle), and then a long bullish candle that closes well into the body of the first bearish candle (ideally gapping up from the second candle). The small middle candle (the "star") represents indecision, and the strong bullish third candle confirms the reversal.
Three White Soldiers: This is a strong bullish continuation or reversal pattern consisting of three consecutive long-bodied bullish candles. Each candle should open within the body of the previous candle and close at or near its high, making progressively higher highs. It signals sustained buying pressure.
Strategic Entry Timing:
Monitor Volatile Periods: Be particularly attentive to price action during the US evening and Asian morning hours.
Identify Key Support: Note the psychological levels and Fibonacci retracement zones where BTCUSD is expected to find support.
Scan for Bullish Candlesticks: Look for the formation of one of the aforementioned bullish candlestick patterns (or others like Dojis at support, Bullish Harami) at or near these support levels during the identified volatile periods.
Seek Confirmation: Wait for the candlestick pattern to fully complete at the close of its period (e.g., end of the hour for an hourly chart). Some traders wait for the next candle to trade above the high of the bullish pattern for further confirmation.
Volume Analysis: Higher trading volume accompanying the formation of a bullish candlestick pattern adds to its reliability, indicating stronger conviction behind the buying pressure.
Context is Key: Bullish reversal patterns are most potent when they appear after a discernible pullback within a larger uptrend, or at the end of a consolidation phase near strong support.
By combining the timing advantage of predictable volatility spikes with the confirmation signals from bullish candlestick patterns at technically significant support levels, traders can refine their entry strategies for BTCUSD.
6. Other Key Technical Indicators for Comprehensive Analysis
While the core observations provide a strong foundation, incorporating other technical indicators can offer a more holistic view of BTCUSD's market dynamics:
Moving Averages (MAs): MAs smooth out price data to identify trend direction and potential support/resistance. The 50-day, 100-day, and 200-day SMAs (Simple Moving Averages) or EMAs (Exponential Moving Averages) are widely watched. Price trading above these MAs is generally bullish. Crossovers, like a "golden cross" (50-day MA crossing above the 200-day MA), are considered strong long-term bullish signals. Conversely, a "death cross" (50-day MA crossing below the 200-day MA) is bearish.
Relative Strength Index (RSI): This momentum oscillator measures the speed and change of price movements, ranging from 0 to 100. An RSI above 70 is often considered overbought (suggesting a potential pullback), while below 30 is oversold (suggesting a potential bounce). However, in strong trends, BTCUSD can remain in overbought or oversold territory for extended periods. Bullish or bearish divergences between price and RSI (e.g., price making a new high while RSI makes a lower high) can signal weakening momentum.
MACD (Moving Average Convergence Divergence): This trend-following momentum indicator consists of the MACD line and a signal line. A bullish crossover occurs when the MACD line crosses above the signal line, suggesting increasing upward momentum. A bearish crossover is the opposite. The MACD histogram visualizes the distance between the MACD and signal lines; a growing positive histogram is bullish.
Horizontal Support and Resistance Levels: Beyond Fibonacci, historical price action creates distinct support (price floor) and resistance (price ceiling) levels. These are areas where the price has previously reversed or consolidated. Identifying these levels on daily and weekly charts provides a broader map of potential turning points.
Trendlines and Channels: Drawing trendlines connecting successive lows (uptrend line) or highs (downtrend line) helps visualize the dominant trend. Price often respects these lines. Parallel trendlines can form channels, providing dynamic support and resistance boundaries. A break out of a well-established trendline or channel can signal a significant change in trend.
Volume Analysis: Trading volume is a critical confirming indicator. A price rally accompanied by increasing volume is generally seen as healthy and sustainable. Conversely, a rally on declining volume may indicate weakening conviction. Spikes in volume during breakouts above resistance or bounces from support add validity to the price move.
Integrating these indicators with the primary observations about psychological levels, Fibonacci support, and candlestick patterns during volatile periods can provide a more robust and nuanced trading framework.
7. Risk Management in Bitcoin Trading
The high volatility inherent in BTCUSD, while offering profit potential, also necessitates stringent risk management. Without it, traders expose themselves to significant losses. Key risk management practices include:
Stop-Loss Orders: Always define an exit point for a trade if it moves against you. A stop-loss order automatically closes a position when the price reaches a predetermined level, limiting potential losses.
Position Sizing: Determine the appropriate amount of capital to allocate to a single trade based on your overall portfolio size and risk tolerance. A common rule is to risk no more than 1-2% of trading capital on any individual trade.
Risk/Reward Ratio: Before entering a trade, assess the potential profit (reward) versus the potential loss (risk). Aim for trades where the potential reward is significantly greater than the risk (e.g., 2:1 or 3:1).
Diversification: While this analysis focuses on BTCUSD, traders should consider diversifying their overall crypto portfolio if they are investors, rather than concentrating all funds in one asset.
Emotional Discipline: Avoid making trading decisions based on fear (FUD - Fear, Uncertainty, Doubt) or greed (FOMO - Fear Of Missing Out). Stick to a well-defined trading plan.
8. Potential Future Outlook (Based on Technicals)
Based on the current technical posture where Bitcoin shows strength above a key psychological level and finds support at Fibonacci retracement zones, the outlook leans cautiously optimistic, contingent on these supports holding.
Bullish Scenario: If BTCUSD continues to respect these support levels, particularly during periods of consolidation, and bullish candlestick patterns during volatile US evening/Asian morning hours lead to upward impulses, further upside is likely. A sustained break above immediate overhead resistance, confirmed by volume, could see BTCUSD challenge its next major resistance zones and potentially trend towards new highs. The ongoing defense of psychological levels is paramount for this scenario.
Bearish Scenario: Should the identified support levels (psychological and Fibonacci) fail to hold, the outlook could shift. A decisive break below these supports, especially on increased selling volume, would indicate that sellers have gained control. This could lead to a deeper correction, targeting lower support structures and potentially invalidating the current bullish sentiment. Increased volatility during the US evening/Asian morning hours could, in this case, exacerbate downward moves if bearish patterns emerge.
9. Conclusion
The technical analysis of BTCUSD reveals a market displaying notable strength, characterized by its ability to hold above a significant psychological price point and find robust support at Fibonacci retracement levels. This underlying resilience is a positive sign for bulls. The tendency for volatility to surge during the US evening and Asian morning trading sessions presents strategic windows for traders, particularly when seeking entries confirmed by validated bullish candlestick patterns at these critical support junctures.
A comprehensive trading approach should also integrate other indicators like moving averages, RSI, MACD, and volume analysis to confirm signals and understand the broader market context. While the current technical setup suggests a favorable environment for bulls, the inherent volatility of Bitcoin demands disciplined risk management practices. Traders must remain vigilant, adapting their strategies to the evolving price action and ensuring that any bullish conviction is continuously validated by the market's behavior at these key technical inflection points. The interplay between these technical elements will be crucial in determining BTCUSD's trajectory in the near to medium term.

BTCUSDT, We are in Up TrendHello everyone
According to the chart that you can see the price movement was moved exactly to the route the we analysed and shown weeks ago and according to this time , that analysed is valid
If you need some help you can send us messages
Good Luck
AA
BTCUSD; Heikin Ashi IdeaBINANCE:BTCUSD
Possible continuation at marked area, or we will have a correction to lower daily demand area where impulsive move started.

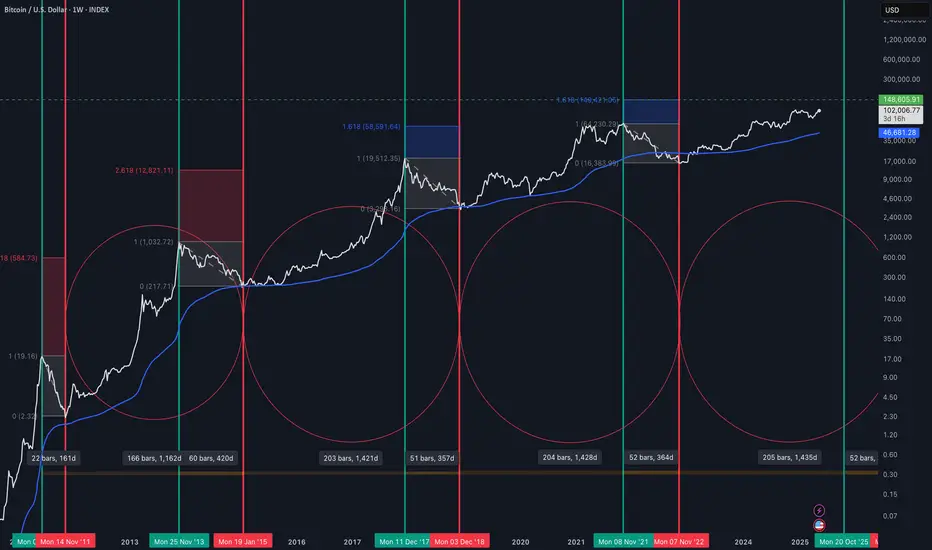
Bitcoin SeasonalitySince 2013, the distance between each Bitcoin bottom and peak is approximately 205 weeks. Similarly, the distance between the peak and the bottom is approximately 52 weeks. In addition, when the Fibonacci correction is applied to each bear season, the new target appears to be the 1.618 region, so Bitcoin currently has the potential to run to 148k. As long as seasonality continues, the peak will come at the end of 2025.
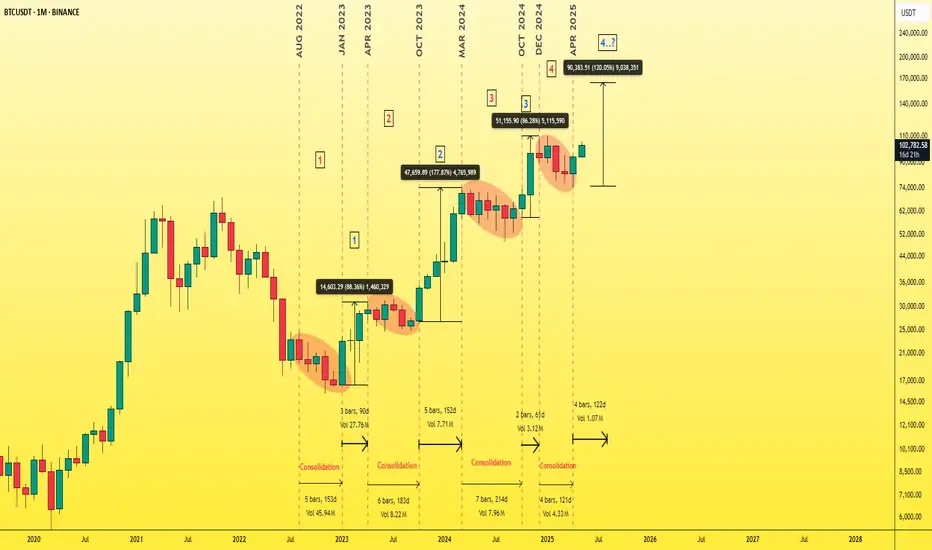
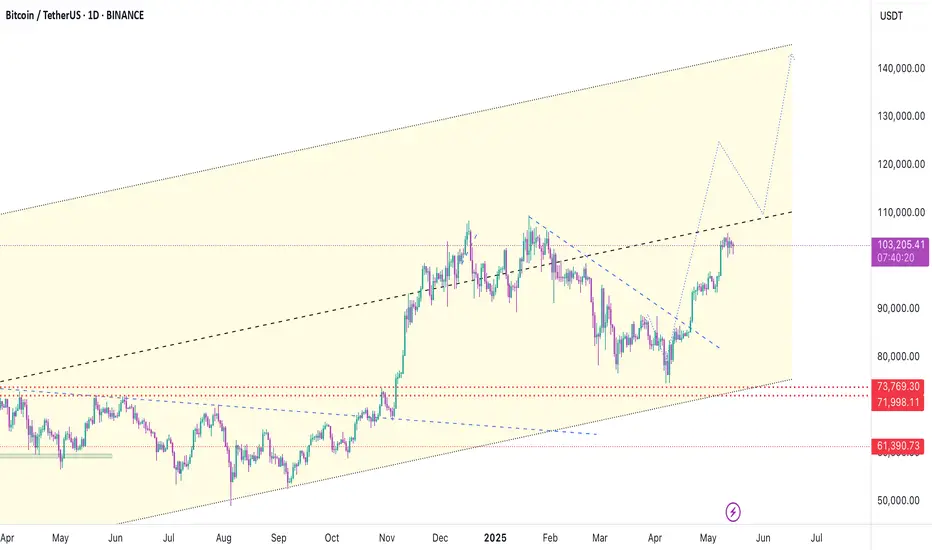
Bitcoin - An unusual chart!Over the past 3 years, I’ve noticed that Bitcoin has been moving in a consistently bullish pattern, as shown on the chart.
After breaking out of the red ellipse shape, Bitcoin tends to rally strongly—and that’s usually the signal for altcoins to follow. We’ve now broken out of this ellipse, and it looks like the real bullish move is just beginning.
In this chart, I’ve tried to illustrate both the potential upside ahead of us and the estimated timeframe in which this move could unfold.
I’ve divided the chart into segments from August 2022 to April 2025.
🔸The red numbers 1, 2, 3, 4 indicate periods of consolidation.
🔸The blue numbers 1, 2, 3, 4 represent strong Bitcoin and altcoin rallies that follow the breakouts.
While the exact percentage gains and time durations may vary, if we take the average, we can estimate the upcoming move to be around 120%, taking Bitcoin to around $165K.
Similarly, the average time duration for each bullish move has been approximately 120 days.
[b ]Welcome to the bull market.
Best Regards Ceciliones 🎯