Bitcoin Testing Resistance Near $95K – Key Levels to WatchBitcoin is currently consolidating just below the $95,000 resistance after a strong move from the FWB:83K region. Price is hovering near the upper range of a key supply zone, with the Bull Market Support Band flipping to potential support around $90,500. A clean breakout above $95K could open the door toward the psychological $100K level, while a rejection might lead to a retest of the $90K or even GETTEX:87K zones. Watching closely for confirmation of either breakout or reversal in the coming sessions.
Bitcoinprice

BTC -- Best Zone to Long NOw..As per the previous post i have shared with you hours ago, the BTC has exactly broken down the channel inorder to grab grab the liquidity .
This is the only place we can look for LONG as the risk is very limited.
Check out how things play at 93000 zone.
If breaks, then 98000 confirmed

Bitcoin Testing 95k as Resistance TRENDLINE #Bitcoin at a CRITICAL juncture! Testing the downward trendline (double yellow) at 95K as resistance, originating from 107K in Dec.
This trendline has repeatedly rejected BTC, with multiple tests at 95K this week. Historically, rejections have led to drops to 82K support (tested 4x) or even the uptrend line at 77K (Mar/early Apr).
If BTC fails to break & hold above 95K by week's close, we may retest 82K on the 2023 uptrend (red line). BUT, if we break 95K and hold, we could target 109K, with a potential range of 125K-140K for new highs!
#Crypto #BTC #TechnicalAnalysis

My view for BTCThis is my view for BTC.
This baby is currently fighting the 95K zone.
A break form this zone might send this asset to $100K, and eventually the ATH (ALL TIME HIGH) ZONE OF $108k
Look at the W-pattern which ids also a bullish reversal pattern

Bitcoin's Crossroads: Golden Cross Signals, Capital Floods In
The Bitcoin narrative is rarely static. It oscillates between fervent optimism and deep skepticism, driven by a complex interplay of technical patterns, on-chain data, macroeconomic shifts, and evolving investor perceptions. Recently, several compelling signals have converged, painting a picture of a market potentially at a significant juncture. A rare "Golden Cross" technical pattern has formed, an event often associated with the start of major bull cycles. Simultaneously, on-chain data reveals a surge in "hot supply," indicating a significant influx of new capital and heightened market activity. Adding another layer, Bitcoin demonstrated surprising resilience and relative strength against traditional assets like gold and tech stocks during recent market turbulence, exhibiting an unusually low beta that hints at potential maturation.
This confluence of technical momentum, fresh capital inflow, and changing market behavior warrants a deep dive. What exactly is the Golden Cross, and what does its appearance portend for Bitcoin? How should we interpret the nearly $40 billion in "hot supply," and what risks and opportunities does this influx of potentially newer, less experienced capital present? And critically, does Bitcoin's recent outperformance and low correlation signal a fundamental shift in its role within the broader financial landscape? This article will dissect these interconnected developments, exploring their historical context, potential implications, and the inherent uncertainties that always accompany the world's leading cryptocurrency.
Decoding the Golden Cross: A Technical Harbinger?
Technical analysis (TA) is a cornerstone of trading in many markets, including cryptocurrency. It involves studying past price action and volume data to identify patterns and trends that might predict future movements. One of the most widely recognized and discussed bullish signals in TA is the "Golden Cross."
• What is a Golden Cross? A Golden Cross occurs when a shorter-term moving average (MA) of an asset's price crosses above a longer-term moving average. The most commonly watched Golden Cross involves the 50-day simple moving average (SMA) crossing above the 200-day SMA.
o The 50-day SMA reflects the average closing price over the last 50 trading days, representing recent momentum.
o The 200-day SMA reflects the average closing price over the last 200 trading days, representing the longer-term underlying trend.
• Traditional Interpretation: When the faster-moving 50-day MA overtakes the slower 200-day MA, it suggests that recent price momentum is strengthening significantly relative to the long-term trend. Technicians interpret this as a potential confirmation that a bottom may be in, and a new, sustained uptrend could be starting. It's often seen as a lagging indicator (confirming a trend already underway) but one that can signal the potential for significant further upside. Conversely, the opposite pattern, where the 50-day MA crosses below the 200-day MA, is known as a "Death Cross" and is considered a bearish signal.
• The "Once Per Cycle" Phenomenon: The claim that this specific Golden Cross (50-day crossing 200-day) happens "once every cycle" for Bitcoin generally refers to its appearance after major bear market bottoms and preceding significant bull runs in Bitcoin's roughly four-year halving cycles. Historically, looking back at Bitcoin's chart, these crosses have indeed often preceded periods of substantial price appreciation. For example, Golden Crosses occurred in 2012, 2015, 2019, and 2020, each preceding major bull markets, albeit with varying time lags and magnitudes.
• Historical Performance and Caveats: While historically bullish for Bitcoin, the Golden Cross is not an infallible predictor.
o Lagging Nature: By the time the cross occurs, a significant portion of the initial rally off the bottom may have already happened.
o False Signals: Markets can experience "whipsaws," where a Golden Cross forms briefly only to reverse into a Death Cross shortly after, trapping overly eager bulls. This was seen briefly in some shorter timeframes or even on the daily chart during choppy periods in Bitcoin's history.
o Context Matters: The broader market environment, macroeconomic factors, and fundamental developments play crucial roles. A Golden Cross during a period of intense regulatory crackdown or global recession might not have the same impact as one occurring during quantitative easing and growing institutional interest.
o Confirmation Needed: Traders often look for confirmation signals after a Golden Cross, such as sustained price action above the moving averages, increasing volume, or bullish follow-through patterns.
What to Expect from the Golden Cross?
The formation of a Golden Cross on Bitcoin's daily chart is undeniably a positive technical development that captures market attention. It suggests underlying strength and improving medium-term momentum. Historically, it has often marked the transition from a bear market recovery phase to a more sustained uptrend.
However, expectations should be tempered with caution. It's a signal, not a guarantee. It indicates potential but requires confirmation through continued price strength and favorable market conditions. Relying solely on this pattern for investment decisions is risky. It should be considered alongside other factors – on-chain data, fundamental developments, and macroeconomic context – to form a more complete picture. The most reasonable expectation is that the Golden Cross increases the probability of further upside but doesn't eliminate the possibility of consolidation, pullbacks, or even failure of the nascent uptrend.
The Heat is On: Understanding the Surge in 'Hot Supply'
While technical analysis looks at price charts, on-chain analysis delves into the activity happening directly on the Bitcoin blockchain, providing insights into investor behavior and capital flows. A key metric highlighted recently is the rise of "Bitcoin hot supply."
• What is 'Hot Supply'? "Hot Supply" typically refers to Bitcoin that has been moved on the blockchain relatively recently, often within the last few months (definitions can vary slightly between analytics platforms, e.g., coins moved within the last 1-3 months or sometimes up to 6 months). These coins are considered "hot" because they are more likely to be involved in active trading or spending, as opposed to "cold" supply held in long-term storage (often associated with HODlers). It represents the portion of the Bitcoin supply that is more liquid and actively circulating.
• Nearing $40 Billion: The fact that this hot supply is nearing a value of $40 billion is significant. It indicates a substantial amount of Bitcoin changing hands and reflects a "surge in capital turnover," as described in the analysis. This suggests heightened market activity, increased liquidity, and, crucially, the entry of new participants or the reactivation of dormant capital.
• New Investors Flooding In (at High Prices?): The analysis explicitly links this surge to new investors and speculators taking an interest, likely attracted by Bitcoin's recent price recovery and multi-month highs. The mention of "$95K" (even if potentially a typo or hypothetical peak target in the source analysis) symbolizes the risk that many of these new entrants might have acquired Bitcoin at relatively elevated prices compared to the cycle lows. This creates a cohort of investors with a higher cost basis.
• Implications of High Hot Supply:
o Increased Liquidity: More coins moving means more potential buyers and sellers, which can facilitate smoother price discovery and larger trades.
o Fuel for Rallies: An influx of new capital provides buying pressure that can sustain upward price momentum. Speculative interest often feeds on itself in bull markets.
o Increased Volatility: Coins held by newer entrants or short-term speculators are often considered "weaker hands." These holders may be more susceptible to panic selling during price dips or quick profit-taking during rallies, potentially leading to sharper price swings in both directions.
o Potential Overhead Supply: If the price stalls or reverses, the large volume of coins acquired at recent highs ( SGX:40B worth moved recently) represents potential selling pressure as these holders seek to break even or cut losses.
Interpreting the Influx:
The surge in hot supply is a double-edged sword. On one hand, it confirms growing interest and provides the necessary capital flow to potentially validate the bullish signal from the Golden Cross. New demand is essential for sustained price increases. On the other hand, it introduces a layer of fragility. The market's ability to absorb potential selling from these newer, higher-cost-basis holders during inevitable corrections will be a key test of the underlying strength of the current trend. Monitoring whether this "hot supply" gradually cools down (moves into longer-term holding) or remains elevated will be crucial in the coming months.
Bitcoin's Relative Strength: Outshining Gold and Tech Amid Turmoil
Beyond technicals and on-chain flows, Bitcoin's performance relative to traditional assets, especially during periods of market stress, offers valuable insights into its evolving perception. The observation that Bitcoin outperformed both gold (a traditional safe-haven) and tech stocks (risk-on assets) in April, particularly amidst "tariff turmoil" or other geopolitical/economic uncertainties, is noteworthy.
• Challenging Correlations: Historically, Bitcoin often traded with a high correlation to risk assets like tech stocks, particularly during market downturns. Investors tended to sell Bitcoin alongside equities during risk-off periods. Gold, conversely, often acts as a safe haven, rallying during uncertainty. Bitcoin outperforming both simultaneously suggests a potential breakdown in these typical correlations, at least temporarily.
• Why the Outperformance? Several factors could contribute:
o Unique Drivers: Bitcoin's price is influenced by factors unique to its ecosystem, such as halving cycles, adoption news, regulatory developments, and flows into new instruments like spot ETFs. These can sometimes override broader market trends.
o Inflation Hedge Narrative: Persistent inflation concerns may lead some investors to seek alternatives to fiat currency, benefiting both gold and Bitcoin, but perhaps Bitcoin more so due to its perceived higher growth potential.
o Safe-Haven Experimentation: While gold remains the established safe haven, some investors might be tentatively allocating a small portion to Bitcoin as a potential alternative store of value or hedge against systemic risk, especially if they perceive traditional systems as vulnerable.
o Decoupling Narrative: Some proponents argue that Bitcoin is increasingly decoupling from traditional markets as it matures and establishes itself as a distinct asset class. The recent performance could be seen as evidence supporting this view.
o Coincidence/Timing: It's also possible that the timing was coincidental, with Bitcoin-specific catalysts driving its price higher while unrelated factors weighed on gold and tech stocks during that specific period.
Significance of Relative Strength:
Demonstrating strength during periods when traditional assets are struggling enhances Bitcoin's appeal. It challenges the simplistic "risk-on only" label and suggests it might offer diversification benefits. If this pattern persists over longer periods and across different market stressors, it could significantly bolster the case for Bitcoin's inclusion in traditional investment portfolios.
Maturation Signal? The Low Beta Phenomenon
Closely related to relative strength is the concept of beta. Beta measures the volatility or systematic risk of an asset compared to the overall market (often represented by an index like the S&P 500).
• Beta Explained:
o A beta of 1 indicates the asset's price tends to move with the market.
o A beta greater than 1 indicates the asset is more volatile than the market.
o A beta less than 1 indicates the asset is less volatile than the market.
o A beta of 0 suggests no correlation.
• Bitcoin's Historically High Beta: Traditionally, Bitcoin has exhibited a high beta, especially relative to equity markets. It was often seen as a high-volatility asset that amplified broader market moves, particularly to the downside during risk-off events.
• Recent Low Beta Observation: The finding that Bitcoin displayed an "unusually low beta during recent market stress" is significant. It implies that its price movements were less correlated with, and potentially less volatile than, the broader market during that period of turbulence.
• Implications of Low Beta:
o Maturation Narrative: A lower, less correlated beta is often characteristic of more mature assets or distinct asset classes. It suggests investors might be viewing Bitcoin with a longer-term perspective, less prone to knee-jerk selling based on short-term fluctuations in other markets.
o Diversification Potential: Assets with low correlation to traditional portfolios (like stocks and bonds) are valuable for diversification, as they can potentially reduce overall portfolio volatility. A sustained low beta would strengthen Bitcoin's diversification credentials.
o Shift in Holder Base?: It could indicate a shift towards more institutional and long-term holders who are less reactive to daily market noise compared to purely retail speculators.
o Store of Value Aspirations: While still highly volatile compared to traditional stores of value like gold, a decreasing beta could be interpreted as a tentative step towards fulfilling some store-of-value properties, particularly if it holds value better than risk assets during downturns.
Is it Sustainable?
While the recent low beta is an encouraging sign for Bitcoin bulls and proponents of its maturation narrative, it's crucial to question its sustainability. Was it a temporary anomaly driven by specific market conditions in April, or does it represent a durable shift? Bitcoin's correlation and beta have fluctuated throughout its history. Renewed market panic, significant regulatory shocks, or major shifts in macroeconomic policy could potentially cause correlations to snap back. Continued observation across different market environments is needed to determine if this low beta is a new regime or a fleeting characteristic.
Synthesizing the Signals: A Complex Tapestry
Bringing these threads together – the Golden Cross, the surge in hot supply, relative outperformance, and low beta – reveals a complex and somewhat contradictory picture:
1. Technical Momentum Meets New Money: The Golden Cross provides a technically bullish backdrop, potentially encouraging more participants. The SGX:40B in hot supply confirms that new capital is entering, providing the fuel that could validate the technical signal.
2. Speculation vs. Maturation: The influx of hot supply points towards increased speculation and potentially "weaker hands." Yet, the low beta and relative outperformance during stress hint at underlying strength and potential maturation, suggesting a core base of holders is becoming less reactive. This highlights the heterogeneous nature of the Bitcoin market, with different investor cohorts exhibiting different behaviors simultaneously.
3. Opportunity and Risk: The convergence creates both opportunity and risk. The opportunity lies in the potential for the Golden Cross and new capital to ignite a sustained rally, further bolstered if Bitcoin continues to act as a diversifier (low beta). The risk lies in the potential fragility introduced by the high volume of recent entrants (hot supply) who might capitulate during dips, potentially invalidating the Golden Cross and reversing the low beta trend.
The current environment suggests Bitcoin is navigating a transition. The technicals point upwards, fresh capital is flowing in, and its behavior relative to traditional markets is showing intriguing signs of change. However, the presence of significant "hot" money serves as a reminder that volatility and sharp corrections remain distinct possibilities.
Overarching Risks and Necessary Caveats
Despite the positive signals, numerous risks persist:
• Technical Analysis is Not Predictive: The Golden Cross is a historical pattern, not a crystal ball. It can fail.
• 'Hot Supply' Risk: A large cohort of investors with a high cost basis can become a source of significant selling pressure if sentiment shifts.
• Macroeconomic Headwinds: Persistent inflation, rising interest rates (globally), geopolitical conflicts, or a global recession could dampen appetite for risk assets, including Bitcoin.
• Regulatory Uncertainty: While spot ETFs marked progress, the global regulatory landscape for crypto remains fragmented and uncertain. Unexpected crackdowns remain a threat.
• Correlation Risk: The low beta and decoupling narrative could prove temporary. Bitcoin could easily recouple with risk assets during a broader market panic.
Conclusion: Bitcoin at an Inflection Point?
Bitcoin currently stands at a fascinating crossroads, illuminated by a confluence of compelling, albeit sometimes conflicting, signals. The rare Golden Cross offers a technically bullish omen, suggesting underlying momentum is shifting favorably for a potential long-term uptrend, echoing patterns seen in previous cycles. This technical optimism is fueled by tangible evidence of renewed interest, with nearly $40 billion in "hot supply" indicating a significant surge in capital turnover and the arrival of fresh speculative and investment capital.
Simultaneously, Bitcoin's recent behavior exhibits intriguing signs of potential maturation. Its ability to outperform traditional safe havens like gold and risk assets like tech stocks during periods of market stress, coupled with an unusually low beta, challenges its historical "risk-on only" profile. This suggests a growing base of investors may be viewing it through a longer-term lens, potentially as a unique store of value or a portfolio diversifier, less swayed by short-term market noise.
However, this complex picture demands caution. The very influx of capital that fuels optimism also introduces fragility, as newer entrants with higher cost bases may be quicker to sell during downturns. The Golden Cross, while historically significant, remains a lagging indicator with no guarantee of future success. And the low beta, while encouraging, could prove ephemeral in the face of severe macroeconomic shocks or shifts in market sentiment.
Ultimately, Bitcoin's trajectory towards 2030 and beyond will depend on its ability to navigate these dynamics. Can it convert the current technical momentum and capital influx into a sustainable trend? Will its utility and adoption grow sufficiently to solidify its role beyond pure speculation? Will it continue to carve out a unique space in the financial ecosystem, proving its resilience and diversification benefits across various market conditions? The current signals suggest the potential is there, but the path forward remains intrinsically linked to broader economic forces, regulatory evolution, and the ever-unpredictable psychology of the market. Bitcoin is flashing signs of both renewed vigor and evolving character, making the coming months and years critical in defining its future role.

Bitcoin Month end approachs and THIS is where we are- Cross Road
As we end April, we can see a similar size candle to the one we saw in April 2017 and, if we are still following the 2013 - 2017 Fractal ( even if a little loosely now) then we can expect the next Few months to lead to the Next ATH.
However, as explained in the previous post about the Long Term Resistance Arc and how we may be in the Closing stages of the First Bitcoin Cycle, the over head resistance is STRONG ( dashed Arc )
These 2 lines of resistance at around 109K usd form an intersection and this is with little doubt the point to try and break through. Historically, BTC PA has tried to aim towards intersections of Trendlines when they have strength
So, This is what I am expecting for MAY but I will explain this in more detail in the montlly Candle Colour post in a couple fo days
What to expect
The April candle Will close GREEN and we now need a Green MAY candle and this MAY candle needs to break over the dotted Threshold line, as it did in May 2017
And we have to wait and see if that happens

Bitcoin $45k in 45 Days. Believe it or Watch It!Sometime people don't believe predictions because they need proof. Watch and learn people. Don't get caught holding the bag. Just ride the waves. No ema no alerts just market structure. I trade for fun and accuracy. This is a discipline sport so please watch and act accordingly. But this will play out exactly as expected. Go USA! #blackrock

BITCOIN BUY !!!Hello friends✌
As you can see in the picture, we have specified a purchase range for you to buy in stages, of course with capital and risk management.
🙏If you like it, support it with a ✔like✔ and ✔comment✔.
*Trade safely with us*

Bitcoin Bullish for ShortermBitcoin currently trade around $93,911 having broken resitance above $88,000-$89,000 zone. The breakout, supported by strong volume, positions Bitcoin favorably for further gains, although a short-term pullback appears likely.
Technical indicators remain bullish:
Price holds above the 21-EMA and 30-SMA, both beginning to slope upward.
Quarterly VWAP levels at $89,485 and $84,484 provide strong support.
The Volume Profile suggests heavy buyer interest around $84,000–$86,000.
A minor retracement toward $88,000–$89,000 could precede a consolidation phase before Bitcoin targets $96,000 and eventually the psychological $100,000 mark.
Bitcoin remains in a strong position. Tactical patience and disciplined risk management will be key to capitalizing on the next major move.

AI predict BTC\USD price, Unbelievable, Check This Out?BTC / USD. COINBASE. Apr 27, 2025 5:07 pm. BTC / USD. Comprehensive BTC/USD Trading Analysis & Strategy (April 25–27, 2025)
(All timestamps in ISO 8601 UTC)
---
I. Core Trend & Key Price Dynamics
1. Macro Trend:
- Mild Bullish Bias (+0.72% net gain) with extreme intraday volatility.
- Critical rejection at 95,500 resistance (tested on `2025-04-25T14:45:00Z`) and firm support at 93,000.
2. Volatility Clusters:
- High Volatility Phase:
- `2025-04-25T14:00–15:30Z`: Price swung between 94,440–95,564 with volume spikes (>750).
- Low Volatility Phase:
- `2025-04-27T00:00–20:00Z: Range tightened to 94,000–95,000, volume declined.
3. Pivotal Events:
- Bullish Breakout Failure: Sharp rejection at 95,564.90 (`2025-04-25T14:45Z`) led to consolidation.
- Bearish Engulfing Candle: At `2025-04-25T14:15Z` (volume: 846.26), signaling short-term top.
---
II. Multi-Indicator Convergence
| Indicator | Bullish Signals | Bearish Warnings |
|----------------------|---------------------------------------------|-----------------------------------------------|
| RSI 14 | Recovery from 40.79 (oversold) to 68.69 | Divergence at 61.24 as price rose (20:00Z) |
| CMF 20 | Surge to +0.428 (buying pressure, 17:45Z) | Drop to +0.056 (profit-taking, 20:00Z) |
| Supertrend | Bullish flip at 93,825.89 (18:30Z) | Flattening near 94,010.86 (indecision) |
| EMA 9 | Price sustained above EMA 9 (~94,300) | Failure to hold risks breakdown |
| Bollinger Bands | Breakout above upper band (94,191, 18:00Z) | Overextended near 94,540 (mean reversion risk)|
| MACD | Bullish crossover (17:45Z), peak at 47.61 | Histogram decline to 34.98 (momentum fade) |
| Stochastic RSI | Overbought (Fast K=100, 18:30Z) | Bearish divergence (Fast K=83.56 at 20:00Z) |
---
III. Strategic Trade Setups
A. Bullish Scenario (Confirmation Needed)
1. Entry:
- Break & Close Above 95,500 with volume >800.
- Retest of EMA 9 (~94,300) with RSI >50 and CMF >0.
2. Targets:
- 96,000 (psychological level), 97,500 (Fibonacci extension).
3. Stop-Loss:
- Below Supertrend (93,825) or 93,000 support.
B. Bearish Reversal (Caution Signs)
1. Entry Triggers:
- Close Below 94,000 with CMF <0 and RSI <50.
- MACD Bearish Crossover + Stochastic K/D cross below 80.
2. Targets:
- 93,000 (support), 91,500 (volume gap from 25th).
3. Stop-Loss:
- Above Bollinger Upper Band (94,540) or 95,500.
C. Neutral/Consolidation Play
- Range Trade: Fade extremes near 94,000–95,500.
- Stop-Loss: 1% outside the range.
---
IV. Critical Risk Factors
1. Divergence Risks: Bearish RSI/MACD/Stochastic divergences suggest upside exhaustion.
2. Volume Confirmation Needed: Bullish momentum requires volume >750 to sustain breaks.
3. External Catalysts: Watch for macro news (Fed policy, ETF inflows) around key timestamps.
---
V. Real-Time Alert Levels
| Level | Type | Significance |
|------------------|-------------|--------------------------------------------------|
| 95,500 | Resistance | Previous swing high; breakout invalidates bearish structure. |
| 94,300 | Support | EMA 9 dynamic support; loss opens path to 93,825. |
| 93,000 | Strong Support | Macro swing low; breakdown triggers panic selling. |
---
Final Outlook
- Short-Term (24–48h): Neutral-bullish with caution at resistance.
- Medium-Term (3–5d): Direction hinges on closing above 95,500 or below 93,000.
Immediate Action: Tighten stop-losses, book partial profits near 95,500, and await volume-backed breakout/breakdown.
(Indicators and price action analyzed in UTC timestamps for precision.) Disclaimer: This is not financial advice. Crypto markets are highly volatile and speculative. Always do your own research and consult a qualified financial advisor before investing. You could lose your entire investment.

Bitcoin Following 2013-2017 Fractal UPDATE for APRIL- looks GOODInitially we can see we got the expected bounce in approximatly the are we expected it due tot he MACD reaching the bounce zone near Neutral.
Currently, PA is hoovering around the Marker near the Circle.
I did expect that to take longer and so the PA would be within the circle but I am not complaining
As it stands of today. we may still see PA reach that circle as the Daily chart shows.
Shoudl PA range across, it would take 1 whole month to reach the centre. I would be surprised if that happens as Weekly MACD is only just returning to BULLISH and the Daily still has plenty of Room to conintue its bullish climb.
BUT, and I do mean this seriously, We could see a reversal and return to Bearish still.
This has happened before
So, Lets remain cautious for now, even though we are near the Neutral line and sentiment predicts a further push higher, Caution is the better part of Valor.
But on the Longer Term, Which Path are we taking >?
We have begun rising right between the two options and, so for now, I am inclinded to Favour the Dashed Arrow that points to a 250K ATH.
And to many extents, this will still follow the Fractal, even if we are now below....
The amount of Money required to push Bitcoin up into the Bold Arrows Path and Get PA back ontop of the Fractal is truly Eye watering.
But I will Always say Never say Never.
Bitcoin is on a Cross roads. As I have mentioned in other posts, PA is under a VERY Long Term line Arc of resistance right now.
The chart for this is beow. this is a rough version but clearly shows the problem
To break over this, we need to Pass and remain above 118K USD
On the Fracta, this region os part of a Sustained push higher, as PA would normaly do in an area of High resistance...To Break through.
And we are sitting Just below this point right now....With the ability to push through
We have to wait and see which arrow we follow....My bet ois on the dashed for now....
Time will always tell us.....
Stay safe everyone.....

BTCUSD BEARISHMy calculations find that this asset, will indeed drop to the indicated price in coming days or weeks. This move will be overwhelmingly bearish.

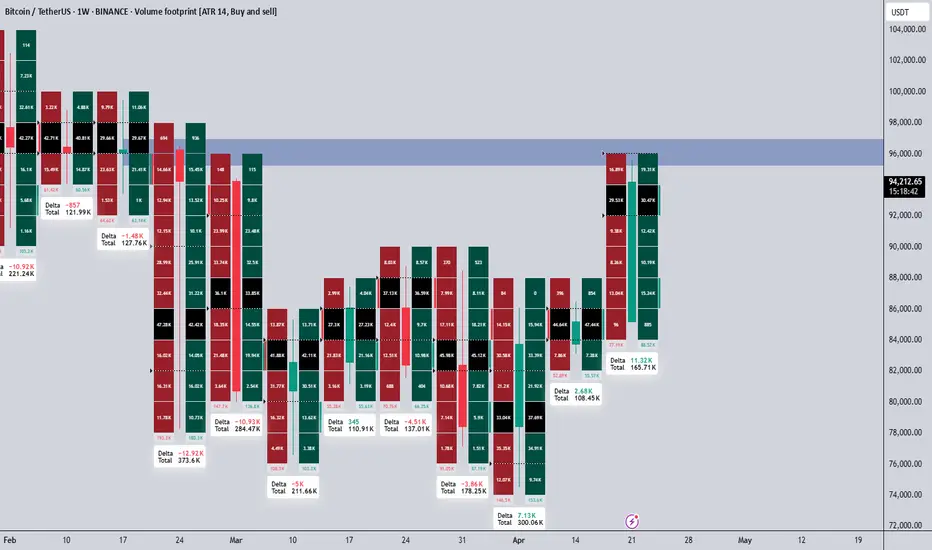
Market Recap | Last Week's Data Still Positive but Stay AlertLast week's data continues to paint a positive picture for the markets. Buyers are still clearly active based on the momentum we've observed. However, it's crucial to remember that markets are dynamic, and what looks strong today can shift quickly depending on upcoming news and developments.
📊 What the Data Tells Us:
Buyers are in control. Demand has been supporting the price across key levels, preventing deeper pullbacks.
Momentum remains bullish for now, but there’s a sense of caution creeping in as traders anticipate next week's news releases.
No major cracks yet, but we cannot afford to be complacent. Smart traders always stay flexible.
⚡ What's Next?
Until fresh news hits the market, buyers have the upper hand. But remember: your biggest strength is adaptability. Stay ready to pivot if next week’s developments shift sentiment.
Trust the data, but always respect the changing nature of the market. Confidence is good, but awareness is better.
📌I keep my charts clean and simple because I believe clarity leads to better decisions.
📌My approach is built on years of experience and a solid track record. I don’t claim to know it all but I’m confident in my ability to spot high-probability setups.
📌If you would like to learn how to use the heatmap, cumulative volume delta and volume footprint techniques that I use below to determine very accurate demand regions, you can send me a private message. I help anyone who wants it completely free of charge.
🔑I have a long list of my proven technique below:
🎯 ZENUSDT.P: Patience & Profitability | %230 Reaction from the Sniper Entry
🐶 DOGEUSDT.P: Next Move
🎨 RENDERUSDT.P: Opportunity of the Month
💎 ETHUSDT.P: Where to Retrace
🟢 BNBUSDT.P: Potential Surge
📊 BTC Dominance: Reaction Zone
🌊 WAVESUSDT.P: Demand Zone Potential
🟣 UNIUSDT.P: Long-Term Trade
🔵 XRPUSDT.P: Entry Zones
🔗 LINKUSDT.P: Follow The River
📈 BTCUSDT.P: Two Key Demand Zones
🟩 POLUSDT: Bullish Momentum
🌟 PENDLEUSDT.P: Where Opportunity Meets Precision
🔥 BTCUSDT.P: Liquidation of Highly Leveraged Longs
🌊 SOLUSDT.P: SOL's Dip - Your Opportunity
🐸 1000PEPEUSDT.P: Prime Bounce Zone Unlocked
🚀 ETHUSDT.P: Set to Explode - Don't Miss This Game Changer
🤖 IQUSDT: Smart Plan
⚡️ PONDUSDT: A Trade Not Taken Is Better Than a Losing One
💼 STMXUSDT: 2 Buying Areas
🐢 TURBOUSDT: Buy Zones and Buyer Presence
🌍 ICPUSDT.P: Massive Upside Potential | Check the Trade Update For Seeing Results
🟠 IDEXUSDT: Spot Buy Area | %26 Profit if You Trade with MSB
📌 USUALUSDT: Buyers Are Active + %70 Profit in Total
🌟 FORTHUSDT: Sniper Entry +%26 Reaction
🐳 QKCUSDT: Sniper Entry +%57 Reaction
📊 BTC.D: Retest of Key Area Highly Likely
📊 XNOUSDT %80 Reaction with a Simple Blue Box!
📊 BELUSDT Amazing %120 Reaction!
I stopped adding to the list because it's kinda tiring to add 5-10 charts in every move but you can check my profile and see that it goes on..
Bitcoin(BTC/USD) Daily Chart Analysis For Week of April 25, 2025Technical Analysis and Outlook:
Bitcoin experienced a significant rally in this week's trading session, breaking through all identified Mean Resistance levels: 86400, 90600, and 94500. This breakout led to the completion of the Interim Coin Rally at 88400. As a result, the newest identified Interim Coin Rally at 95000 has also been completed, indicating a possible pullback to the Mean Support at 92000 and a further decline potential toward an additional Mean Support target at 88500. However, it's important to recognize the chance of upward momentum emerging from a retest of the completed Interim Coin Rally at 95000, which could advance toward the next Interim Coin Rally at 100000.

Bitcoin "Crash" 2025Bitcoin started a more significant correction recently, which is scaring many people, and there is already a lot of talk about the beginning of the Bear market.
In my view, the upward trend is still intact, and this could very well be a healthy correction to prepare for a more significant rise in the coming months.
We have an important support level at $75K which has confluence with the 3D SMMA which has already proven to be strong in the past, I think there will be some reaction and that could very well be the end of this correction, but as long as the price manages to stay above $70K I will remain bullish and looking for Longs.
It is important to note that the Fear and Greed indicator is at 21, with Bitcoin at $84K.

Bitcoin (BTC/USD) - Cup and Handle Breakout🔍 Pattern Identified: Cup ☕ & Handle 🏆 Pattern
🕒 Timeframe: 1-Hour Chart (1H)
💥 Breakout Level: Around $95,000
🎯 Projected Target: $97,073.75
📈 Technical Overview:
Bitcoin formed a rounded cup showing accumulation at lower levels.
After completing the cup, a small pullback (handle) indicated a healthy consolidation.
A strong breakout above the neckline resistance confirms the bullish pattern.
⚡ Actionable Insights:
As long as the price stays above the neckline, momentum remains positive.
A breakout generally leads to a strong continuation rally towards the projected target.
📊 Watch for volume confirmation for added strength.
⚠️ Caution if price slips back below the neckline – breakout may invalidate.
Disclosure: I am part of TradeNation's Influencer program and receive a monthly fee for using their TradingView charts in my analysis.

BTC | Bitcoin CURRENT CANDLE | NEW ATH or 70kThe previous weekly candle seemed unable to make a higher high after retesting the support at 76K.
However, today's bullish impulse has suddenly shocked right through two resistance zones, with the price now trading just above 90k.
If we can successfully CLOSE the weekly candle above 91K, it's likely that BTC is in for a new ATH which would mean ETH will also reach a new ATH, and then altseason will commence 🥳
Watch the following and make sure you are prepared for ALTSEAON:
___________________
BINANCE:BTCUSDT

BTC Cycle Top - Confluence w/ Previous CycleBased on confluence with the previous cycle, I’m projecting the BTC cycle top around $115K.
Looking at the 2021 cycle, we saw:
A news-driven dump after the initial ATH.
A strong recovery to retest the previous highs.
Followed by the true cycle top exactly 26 weeks (182 days) later.
We're now seeing a similar pattern play out in 2025:
Post-ATH retrace and consolidation.
Recovery underway.
If history rhymes, we could be looking at the final leg up, topping out within the same 26-week window.
Target range is aligned with prior structure and psychological resistance.
Let’s see how it plays out…
#Bitcoin #Crypto #BTCUSD #CycleTop #CryptoTrading #TechnicalAnalysis #BTC115K

Bitcoin Forming Head & Shoulders – Watch for a Fake-OutPattern Formation: A complex Head and Shoulders structure is forming:
Left Shoulder ✅
Double Head ✅
Right Shoulder forming 🔄
Resistance Zone: The price is currently near a strong resistance area (around $87,000–$88,000).
This zone is likely to act as a ceiling and reject the price.
Expected Move (Blue Arrows):
shows a possible fake breakout above the resistance.
Then, a strong drop is expected, targeting:
First support near $78,000

Btc bullish retest 100k levelBitcoin looking bullish as of this moment will try to hit 100k level again.
As of April 25, 2025, Bitcoin (BTC) is exhibiting a bullish trend, trading at approximately $95,203. This marks a significant recovery from earlier in the month when prices dipped below $76,000, and it's approaching the 2025 peak of over $100,000.
Investopedia
Several factors contribute to this positive momentum:
Macroeconomic Environment: The U.S. dollar has weakened, and gold prices have reached record highs, prompting investors to seek alternative assets like Bitcoin.
New York Post
Institutional Interest: Organizations such as ARK Invest have reaffirmed their bullish long-term outlooks for Bitcoin, with projections ranging from $300,000 to $1.5 million by 2030.
Investopedia
Regulatory Developments: Recent federal guidance has reduced oversight for banks offering crypto services, enhancing confidence in the cryptocurrency sector.
Investopedia
However, caution is advised. Market indicators suggest that Bitcoin may be approaching overheated conditions. Metrics like the Net Unrealized Profit/Loss (NUPL) and Market Value to Realized Value (MVRV) are nearing levels that historically precede corrections.
Crypto Tracker
In summary, while Bitcoin's current trajectory appears bullish, investors should remain vigilant of potential market corrections.

Bitcoin (BTC) $95K Target? ETF Inflows & Supply Shock Key Signal
Bitcoin Flashes Bullish Signals: Record ETF Flows and Supply Shock Fuel $95K Target Hopes
Bitcoin, the original cryptocurrency, is demonstrating renewed vigor, capturing investor attention with a confluence of bullish indicators. After a period of consolidation and sideways movement following its all-time high earlier this year, recent data suggests underlying strength is building. Significant inflows into U.S. spot Bitcoin ETFs, a tightening supply on exchanges, strong relative performance against traditional markets, and key technical levels being tested are painting a picture that has analysts eyeing the next major psychological and technical hurdle: $95,000.
ETF Demand Roars Back: A Sign of Renewed Institutional Appetite
One of the most significant developments fueling recent optimism is the resurgence of demand for U.S.-based spot Bitcoin Exchange Traded Funds (ETFs). Launched in January 2024, these products marked a watershed moment, providing traditional investors with regulated and accessible exposure to Bitcoin. After an initial explosive launch, inflows moderated. However, recent weeks have seen a dramatic turnaround.
Reports indicate that these ETFs recently experienced their largest single-day net inflows since their early days in January, signaling a powerful return of institutional and potentially broader retail interest. This influx of capital into regulated vehicles is crucial. It represents sticky, long-term demand rather than just short-term speculative trading. Each dollar flowing into these ETFs effectively removes Bitcoin from the readily available market supply, contributing to a potential supply squeeze.
This sustained demand has also propelled Bitcoin's overall market capitalization significantly. While direct comparisons fluctuate daily and depend on methodology (e.g., including gold, different equity classes), Bitcoin's market cap has grown to rival that of major global corporations and even some traditional asset classes. Its ascent up the ranks of the world's largest assets underscores its growing acceptance and integration into the broader financial landscape. While claiming a specific rank like "5th largest" can be debated based on what's included, there's no denying Bitcoin is now a multi-trillion dollar asset class demanding attention.
The Supply Squeeze: Coins Vanish from Exchanges
Complementing the demand surge is a notable trend on the supply side: Bitcoin reserves held on cryptocurrency exchanges are dwindling rapidly. Data reveals that the amount of BTC available for immediate sale on major trading platforms has plummeted to levels not seen since November 2018. This marks a multi-year low, indicating a strong preference among holders to move their coins into self-custody or long-term storage solutions, rather than keeping them poised for sale.
What's driving this exodus from exchanges? Analysts point to several factors, including the aforementioned ETF accumulation, where authorized participants acquire Bitcoin on the open market to meet ETF share creation demand. Furthermore, there's growing anecdotal and on-chain evidence suggesting accumulation by long-term holders ("HODLers") and potentially public companies adding Bitcoin to their balance sheets. While large-scale corporate buying sprees like MicroStrategy's haven't been widely replicated across the board, the cumulative effect of sustained institutional buying (via ETFs) and dedicated HODLers consistently pulling supply off exchanges creates a powerful dynamic.
Lower exchange reserves typically correlate with reduced selling pressure. When less Bitcoin is readily available to be sold, even moderate increases in demand can have an outsized impact on price. This scarcity factor is a core tenet of Bitcoin's value proposition, underpinned by its fixed supply cap of 21 million coins, and the current trend highlights this dynamic in action.
Relative Strength: The "Cleanest Shirt in the Dirty Laundry"
Bitcoin's recent performance also stands out when compared to traditional financial markets. Over the past 30 days (as per the provided context), Bitcoin has posted significant gains (e.g., +7.68%), while major equity indices like the S&P 500 and the tech-heavy Nasdaq have experienced notable pullbacks (e.g., -6.79% and -8.14%, respectively).
This divergence has led some commentators to describe Bitcoin as the "cleanest shirt in the dirty laundry pile." In times of macroeconomic uncertainty, geopolitical tension, or wavering confidence in traditional financial systems, Bitcoin can attract capital seeking alternatives or hedges. While its correlation with risk assets like tech stocks has often been high, periods of decoupling, like the one observed recently, suggest investors may increasingly view Bitcoin through a different lens – perhaps as a non-sovereign store of value or a bet on future technological disruption, rather than just another high-beta risk asset. This relative outperformance can attract momentum traders and further bolster positive sentiment.
Technical Hurdles: The Road to $95K
From a technical analysis perspective, Bitcoin's price action is generating significant discussion. One key metric analysts watch is the "realized price," particularly for short-term holders (investors who acquired BTC relatively recently). When the market price surpasses the average acquisition cost of these recent buyers, it can signal a shift in market psychology. Those who bought recently are now in profit, potentially reducing sell pressure and encouraging further buying. Bitcoin recently surpassed this level, leading to speculation about whether this marks the beginning of a sustained rally or potentially sets up a "double top" scenario – a bearish pattern where an asset fails twice to break above a certain resistance level.
Analysts are closely watching specific price levels. There appears to be a consensus around a key resistance zone that, if decisively reclaimed and held, could signal that "all bets are off" for the bears, potentially opening the door for a significant upward move. Conversely, failure to break through these levels, or a strong rejection from them, could lead to a pullback, validating the warnings from more cautious analysts.
The $95,000 mark looms large as the next major psychological and potential technical resistance area should the current momentum continue and key lower resistance levels be overcome. Reaching this target would likely require a confluence of the factors already discussed: continued strong ETF inflows, further depletion of exchange supply, supportive macroeconomic conditions (or continued relative strength despite macro headwinds), and a decisive break through established technical resistance zones.
What Triggers the Breakout?
Achieving a breakout towards $95,000 isn't guaranteed and likely requires several catalysts:
1. Sustained ETF Demand: Continued, consistent net inflows into spot Bitcoin ETFs are paramount to absorb supply and signal ongoing institutional conviction.
2. Supply Shock Intensification: If exchange reserves continue to fall sharply, the scarcity narrative strengthens, potentially triggering FOMO (Fear Of Missing Out) buying.
3. Macroeconomic Shifts: A dovish pivot from central banks, renewed inflation fears driving demand for hard assets, or further instability in traditional markets could push more capital towards Bitcoin.
4. Technical Confirmation: A convincing break and hold above currently watched resistance levels would give technical traders confidence and potentially trigger algorithmic buying.
5. Positive Regulatory Developments: While the ETFs were a major step, further regulatory clarity or positive developments globally could reduce perceived risk.
Conclusion: Optimism Tempered with Caution
The current Bitcoin landscape presents a compelling bullish case. Resurgent ETF demand, dwindling exchange supply creating a scarcity effect, and strong relative performance against traditional assets paint an optimistic picture. Technical indicators, such as surpassing the realized price of recent buyers, add fuel to the fire, bringing targets like $95,000 into the conversation.
However, caution remains warranted. Bitcoin is notoriously volatile, and technical resistance levels often prove formidable. The risk of a "double top" or rejection at key levels is real, and regulatory headwinds or negative macroeconomic shifts could quickly alter sentiment. While the confluence of positive factors is undeniable and the path towards $95,000 seems plausible given the current dynamics, investors will be keenly watching whether ETF flows remain strong, supply continues to tighten, and crucial technical levels can be decisively overcome. The interplay between institutional adoption, HODLer conviction, and market technicals will ultimately determine if Bitcoin can conquer its next major milestone.

BITCOIN NEXT MOVES!Bitcoin’s Next Move
In the long run, it's clear—Bitcoin is the new digital gold. Any dip at this stage is a potential opportunity. With over 7 years of experience in Bitcoin analysis, I believe in the bigger picture and long-term value.
If you'd like me to analyze or give insights on any other coin, feel free to ask. And don’t forget to follow for more crypto updates and analysis!

Bitcoin Monthly compared to Historical Cycle Tops-UPDATE $400K ?
Keeping this simple
PA is on the 3rd of 3 Candles below that Threshold line. The comparison is the same position back in 2017 ( left Arrow ), Same Months, same position and also in the 4th year of the Cycle.
Now, I will say, I am one of the many that are saying "this time is different" and yet, when we see this.....well....Is it ?
We will find out in time but for now, Lets follow the chart, as we Must......Charts Never Lie
SO, for that Green candle to touch the threshold line, we are looking around the current ATH and then, when MAY comes in, we need to stay above.
Now, The monthly Candle Colours charts I post, mentioned, that if April closes Green, May has a High Percent chance of also doing that.
We have to wait and see - 1 Week to go till April closes.
As you can see, historically, The year with the Green Box is the year we go to ATH and above the upper trend line, with the ATH on or above that dashed line.
This puts this cycle ATH around, or above, $400K !
That is near Twice my current projection.
Is this time different. ?
There is a chart I have that explains how Bitcoin has been under an Arc od resistance since it's crea\ion and This is something that could keep PA down to the 250K ATH that is expected by so many
The chart is Below, it exoplains itself
So, the next 6 weeks are Pivotal to how this cycle will play out, with one of two ATH zones available.
But more importantly, Bitcoin PA NEEDS to break above and away from that Arc of resistance....and THAT WOULD MAKE THIS TIME DIFFERENT
Enjoy the ride guys and Gals
