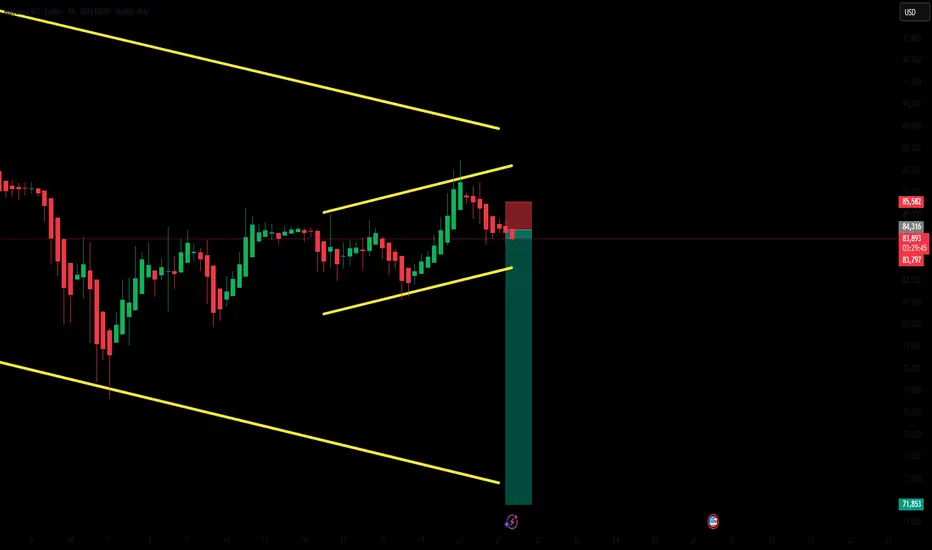
Volume fades, double top forms – is Bitcoin headed to 70k?CRYPTOCAP:BTC is showing signs of exhaustion near the $83,500–$84,000 zone, with repeated rejections indicating weakening bullish momentum. Volume is steadily declining, which typically signals a lack of conviction from buyers.
We may be witnessing the formation of a potential double top – a bearish reversal pattern. If confirmed, this could trigger a correction toward $78K, $74K, or even the $70K–$68K zone.
Key Levels to Watch:
Resistance: $83,500–$84,000
Support: $78,000 → $74,000 → $70,000 → $68,000
This corrective move could be healthy for the market, potentially flushing out weak hands and injecting fresh liquidity for a stronger upward rally in the coming weeks.
Bitcoinprice

BTCUSD BTCUSD GOING UP we just grabbed liquidity we heading to 88 mark, America reversing the tariffs mean uncertainty in the USD makes it weak and therefore loses investor confidence..let's go against america

Double bottom forms, but trend remains bearish?Despite pressure stemming from President Donald Trump’s recent tariffs, analysts at Bernstein note Bitcoin’s relative resilience, particularly on shorter-term time frames where a double bottom pattern suggests underlying bullish interest. Bitcoin’s ‘safe haven’ appeal may be resonating with investors more than previously.
However, the longer-term chart reveals price action still maintained within a multi-month downtrend. After briefly rising above $80,000 on April 9 (peaking at $83,000), the price has since pulled back, confirming last week’s losses and raising the risk of further downside.

Trump Manipulates the Market Again: Tariffs ON/OFF PlayOnce again, we’re watching how political narratives are used to shake the markets — and Bitcoin was no exception this time.
🔻 Step 1: "TARIFFS ON" Announcement
Market instantly reacts with a sharp sell-off
BTC drops from 81K to nearly 75K
Fear spikes, media goes wild
📉 That’s your classic short squeeze setup.
🔺 Step 2: "TARIFFS OFF" Retraction
Massive green candle, BTC rebounds from lows
Shorts get liquidated
Price rips back up in minutes
💸 It’s a textbook fake panic followed by a well-timed reversal. Someone knew what was coming. Someone profited. And it wasn’t retail.
🔎 What does this mean? This is not just market volatility — this is narrative-based manipulation. If you're trading without paying attention to headlines, you're already behind.
🧵Follow the money. Follow the timing. Follow the candles. #Bitcoin #BTCUSD #MarketManipulation #Tariffs #Trump #PoliticsInMarkets #Whales #NarrativeTrading #PriceAction

Bitcoin -Weekly, Daily, H4, H1 Forecasts, Trading IdeasMidterm forecast, Weekly Timeframe:
While the price is above the support 70550.04, resumption of uptrend is expected.
We make sure when the resistance at 91037.20 breaks.
If the support at 70550.04 is broken, the short-term forecast -resumption of uptrend- will be invalid.
BITSTAMP:BTCUSD MARKETSCOM:BITCOIN
Daily Timeframe:
A trough is formed in daily chart at 74545.70 on 04/09/2025, so more gains to resistance(s) 86499.57 and maximum to Major Resistance (91037.20) is expected.
Take Profits:
86499.57
91037.20
94505.46
98675.19
101430.12
105431.17
109932.89
115000.00
120000.00
125000.00
130000.00
140000.00
H4 Timeframe:
H1 Timeframe:
________________________________________________________________
❤️ If you find this helpful and want more FREE forecasts in TradingView,
. . . . . . . . Hit the 'BOOST' button 👍
. . . . . . . . . . . Drop some feedback in the comments below! (e.g., What did you find most useful? How can we improve?)
🙏 Your support is appreciated!
Now, it's your turn!
Be sure to leave a comment; let us know how you see this opportunity and forecast.
Have a successful week,
ForecastCity Support Team

BTCUSDT | Waiting for Precision – Not Just Price LevelsMany were tempted to short BTCUSDT around the $83,000 region, and I was closely watching it too. However, as always, I don’t take trades based solely on price levels. What separates professional trading from guesswork is the data behind the scenes, and in this case, CDV (Cumulative Delta Volume) did not show any bearish divergence. That’s why I completely passed on this level without hesitation.
🎯 What’s Next?
Upper Blue Box is My Focus: I’ve now shifted my attention to the next key upper blue box, where I’ll be looking for serious short opportunities, but only if LTF confirmations such as orderflow shifts, CDV divergences, or volume traps appear.
Why I Wait: Just because a price hits a “zone” doesn’t mean we react. Professional traders wait for confluence, confirmation, and controlled risk.
🔒 Smart Trader Checklist:
No CDV divergence = No trade.
Wait for price to enter the upper blue box and react.
Short only with proper lower time frame confirmation.
If price breaks above with strong momentum and retest, I will not insist on shorts. I will shift and look for longs.
💡 I trade with precision and patience—not emotion. These levels are not random lines, but key zones mapped with advanced tools and strict discipline. That’s why my followers consistently win, and why my success rate is among the highest you’ll find here.
If you want to trade with clarity, confidence, and data-backed precision, just keep following me. You’ll see the difference.
📌I keep my charts clean and simple because I believe clarity leads to better decisions.
📌My approach is built on years of experience and a solid track record. I don’t claim to know it all but I’m confident in my ability to spot high-probability setups.
📌If you would like to learn how to use the heatmap, cumulative volume delta and volume footprint techniques that I use below to determine very accurate demand regions, you can send me a private message. I help anyone who wants it completely free of charge.
🔑I have a long list of my proven technique below:
🎯 ZENUSDT.P: Patience & Profitability | %230 Reaction from the Sniper Entry
🐶 DOGEUSDT.P: Next Move
🎨 RENDERUSDT.P: Opportunity of the Month
💎 ETHUSDT.P: Where to Retrace
🟢 BNBUSDT.P: Potential Surge
📊 BTC Dominance: Reaction Zone
🌊 WAVESUSDT.P: Demand Zone Potential
🟣 UNIUSDT.P: Long-Term Trade
🔵 XRPUSDT.P: Entry Zones
🔗 LINKUSDT.P: Follow The River
📈 BTCUSDT.P: Two Key Demand Zones
🟩 POLUSDT: Bullish Momentum
🌟 PENDLEUSDT.P: Where Opportunity Meets Precision
🔥 BTCUSDT.P: Liquidation of Highly Leveraged Longs
🌊 SOLUSDT.P: SOL's Dip - Your Opportunity
🐸 1000PEPEUSDT.P: Prime Bounce Zone Unlocked
🚀 ETHUSDT.P: Set to Explode - Don't Miss This Game Changer
🤖 IQUSDT: Smart Plan
⚡️ PONDUSDT: A Trade Not Taken Is Better Than a Losing One
💼 STMXUSDT: 2 Buying Areas
🐢 TURBOUSDT: Buy Zones and Buyer Presence
🌍 ICPUSDT.P: Massive Upside Potential | Check the Trade Update For Seeing Results
🟠 IDEXUSDT: Spot Buy Area | %26 Profit if You Trade with MSB
📌 USUALUSDT: Buyers Are Active + %70 Profit in Total
🌟 FORTHUSDT: Sniper Entry +%26 Reaction
🐳 QKCUSDT: Sniper Entry +%57 Reaction
📊 BTC.D: Retest of Key Area Highly Likely
📊 XNOUSDT %80 Reaction with a Simple Blue Box!
📊 BELUSDT Amazing %120 Reaction!
I stopped adding to the list because it's kinda tiring to add 5-10 charts in every move but you can check my profile and see that it goes on..

BTCUSDT long idea3 confirm for long position on BTC
1. Bitcoin is going to retest on 74k-72k strong support zone.
2. Also its making massive bullish pattern.
3. Crashed +10% in 24 hours. So potentially bounce back hard.
Hopefully bitcoin can make new ATH.

Tariff Pause. Who wins ? BITCOIN leads the surge higherI don't meed to say to much ehre, the charts tell the stiry.
All are 4 hour
BITCOIN - GOLD
DXY $ - S&P500
And BITCOIN has the highest Rise in this time.
Gold was rising as safety seemed sensible but now, Risjier asset are safe for 3 months. ( for now)
The DXY dained against other currencies, taking back gains maybe
And the S&P riases though the NASDAQ has marginally higher gains.
Europeon markets will open tomorrow with a burst I expect.
This is not accident and it is the USa showing the worlf how much control it has over world finance.
As I have said many time in thepast 3 years. The New world war is not foght with Blood, it is fought with MONEY and the USa is , once again, Showing its force.
And the fact that BITCOIN has the highest gains, is DECENTRALISED, shows you why the USa wamts as mauvh of ot as possible
BITCOIN cannot be "Owned" and used as a Tool of War.
Buy BITCOIN, Spread the Power

Bitcoin - Watching For CapitulationI'm not going to try and predict whether not Bitcoin has begun what I believe to be its inevitable long term bear market, but I will look at some important trends and horizontal levels. For years, I've speculated that Bitcoin would have a hard time sustaining a significant new all-time high. It turns out, for the mean time, I've been correct in that assumption.
Bitcoin has now broken down from the ascending broadening wedge pattern that began in November, 2022. Here's the chart zoomed out:
There is still a chance for this to be a false breakdown, if buyers show up soon and take price back above that $87-90K resistance, which has become quite strong. However, ongoing global market news continues to remain bearish fundamentally, as many commodities and material objects will have to be repriced to the upside. At the same time, the FED is in a bind because if this causes a spike in unemployment, they will be more hesitant to lower rates, fearing greater inflation. This is the definition of stagflation.
In any case, zoomed in you can see that Bitcoin is in a downtrend channel - often a bullish pattern. My speculation is that Bitcoin will attempt to break down BELOW the channel, leading to a cascade of liquidations. This kind of drop can end around $69-71K on the shallow end, though can go much deeper from a structural standpoint. Outlined are all the support levels, and circled in red is a potential capitulation area.
If Bitcoin manages to bounce from the $60-70K level on high enough volume, depending on economic news, price can even make a new high. But we're not there yet by any means. This possibility is shown with the green arrow. On the other hand, if Bitcoin cannot bounce at the previous trend resistance (light blue line below the red local downtrend), price can retrace all the way towards $48-50K.
Let's see what happens!
Thanks for reading.
-Victor Cobra

Is Bitcoin holding up or sell-off coming soon?CME:BTC1!
Surprisingly, the price of bitcoin and bitcoin futures have held up well compared to stocks given that Bitcoin is a high risk, highly volatile crypto currency.
It is almost as if hedge funds, and other investors have not had to liquidate their BTC exposure due to margin calls.
Open Interest has been stable and average daily volume is holding up. This can be viewed by accessing the CME Bitcoin Open Interest and Volume .
What is next for Bitcoin futures?
As noted in our analysis, CME bitcoin futures are currently trading below the key level 2024 mid-range.
Key Levels:
2024 Mid-Range, Key LIS: 79655
2024 till YTD CVPOC: 71705
Support Zone: 63140 - 57275
2024 till YT CVAL: 57275
Scenario 1: Further Downside - technical breakdown
We expect further downside and move towards our support zone marked on the chart. Enter short on a pull back towards mid-range with stops above high of Apr 3rd, 2025.
Example Trade 1:
• Short Entry: 79000
• Stop: 85240
• Target: 60000
• Risk: 6240
• Reward: 22000
• Risk/Reward Ratio: ~ 3R
Scenario 2: Reclaim mid-range and consolidate
In this scenario, if the price gets back above 2024 mid-range and stays above, we expect the price to range between 90K to 80K.
Example Trade 2:
• Long Entry: 80000
• Stop: 74630
• Target: 89000
• Risk: 5370
• Reward: 9000
• Risk/Reward Ratio: ~ 1.68 R
Important Notes:
• These are example trade ideas not intended to be a recommendation to trade, and traders are encouraged to do their own analysis and preparation before entering any positions.
• Stop losses are not guaranteed to trigger at specified levels, and actual losses may exceed predetermined stop levels.
• NFA does not have regulatory oversight over spot cryptocurrencies or virtual currencies derivatives traded on unregulated/decentralized exchanges.
Glossary Index for all technical terms used:
YTD: Year to Date
LIS: Line in Sand
CVPOC: Composite Volume Point of Control
CVAL: Composite Value Area Low
Green Zones: Bull/ Buyers support zones

"Bitcoin vs U.S Dollar" Crypto Market Heist Plan (Scalping/Day)🌟Hi! Hola! Ola! Bonjour! Hallo! Marhaba!🌟
Dear Money Makers & Robbers, 🤑 💰💸✈️
Based on 🔥Thief Trading style technical and fundamental analysis🔥, here is our master plan to heist the BTC/USD "Bitcoin vs U.S Dollar" Crypto Market. Please adhere to the strategy I've outlined in the chart, which emphasizes long entry. Our aim is the high-risk Red Zone. Risky level, overbought market, consolidation, trend reversal, trap at the level where traders and bearish robbers are stronger. 🏆💸"Take profit and treat yourself, traders. You deserve it!💪🏆🎉
Entry 📈 : "The heist is on! Wait for the MA breakout (84.400) then make your move - Bullish profits await!"
however I advise to Place Buy stop orders above the Moving average (or) Place buy limit orders within a 15 or 30 minute timeframe most recent or swing, low or high level.
📌I strongly advise you to set an "alert (Alarm)" on your chart so you can see when the breakout entry occurs.
Stop Loss 🛑: "🔊 Yo, listen up! 🗣️ If you're lookin' to get in on a buy stop order, don't even think about settin' that stop loss till after the breakout 🚀. You feel me? Now, if you're smart, you'll place that stop loss where I told you to 📍, but if you're a rebel, you can put it wherever you like 🤪 - just don't say I didn't warn you ⚠️. You're playin' with fire 🔥, and it's your risk, not mine 👊."
Thief SL placed at the recent/swing low level Using the 30mins timeframe (82.000) Day trade basis.
SL is based on your risk of the trade, lot size and how many multiple orders you have to take.
🏴☠️Target 🎯: 87.500 (or) Escape Before the Target
🧲Scalpers, take note 👀 : only scalp on the Long side. If you have a lot of money, you can go straight away; if not, you can join swing traders and carry out the robbery plan. Use trailing SL to safeguard your money 💰.
BTC/USD "Bitcoin vs U.S Dollar" Crypto Market Heist Plan (Scalping/Day) is currently experiencing a bullishness,., driven by several key factors. 👇👇👇
📰🗞️Get & Read the Fundamental, Macro, COT Report, On Chain Analysis, Sentimental Outlook, Intermarket Analysis, Future trend targets... go ahead to check 👉👉👉🔗
⚠️Trading Alert : News Releases and Position Management 📰 🗞️ 🚫🚏
As a reminder, news releases can have a significant impact on market prices and volatility. To minimize potential losses and protect your running positions,
we recommend the following:
Avoid taking new trades during news releases
Use trailing stop-loss orders to protect your running positions and lock in profits
💖Supporting our robbery plan 💥Hit the Boost Button💥 will enable us to effortlessly make and steal money 💰💵. Boost the strength of our robbery team. Every day in this market make money with ease by using the Thief Trading Style.🏆💪🤝❤️🎉🚀
I'll see you soon with another heist plan, so stay tuned 🤑🐱👤🤗🤩

BITCOIN NEW SWING UPDATESHello folks, crypto folks. bitcoin might go to 3.168 fibs. but only if price can go lower 60k below.
THe idea of zoning for entries are a big risk for it.
This is only my view, this is a continuation pattern.
lets trade it to swing.
check my comments below I post some cool. stuff
THis is not a financial advice.
FOllow for more

Daily BITCOIN Bull Bear candles showing return of the Bulls ?I have used this chart often and have posted it here on a number of occasions with out the Bull Power Bear Power Histogram by CEYHUN active.
This is how the chart Looks when it is active.
This indicator calculates trading action to determine if a Candle is Bullish or Bearish and is VERY ACCURATE
And, Currently, Today's candle is GREEN, for the first time in a LONG TIME.
We can see how the candles have remained RED for most of the Drop in channel.
But now, while we sit on support on a Fib Speed Resistance Fan, we are GREEN.
Long Term, we can see that the climb back to current ATH could be tough. The VRVP on the right is clearly showing rising levels of resistance we climb higher.
Currently, we need to watch closely, to see that candle remain Green and that we do not loose support here.
I feel Bullish

BTC/USDT Analysis – Expected ReboundWhile the entire market was panicking and selling off, our primary scenario was a rebound from the buyer zone at $77,000–$73,000, which has played out.
Yesterday, Bitcoin experienced an abnormal spike in volume. A breakout and consolidation either below or above the newly formed volume zone at $78,000–$80,000 will set the trend for the coming days.
Our main scenario suggests a move toward the sell zone above the current price. At the moment, we are seeing a slight absorption of market selling based on delta analysis.
In a bearish scenario, support is expected on a false breakout of the local low at $74,550.
Sell Zones:
$82,000–$83,900 (volume zone)
$85,600–$88,000 (absorption of buyer aggression)
$95,000–$96,700 (accumulated volumes)
$97,500–$98,400 (pushing volumes)
$107,000–$109,000 (volume anomalies)
Buy Zone:
$69,000–$60,600 (accumulated volumes)

BTCUSD capped by resistance at 84,600Recent price action in Bitcoin (BTCUSD) suggests an oversold bounce, with resistance capping gains at the 88,000 level. The continuation of selling pressure could extend the downside move, with key support levels at 76,144, followed by 74,420 and 73,283.
Alternatively, a confirmed breakout above 84,600, accompanied by a daily close higher, would invalidate the bearish outlook. In this scenario, Bitcoin could target 88,000, with further resistance at 91,890.
Conclusion:
The price remains below pivotal level, with 88,000 acting as a key resistance. Failure to break above this level could reinforce downside risks, while a breakout could shift momentum back in favor of bulls. Traders should watch for confirmation signals before positioning for the next move.
This communication is for informational purposes only and should not be viewed as any form of recommendation as to a particular course of action or as investment advice. It is not intended as an offer or solicitation for the purchase or sale of any financial instrument or as an official confirmation of any transaction. Opinions, estimates and assumptions expressed herein are made as of the date of this communication and are subject to change without notice. This communication has been prepared based upon information, including market prices, data and other information, believed to be reliable; however, Trade Nation does not warrant its completeness or accuracy. All market prices and market data contained in or attached to this communication are indicative and subject to change without notice.

TRUMP EFFECT BTC is being prepared for correctionBITCOIN IS READY FOR CORRECTION OR CONTINUES ITS DOWNWARD TREND
fool trump
trump decide to destroy world economy

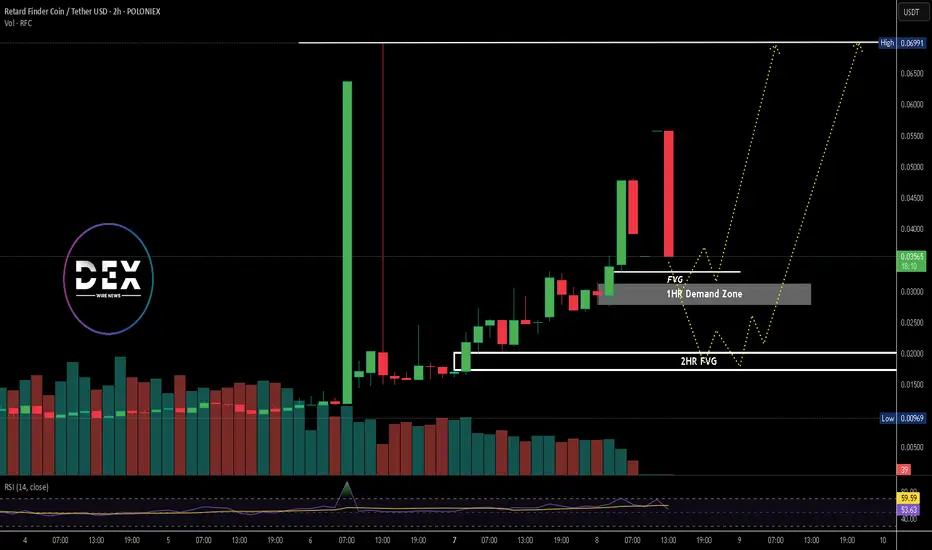
Retard Finder Coin (RFC) Surges Over 230% in Last One Week Retard Finder Coin (RFC) continues its explosive rally. The meme coin has surged 44.20% in the last 24 hours. In the last 7 days, RFC has gained 231.38% and 254.63% over the last 30 days.
As of now, RFC trades at $0.03901 with a market cap of $37.6 million and its daily trading volume has reached $14.79 million. Circulating supply stands at 961.55 million RFC out of a total 1 billion tokens.
RFC is a meme coin with no utility. It was created purely for entertainment. Inspired by meme culture, it aims to bring humor to the crypto space. The token has a large online community with over 660,000 followers.
The coin gained traction alongside a broader crypto market recovery. Bitcoin climbed back to $79,000 after dropping below $75,000 due to recent tariff announcements by Trump. Ethereum now trades above $1,500, XRP above $1.80 as the overall market continues to recover.
Technical Analysis
RFC reached a recent high of $0.06991 on April 6th. After the peak, it dropped sharply to $0.01476. Since then, the price has been recovering steadily. However, the last two hours have shown bearish movement.
Watch closely as the price approaches key levels as the coin needs to reclaim momentum to retest the previous high. If RFC gains strength again, it could return to $0.06991 and possibly surpass it. This would need a strong support for price to get a rejection from and get enough strength to break above a key swing high
Potential Support Zones
Currently, support lies at the 1-hour demand zone and a fair value gap (FVG) lying above at around $0.03000. If price breaks below this level key support area, it may fall further to the 2-hour FVG at $0.01884.
This zone could serve as a key support area for bulls to regroup. If the price confirms a bullish reversal at either level, RFC could resume its upward trend. Failure to hold support in any of the levels may lead to a deeper retracement.
Key levels to monitor remain around these support zones. In summary, RFC continues to draw attention despite its lack of utility. The coin rides the meme wave and strong community support. While short-term volatility persists, these key technical levels offer potential entries for bullish continuation.
Bitcoin Bubble at $70K? Prepare for ImpactBitcoin recently faced strong rejection near the $81,000 level, forming a potential double top pattern on the higher timeframes. This classic bearish reversal setup is now playing out, as price action has begun to decline from the second peak.
Adding to the bearish confluence, the MACD has confirmed a bearish crossover, signaling weakening momentum and a potential trend reversal. The rejection at $81K aligns with historical resistance, and price has failed to break above it despite multiple attempts.
Going forward, there are two key scenarios to watch:
Retest of the $76,700 zone – A minor support area that could offer a bounce or consolidation before the next move.
Deeper pullback towards $70,000 – If bearish pressure continues, CRYPTOCAP:BTC could head lower to test this psychological and technical support level.

BITCOIN EMERGENCY!!!Please refer to my previous ideas on bitcoin it’s been a good flow on mapping where it goes :)
Bitcoin do historic moves we rally to 300k soon
Then eventually 2 million by 2030 see you guys on mars

Bitcoin Falls Below $75,000, Impacting Crypto-Exposed StocksBitcoin (BTC) slipped under $75,000 on Monday as fresh U.S.-China trade tensions rattled markets. The drop followed President Donald Trump’s announcement of new tariffs on Chinese goods. Beijing responded swiftly, increasing fears of a prolonged trade war.
Bitcoin fell to a daily low of $74,500 before recovering to trade near $79,000. This marked its lowest level since November 2024. Before the drop, Bitcoin had consolidated around $85,000 for several weeks.
The crypto market lost 7% of its total market capitalization in 24 hours. Coinglass data showed $1.61 billion in crypto liquidations. Bitcoin dominance rose slightly to 62.62%.
Ethereum (ETH) and XRP also recorded sharp losses. Ethereum briefly dropped below $1,500 but rebounded above support. XRP fell over 10%, currently trading at $1.8710.
Meme coins and altcoins mirrored the losses. Nearly all top-30 tokens saw double-digit declines. Derivatives traders reduced exposure, with open interest falling 10% to $91.19 billion.
Crypto-Exposed Stocks Take a Hit
Stocks tied to crypto followed Bitcoin’s slide. Shares of Coinbase Global (COIN), Marathon Digital (MARA) and Robinhood (HOOD) all declined. Strategy Inc. (MSTR), formerly MicroStrategy, dropped 9.24% in pre-market trading. The company holds a large Bitcoin treasury, making it sensitive to BTC movements.
However, chipmaker Nvidia (NVDA) rose 3.5% in a minor rebound. The stock had fallen 14% the previous week, its worst since January 2024. Nvidia remains down 27% year-to-date.
Technical Analysis: Bitcoin Retests Key Levels
Bitcoin has remained bearish since hitting an all-time high of $109,000 in January. The recent slide takes BTC back to levels last seen in November 2024. Despite temporary bounces, the market continues to trend downward.
BTC is now hovering above $78,000 but may head toward $71,000 support. This level could provide a base for a potential rally. A move below $71,000 could trigger further declines.
Recovery Depends on Macro Conditions. Traders are watching for new developments and macroeconomic data. The market needs positive catalysts to reverse bearish sentiment. Sentiment remains fragile after Trump’s tariffs and fears of global slowdown. The future of the crypto market under Trump’s administration is uncertain.

Breaking: Bitcoin Loses $80,000 Support The price of Bitcoin ( CRYPTOCAP:BTC ) today saw a noteworthy downtick of 2.24% today making it down 7% since last week losing the $80k grip. This move came days after Donald Trump the recently elected president, on Wednesday, announced a minimum tariff rate of 10% and higher rates for 57 economies like China (34%), the European Union (20%), and Japan (24%). Fitch Ratings estimated that the effective tariff rate could hit 25% on average — the highest in more than 115 years.
The asset has tanked to the $76,000- $74,000 support point, placing CRYPTOCAP:BTC on the brink of a selling spree should CRYPTOCAP:BTC break below the $70k support, possible retracement should be around the $60- $50k support points.
Similarly, with CRYPTOCAP:BTC trading below key Moving Averages (MA), and the RSI at 35, CRYPTOCAP:BTC is gearing up for a reversal albeit the market is still volatile. If Bitcoin ( CRYPTOCAP:BTC ) should break the 1-month high resistant a possible uptick to $120k is feasible.
Bitcoin Price Live Data
The live Bitcoin price today is $77,615.23 USD with a 24-hour trading volume of $78,391,741,615 USD. Bitcoin is down 5.64% in the last 24 hours. The current CoinMarketCap ranking is #1, with a live market cap of $1,540,502,278,162 USD. It has a circulating supply of 19,847,937 BTC coins and a max. supply of 21,000,000 BTC coins.

Bitcoin Holding Strong — Next Stop: $150K?BTCUSDT Technical analysis update
BTC price is currently retesting its major support zone, which was previously a strong resistance area, now acting as support at the $70K–$75K level. The price has just touched the $75K support zone, and we can expect a consolidation above the $70K level followed by a potential bounce back or a V-shaped recovery from the current level.if we see a strong bounce from the current support level, the next potential target could be around $150K

Bitcoin Sell to 73/72k ?There is a potential incoming sell on the 4 hour time frame.
Take profit around : 73/72 k
Stop loss: 85.6k