Breaking: Bitcoin Loses $80,000 Support The price of Bitcoin ( CRYPTOCAP:BTC ) today saw a noteworthy downtick of 2.24% today making it down 7% since last week losing the $80k grip. This move came days after Donald Trump the recently elected president, on Wednesday, announced a minimum tariff rate of 10% and higher rates for 57 economies like China (34%), the European Union (20%), and Japan (24%). Fitch Ratings estimated that the effective tariff rate could hit 25% on average — the highest in more than 115 years.
The asset has tanked to the $76,000- $74,000 support point, placing CRYPTOCAP:BTC on the brink of a selling spree should CRYPTOCAP:BTC break below the $70k support, possible retracement should be around the $60- $50k support points.
Similarly, with CRYPTOCAP:BTC trading below key Moving Averages (MA), and the RSI at 35, CRYPTOCAP:BTC is gearing up for a reversal albeit the market is still volatile. If Bitcoin ( CRYPTOCAP:BTC ) should break the 1-month high resistant a possible uptick to $120k is feasible.
Bitcoin Price Live Data
The live Bitcoin price today is $77,615.23 USD with a 24-hour trading volume of $78,391,741,615 USD. Bitcoin is down 5.64% in the last 24 hours. The current CoinMarketCap ranking is #1, with a live market cap of $1,540,502,278,162 USD. It has a circulating supply of 19,847,937 BTC coins and a max. supply of 21,000,000 BTC coins.
Bitcoinprice

Bitcoin Holding Strong — Next Stop: $150K?BTCUSDT Technical analysis update
BTC price is currently retesting its major support zone, which was previously a strong resistance area, now acting as support at the $70K–$75K level. The price has just touched the $75K support zone, and we can expect a consolidation above the $70K level followed by a potential bounce back or a V-shaped recovery from the current level.if we see a strong bounce from the current support level, the next potential target could be around $150K

Bitcoin Sell to 73/72k ?There is a potential incoming sell on the 4 hour time frame.
Take profit around : 73/72 k
Stop loss: 85.6k
BTC/USD Long Setup – Bullish Reversal PlayAfter a sharp drop, BTC is testing a key liquidity zone around 78.2k. The market structure suggests a potential bullish reversal, with a fakeout and recovery in sight.
📌 Trade Idea:
Entry: After confirmation of a reclaim and bullish structure break (above ~79.3k)
SL: Below recent low ~77.6k
TP: 82.8k zone
RRR: ~3.2
📅 Timeframe: 30min
📈 Bias: Counter-trend long
🔁 Watch for: Price reaction at current support and market structure shift
🚨 Wait for confirmation – patience is key in volatile conditions!

Bitcoin Fibonacci levels from the 2022 low.This is what I am seeing. 68,500 is the bottom of channel support. The Fib retracements are a pretty big deal if you want to know where support lies.

BTC 4H – Weak Bulls, Range Breakdown Ahead?Trading gets much easier when you understand the strength and weakness of trends and the market cycle. Right now, BTC is showing us clear signs of bull exhaustion.
🔍 Technical Breakdown:
Price has been trapped between FWB:88K resistance and GETTEX:82K support, forming a visible trading range.
Recently, BTC failed to even reach the middle zone of the range, which reflects weak buying momentum.
With multiple rejections and bearish pressure building, the GETTEX:82K support is likely to be broken soon.
🧭 Next Target: If the breakdown occurs, expect price to fall below $80K, targeting the liquidation zones highlighted on the chart.
💡 The structure is shifting bearish—prepare accordingly.
📊 Stay sharp and follow for more accurate market insights! 🔔

Could Bitcoin Crash 60%—But Only 20% of Traders Lose?Analyzing the current BTC/USDT chart, we see that Bitcoin is hanging just above a critical support zone—what many traders recognize as “the most important support level” from a volume perspective on Binance. The chart illustrates a potential 60.37% drop, which would pull BTC down nearly $49,000, back toward the high-volume range near $30K.
This sounds catastrophic, right? But here’s the twist...
🔍 Why Only 20% of Traders Might Actually Lose
According to Binance's volume profile data:
The majority of buying activity and position accumulation happened below $35,000.
Most long-term holders and smart money entered during the 2022-2023 accumulation range.
The Volume Profile Visible Range (VPVR) shows significant support below the current price, with minimal trading volume at higher levels.
💡 That means only a minority (approx. 20%) of traders bought BTC during its late-stage bull run above $70K. These are the traders most at risk if a drop occurs.
In contrast, the majority are still sitting in profit—or near break-even—even if Bitcoin retraces back to its base.
📊 So while the price could drop 60%, 80% of holders might remain safe, having entered at lower levels.
🧠 What This Means for You:
If you're a late bull, it’s time to assess risk.
If you're a smart accumulator, the pullback could offer another golden entry.
If you're a bear, this chart supports your thesis—but don't forget the whales are watching this zone closely.
Stay sharp. Stay informed.

BTCUSD Trade AnalysisLong at 82,520
Target 1 (Primary):91,195 (Early exit if strong rejection forms)
Target 2 (Secondary):99,200 (If bullish momentum sustains)
Stop Loss:77,000 (Below key support).
Expecting a bullish continuation toward 99,200 before a potential sell-off resumes. Will monitor price action near 91,195 for signs of rejection. Stop loss placed below 77,000 to protect against a breakdown.

Bitcoin(BTC/USD) Daily Chart Analysis For Week of April 4, 2025Technical Analysis and Outlook:
In the course of this week's trading activities, we noted a successful retest of the Interim Coin Rally at 88400, with particular emphasis on the Mean Support at 82500. This development indicates the potential for an extension in a trajectory toward the previously established Outer Coin Rally at 78700. An upward momentum may originate from the Mean Support at 82500 and/or the Key Support at 79000/completed Outer Coin Dip at 78700.

Bitcoin vs. Nasdaq: BTC Shows Signs of Decoupling Amid US Stock
For years, the narrative surrounding Bitcoin’s price action has been inextricably linked to the performance of traditional financial markets, particularly the tech-heavy Nasdaq Composite. Often moving in lockstep, Bitcoin was viewed by many as a high-beta asset, amplifying the gains during bullish periods and suffering even steeper losses when risk sentiment soured in equities. However, recent market movements have sparked a crucial question among investors and analysts alike: is Bitcoin finally beginning to forge its own path, decoupling from the gravitational pull of U.S. stocks as they face mounting headwinds?
The past few weeks have witnessed a notable divergence. While U.S. stock markets, reeling from a confluence of factors including escalating geopolitical tensions stemming from a potential “Trump tariff war,” persistent inflation concerns highlighted by Federal Reserve Chair Jerome Powell’s hawkish warnings of “higher inflation and slower growth,” and broader macroeconomic anxieties, have experienced a significant downturn – shedding a staggering $3.5 trillion in value – Bitcoin has demonstrated a surprising degree of resilience, even posting gains in some instances. This nascent divergence has ignited a wave of optimism among Bitcoin proponents who have long yearned for the digital asset to be recognized and traded based on its own fundamental merits, rather than as a mere proxy for risk-on sentiment in the equity markets.
The concept of Bitcoin decoupling from traditional assets has been a recurring theme in the cryptocurrency space. The original thesis for Bitcoin, after all, positioned it as a decentralized, censorship-resistant store of value and a hedge against traditional financial system vulnerabilities. Its finite supply, its independence from central banks and government policies, and its inherent scarcity were touted as key differentiators that would eventually lead it to trade independently. However, the reality of the past few years has often painted a different picture, with institutional adoption bringing increased correlation with established asset classes.
The current shift, however tentative, offers a glimmer of hope for those who believe in Bitcoin’s unique value proposition. The factors contributing to the stock market slump – trade war anxieties, inflation fears, and the prospect of tighter monetary policy – arguably strengthen the case for Bitcoin as an alternative asset. In times of economic uncertainty and currency debasement concerns, the fixed supply and decentralized nature of Bitcoin could become increasingly attractive to investors seeking a safe haven outside the traditional financial system.
Furthermore, the increasing maturity of the Bitcoin market, with the development of more sophisticated trading instruments, greater institutional participation, and a deeper understanding of its underlying technology, may be contributing to its growing independence. As Bitcoin gains broader acceptance as a legitimate asset class, its price discovery mechanisms may become less reliant on the sentiment driving traditional equity markets.
However, it is crucial to approach this apparent decoupling with a degree of caution. While the recent divergence is encouraging for Bitcoin bulls, it is too early to definitively declare the long-awaited break has finally arrived. Market correlations can be fluid and influenced by a multitude of factors. A sudden shift in global risk sentiment or a significant negative event specific to the cryptocurrency space could easily re-establish the link between Bitcoin and traditional assets.
Adding a layer of complexity to the current narrative is the warning from some analysts regarding a potential Bitcoin price correction. Despite the recent resilience, multiple BTC price forecasting models have pointed towards a scenario where Bitcoin could fall back to its 2021 all-time high of around $70,000 in a relatively short timeframe – some even suggesting this could occur within the next ten days. This potential “crash risk,” as one analyst termed it, is attributed to various technical and market cycle indicators.
The notion that $70,000 could represent Bitcoin’s “practical bottom,” as suggested by some, highlights the inherent volatility and speculative nature of the cryptocurrency market. Even if Bitcoin is beginning to decouple from traditional equities, it remains susceptible to its own unique set of risks and price swings. Factors such as regulatory developments, network security concerns, and shifts in investor sentiment within the crypto space can still exert significant influence on its price.
Therefore, while the current divergence between Bitcoin and the struggling U.S. stock market offers a compelling narrative and fuels the hopes of long-term Bitcoin holders, it is essential to maintain a balanced perspective. The confluence of factors driving the stock market decline could indeed be creating an environment where Bitcoin’s unique characteristics become more appealing, leading to a sustained period of independent price action. However, the inherent volatility of the cryptocurrency market and the potential for a significant correction remind investors that the journey towards true decoupling is likely to be a complex and potentially bumpy one.
In conclusion, the recent market dynamics present a fascinating juncture for Bitcoin. The initial signs of decoupling from the crumbling U.S. stock market, driven by a confluence of macroeconomic anxieties and the potential for Bitcoin to act as an alternative store of value, are undeniably encouraging for those who believe in its long-term potential. However, the warnings of a potential price correction underscore the inherent risks within the cryptocurrency space. Whether this nascent decoupling marks a definitive shift in Bitcoin's market behavior or proves to be a temporary divergence remains to be seen. Investors would be wise to monitor these trends closely, remaining cognizant of both the potential for independent growth and the ever-present risks associated with this dynamic and evolving asset class. The coming weeks and months will be crucial in determining whether Bitcoin can truly forge its own path in the face of traditional market turmoil.

BTC - Crawling back up after Trump's tariffs.🚀 BTCUSDT - 4H Chart Analysis 🚀
📊 Market Context:
Bitcoin recently experienced a sharp move, creating a Fair Value Gap (FVG) that price is now retracing into. The large gap in price action was influenced by recent economic uncertainty and speculation around Trump's tariffs.
📌 Technical Insights:
🔹 Price rebounded strongly from the support zone 📈.
🔹 Now approaching the FVG, where sellers may step in.
🔹 A potential lower high formation could lead to a continuation downward.
📉 Trade Expectation:
If price shows signs of rejection within the FVG, we could see a bearish move unfold towards previous support levels. The red arrow highlights the expected move if the resistance holds.
⚠️ Market Caution: Given the macroeconomic impact of recent events, volatility remains high. Always wait for confirmation before making decisions!
📢 Do you think BTC will reject this zone or push higher? Drop your thoughts below! 💬🔥🚀

BTCUSDT BuyBitcoin is ready to start uptrend and retest 93k level. Stop area is 77k. Consolidation between 82 - 93 levels is still active.

Navigating BTC Volatility Storm: Buy, Hold, or Flee?Bitcoin's recent price action has been reminiscent of a rollercoaster, leaving investors grappling with a whirlwind of conflicting signals. From sharp drops mirroring stock market turmoil to the looming "death cross," the cryptocurrency's trajectory is shrouded in uncertainty. Is this a prime buying opportunity, a warning to retreat, or simply another bout of the volatility that defines Bitcoin?
The past few days have been a stark reminder of Bitcoin's inherent volatility. Reports of an 8% drop, coupled with the US stock market shedding $2 trillion in value, sent ripples through the crypto sphere. The catalyst? Concerns surrounding potential US tariffs and their impact on the global economic outlook. This sudden shift in market sentiment triggered a sell-off, reminiscent of the COVID-19 crash in 2020, during which Bitcoin’s pre-pandemic gains evaporated.
Adding to the unease is the looming "death cross," a technical indicator that occurs when the 50-day moving average crosses below the 200-day moving average. Historically, this pattern has signaled bearish momentum. The 2022 death cross, for example, precipitated a significant price drop of nearly 20%. Conversely, "golden crosses," where the 50-day moving average crosses above the 200-day moving average, have historically signaled bullish momentum, triggering rallies of over 500% in 2020 and 2021.
Currently, Bitcoin's 50-day moving average is edging closer to this critical crossover, prompting widespread speculation. Is this a repeat of 2022, or will the market defy historical patterns? The answer, as always, is complex and contingent on a confluence of factors.
One significant factor is the strength of the US dollar. While the dollar's strength can often negatively impact Bitcoin, the current increase in the money supply could potentially counteract this effect, creating a bullish flag pattern. The dollar's inflation may become a catalyst for Bitcoin as a store of value. The global market dynamics are currently shrouded in uncertainty, making it difficult to predict the long-term impact of these factors.
The recent price drops have pushed Bitcoin towards the $80,000 mark, with some analysts predicting a potential fall to $71,000. However, this level could also represent a "sizeable bounce," acting as a strong support zone for Bitcoin. The concept of an "oversold bounce" also comes into play. After a period of intense selling pressure, markets often experience a relief rally as traders capitalize on discounted prices. Whether this materializes remains to be seen.
Is it a Good Time to Buy Bitcoin?
The decision to buy, hold, or sell Bitcoin depends on an individual's risk tolerance, investment strategy, and understanding of the market. Here's a breakdown to consider:
• For the Long-Term Investor:
o Bitcoin's long-term potential remains a compelling narrative. Its decentralized nature, limited supply, and growing adoption continue to attract institutional and retail investors.
o Price volatility is an inherent part of the Bitcoin journey. Historically, periods of sharp declines have been followed by significant rallies.
o Dollar-cost averaging (DCA) can mitigate the impact of volatility by investing a fixed amount at regular intervals, regardless of the price.1
o The strength of the US dollar may become a catalyst for Bitcoin as a store of value.
• For the Short-Term Trader:
o The current volatility presents opportunities for skilled traders to profit from price swings.
o Technical analysis, including monitoring moving averages and support/resistance levels, is crucial for identifying potential entry and exit points.
o However, short-term trading is inherently risky and requires a deep understanding of market dynamics.
o The "death cross" should be monitored carefully.
• For the Cautious Investor:
o The current market uncertainty may warrant a more conservative approach.
o Diversifying investments across different asset classes can help mitigate risk.
o Staying informed about market developments and avoiding emotional trading decisions is essential.
The Death Cross: A Warning or a False Alarm?
The "death cross" is a significant technical indicator, but it's not a foolproof predictor of future price action. Historical data show that while it can signal bearish trends, it's not always accurate. Market conditions, investor sentiment, and macroeconomic factors can all influence Bitcoin's trajectory.
Ultimately, the Bitcoin market remains highly speculative. The current volatility, driven by a confluence of factors, underscores the importance of careful research, risk management, and a long-term perspective. While the "death cross" and market fluctuations may cause short-term panic, the long-term potential of bitcoin, and it's reaction to the weakening dollar, may still produce long-term gains.

ADA - Bearish Reversal Setup from Fair Value Gap🚀 ADAUSDT - 1H Chart Analysis 🚀
📊 Current Market Structure:
ADA is moving within a rising channel 📈, approaching a key resistance zone where a Fair Value Gap (FVG) is present. This area aligns with a significant Fibonacci retracement zone, making it a strong potential reversal point.
📌 Technical Insights:
🔹 Price is trading inside a well-defined bullish channel.
🔹 Approaching a major supply zone with previous reaction points.
🔹 Bearish rejection is expected in this area, leading to a potential drop.
📉 Trade Expectation:
A reaction from the FVG could lead to a downward move, as highlighted by the red arrows. If price confirms a rejection, a bearish shift in structure could occur, offering short opportunities.
⚠️ Risk Management Tip: Always wait for confirmation before acting on a setup. Managing risk effectively is key to long-term success!
📢 What do you think? Will ADA respect the FVG or push higher? Share your thoughts! 💬📉🚀

Will Bitcoin Continue Its Dip After Trump's Tariff Announcement?Macro:
- President Trump's recent tariff announcement has triggered sharp volatility in the crypto market, with Bitcoin falling below $84,000 amid fears of a global trade war and economic slowdown.
- The Crypto Fear and Greed Index remains in "Extreme Fear," signalling cautious investor sentiment.
- Despite the turbulence, institutional interest in Bitcoin remains strong, with firms like Strategy continuing to increase their holdings, showing long-term confidence in the asset.
Technical:
- BTCUSD is captured within a descending channel. The price rejected EMA21 after retesting it, indicating bearish momentum.
- If BTCUSD closes below the support at around 82000-82300, the price may retest the following support at 73000.
- On the contrary, closing above the resistance at 88500 may lead the price to approach the next resistance at 92000.
Analysis by: Dat Tong, Senior Financial Markets Strategist at Exness

BITCOIN!BTCUSD!
N.B!
- BTCUSD price might not follow the drawn lines . Actual price movements may likely differ from the forecast.
- Let emotions and sentiments work for you
- ALWAYS Use Proper Risk Management In Your Trades
#ethusd
#crypto
#btcusd
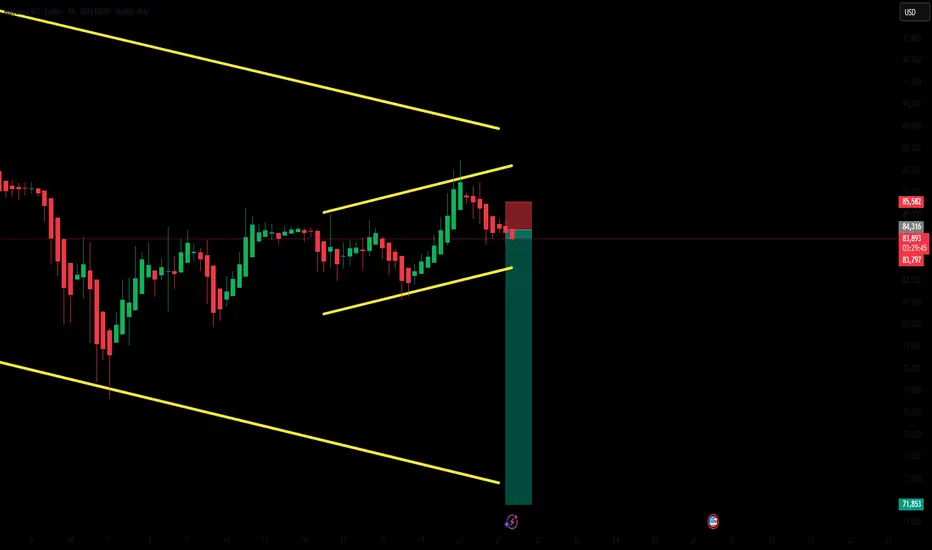
Bitcoin Rejection from Resistance – Short Setup with Bullish PotBitcoin is currently testing a key resistance zone around $85,500, where previous price action showed strong selling pressure. A rejection from this level could lead to a short-term pullback towards $83,750 - $83,250 , aligning with a retest of the broken trendline before a potential bullish continuation.
🔹 Entry: $85,200 - $85,500
🔹 Stop-Loss (SL): $86,000
🔹 Take-Profit (TP): $83,750, with potential long re-entry from this zone targeting $86,000+
📊 Watch for price action confirmation within the resistance zone before entering. If BTC holds above $85,500, the bullish breakout could accelerate. 🚀

Why is Eth Falling? ETH/BTC Ratio Hits All-Time Low Since 2020Why is Ethereum Falling? ETH/BTC Ratio Hits All-Time Low Since 2020
The cryptocurrency market is a volatile landscape, constantly shifting and evolving. Recent data has revealed a significant development: the Ethereum to Bitcoin (ETH/BTC) ratio has plummeted to an all-time low since 2020. This stark decline, currently resting at a mere 0.02 has ignited a wave of speculation and concern within the crypto community, raising questions about Ethereum's current standing and future trajectory.
The ETH/BTC ratio serves as a crucial metric for comparing the relative performance of Ethereum against Bitcoin. When the ratio falls, it indicates that Bitcoin is outperforming Ethereum, and conversely, a rising ratio suggests Ethereum's ascendancy. The current dramatic drop highlights a significant divergence in the fortunes of these two leading cryptocurrencies.
The backdrop to this decline is multifaceted. Bitcoin, often seen as the “digital gold” of the crypto world, has exhibited remarkable resilience and strengthened its position. This consolidation is likely driven by several factors, including increased institutional adoption, regulatory clarity in some jurisdictions, and its established reputation as a store of value. These factors have contributed to a sense of stability and confidence in Bitcoin, attracting capital and bolstering its market position.
Ethereum, on the other hand, has faced challenges in maintaining its momentum. While it remains the leading platform for smart contracts and decentralized applications (dApps), it has struggled to keep pace with Bitcoin's surge. Several factors contribute to this relative underperformance.
Firstly, regulatory uncertainty surrounding Ethereum and its classification has cast a shadow over its future prospects. The evolving regulatory landscape, particularly in major economies like the United States, has created a sense of unease among investors. The lack of clear guidelines and the potential for stricter regulations have dampened enthusiasm and limited institutional investment.
Secondly, Ethereum has faced competition from emerging layer-1 blockchains that offer faster transaction speeds and lower fees. These “Ethereum killers,” as they are sometimes called, have attracted developers and users seeking alternatives to Ethereum's perceived limitations. While Ethereum has undergone significant upgrades, such as the transition to proof-of-stake (The Merge), the benefits have not yet translated into a sustained surge in its relative value.
Thirdly, the overall market sentiment has played a role. Bitcoin's narrative as a safe haven and store of value has resonated strongly during periods of economic uncertainty. In contrast, Ethereum, with its focus on innovation and development, is perceived as a riskier asset. When market volatility increases, investors often gravitate towards the perceived safety of Bitcoin.
The decline in the ETH/BTC ratio raises several critical questions. Is Ethereum in trouble? Is this a temporary setback or a sign of a more fundamental shift in the crypto landscape?
While the current situation is concerning, it is essential to consider the long-term potential of Ethereum. Its robust ecosystem, driven by a vibrant community of developers and innovators, remains a significant asset. Ethereum's role in powering decentralized finance (DeFi), non-fungible tokens (NFTs), and other emerging technologies positions it as a crucial player in the future of the internet.
Furthermore, Ethereum's ongoing development efforts, including layer-2 scaling solutions and future upgrades, aim to address its scalability and efficiency challenges. These improvements could potentially revitalize Ethereum's performance and restore its competitive edge.
However, the current market dynamics suggest that Ethereum faces an uphill battle. To regain its footing, it needs to overcome regulatory hurdles, address its scalability issues, and effectively communicate its value proposition to a broader audience.
The cryptocurrency market is notoriously unpredictable, and past performance is not indicative of future results. The ETH/BTC ratio could rebound, or it could continue its downward trajectory. The outcome will depend on a complex interplay of factors, including regulatory developments, technological advancements, and market sentiment.
In the meantime, the low ETH/BTC ratio serves as a stark reminder of the dynamic nature of the cryptocurrency market. It underscores the importance of diversification and the need for investors to consider the risks and potential rewards of each asset carefully.
The current situation also highlights the need for Ethereum developers and community members to focus on the core values of the project, and to continue to innovate and improve the technology. Ultimately, the success of Ethereum will depend on its ability to adapt to the changing landscape and deliver on its promise of a decentralized and equitable future.
In conclusion, while the record low ETH/BTC ratio raises concerns about Ethereum's current standing, it is premature to declare its demise. The cryptocurrency market is constantly evolving, and Ethereum's long-term potential remains significant. However, the current challenges demand a proactive and strategic approach to ensure its continued relevance and success in the years to come.

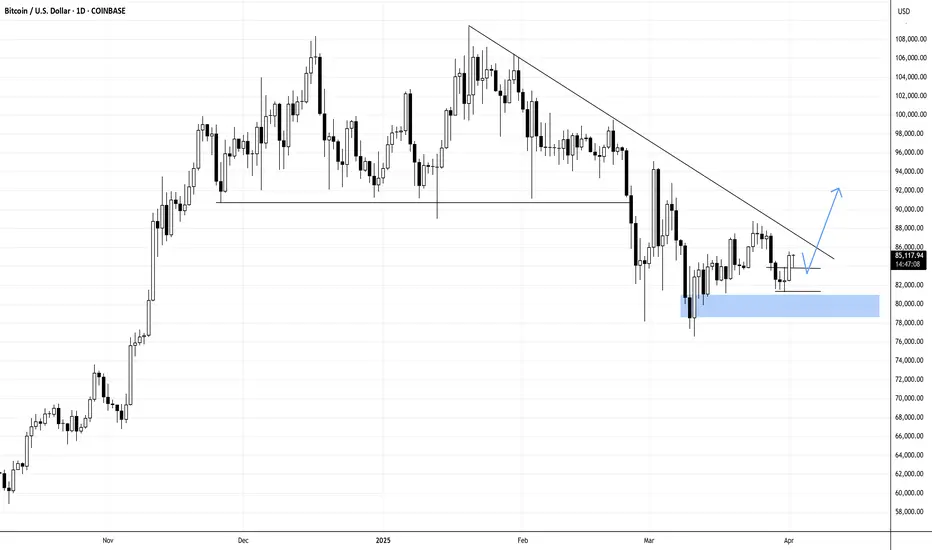
Bitcoin Daily HEADS UP - Nice start to Week But RESISTANCE NOW
The daily chart shows the line of resistance we now hit
This is the line that has rejected PA since january
It is Strong.
We May break through but we have to wait and see but it is certainly Wise to be prepared for rejection
Even more so when you look at the Apex we are coming to with in the next 7 days
PA ALWAYS REACTS BEFORE THE APEX
The Volume profile on the right suggests resistance overhead is strong but we do sit above the POC ( point of control )
All to play for this week and it coulf get emotional
And YES, that is a Fib circle we are hitting too
Double resistance could lead to a Drop in the near future and yet, it is also worth knowing that PA can pick an intersection of two lines of resistance to break through. Kind of 2 birds with one stone attitude.
We need to wait and see
What ever happens, I feel this week may be VERY interesting.
Enjoy

FXAN & Heikin Ashi TradeBINANCE:XRPUSD
In this video, I’ll be sharing my analysis of XRPUSD, using FXAN's proprietary algo indicators with my unique Heikin Ashi strategy. I’ll walk you through the reasoning behind my trade setup and highlight key areas where I’m anticipating potential opportunities.
I’m always happy to receive any feedback.
Like, share and comment! ❤️
Thank you for watching my videos! 🙏

Bitcoin Monthly Candle close colour patterns since 2011We got the expected RED March close but it was a close thing.
but, this creates better Odds for a continued push to ATH.
We have had only 3 occasions when we had a Green Jan, Red Feb, Red March ( arrows)
2 of those went on to an ATH the following Year !
The other one was entering a Bear Market.
Of the previous 7 RED March Closes, 5 were followed by a Green April
And of those 5, 4 were followed by consecutive Green candles closes for the following Months.
As you can see, April, May and June do have more GREEN closes than Red on average but May and June is near 50/50
It could be said that March Candle close was a "Spinning Top", showing in-balance / indecision in the market. This is possibly driven by Macro events.
We had a similar situation in 2012 and April was Green, as were the following months.
We had 2 other occasions with small Red candle bodies in March, both were Hammer Candles, one inverted, that led to a red April, the other was not and let to a green April.
The March close we just had, had a Long Upper Wick. To me, this shows the BEARS had the upper hand, keeping driving down.
And thats OK, PA needed to reset but we now need a GREEN April
Statistically, April should close Green - We currently have a Score of 8 Green to 5 Red month closes for April.
April seems to have opened GREEN and I hope to see it close that colour though we do need Caution
Because of the Colour sequence over recent months, there are not many comparisons to use.

Cronos is on the move, Could we see it hit $1 soon?The chart is a weekly candlestick chart of CRONOS (CRO) against USD on TradingView, showing price action from late 2023 to a projected point in 2025. Let’s break down the key elements:
Price Movement and Trend:
CRONOS experienced a notable peak around mid-2024, reaching approximately $0.24000, followed by a sharp decline.
After the peak, the price entered a downtrend, forming a descending triangle pattern, which is typically bearish but can lead to a breakout in either direction.
The price has since stabilized in an "Accumulation Zone" between $0.07197 and $0.08925, with the current price at $0.08925 as of April 1, 2025.
Descending Triangle Pattern:
The descending triangle is defined by a downward-sloping resistance line (yellow) and a horizontal support line around $0.08925.
This pattern often signals a potential breakout. A break above the resistance could indicate a bullish reversal, while a break below support might lead to further downside.
The resistance line is currently around $0.13000 to $0.15000, based on the slope.
Accumulation Zone:
The price is in an "Accumulation Zone" between $0.07197 and $0.08925, suggesting that buyers are holding this level and potentially accumulating positions.
Multiple tests of this support level indicate strong buying interest, which could set the stage for a breakout if bullish momentum builds.
Target Projection (TG 1S):
The chart projects a target labeled "TG 1S" at $0.42000, a significant increase from the current price.
This target is likely based on the height of the descending triangle pattern added to the breakout point, a common technical analysis method.
However, reaching $1 (as requested) would require a much larger move, approximately an 11x increase from the current price of $0.08925.
Support and Resistance Levels:
Key support is at $0.07197, with the current price at $0.08925.
Resistance from the descending triangle is around $0.13000 to $0.15000, with a previous high at $0.17018.
A break above $0.17018 could open the door to higher levels, but reaching $1 would require sustained momentum and likely strong fundamental catalysts.
Historical Context and Feasibility of $1:
CRONOS reached an all-time high of around $0.96 in November 2021 during a crypto bull market, so $1 is within historical precedent.
However, the current market environment (as of April 2025) would need to see significant bullish momentum, possibly driven by broader crypto market trends, adoption of the Cronos ecosystem, or major developments in the Crypto.com platform (which CRONOS is tied to).
The $0.42000 target is a more immediate goal, but $1 would require an extraordinary rally, likely over a longer timeframe.
Timeframe:
The chart extends into mid-2025, and the $0.42000 target appears to be a medium-term projection.
Reaching $1 might take longer, potentially into late 2025 or beyond, depending on market conditions.

Bitcoin's Rocky Quarter: Tariffs, Whales, and Volatility Loom
Bitcoin's first quarter of 2025 has concluded with a whimper, marking its worst Q1 performance since the tumultuous bear market of 2018.1 While gold has surged to record highs, fueled by geopolitical tensions and US trade tariffs, Bitcoin has struggled to maintain momentum, leaving traders bracing for potential further volatility. This week’s preview reveals a confluence of factors that could significantly impact Bitcoin's price trajectory.
A Disappointing First Quarter
The initial months of 2025 were anticipated to be a period of growth for Bitcoin, particularly with the anticipation surrounding the halving event. However, the cryptocurrency failed to deliver on these expectations. Instead, it experienced a period of stagnation and even decline, contrasting sharply with the robust performance of traditional safe-haven assets like gold.
Several factors contributed to this underwhelming performance. The escalating trade tensions, particularly the US tariffs, have injected uncertainty into global markets, diverting capital towards established safe-haven assets.
Tariffs and Trade Tensions: A Persistent Headwind
The US imposition of trade tariffs has emerged as a significant headwind for Bitcoin. These tariffs, designed to protect domestic industries, have disrupted global trade flows and created a climate of economic uncertainty.2 Investors, wary of potential market disruptions, have sought refuge in traditional safe-haven assets like gold, which has historically outperformed during periods of economic instability.
The impact of these tariffs extends beyond immediate market reactions. They signal a potential shift towards protectionist policies, which could have long-term implications for global trade and investment flows. Bitcoin, often touted as a decentralized and borderless asset, is particularly vulnerable to disruptions in global trade and capital flows.
Whale Activity and Market Manipulation
Adding to the complexity of the market is the activity of large Bitcoin holders, often referred to as "whales."3 These entities, possessing significant amounts of Bitcoin, can exert considerable influence on market prices through large buy or sell orders. Recent observations suggest increased whale activity, potentially contributing to the volatility and price fluctuations.
Concerns about market manipulation have also resurfaced. The decentralized nature of Bitcoin, while a core strength, also presents challenges in terms of regulation and oversight. This lack of centralized control can create opportunities for manipulation, leading to price swings that are not necessarily reflective of fundamental market dynamics.
Bitcoin Bears Tighten Grip: Where’s the Next Support?
The recent price action indicates that Bitcoin bears are tightening their grip. The failure to sustain upward momentum has emboldened sellers, leading to a downward trend. Traders are now closely monitoring key support levels, anticipating potential further declines.
Identifying these support levels is crucial for understanding the potential trajectory of Bitcoin's price. Technical analysis, using tools like Fibonacci retracement levels and moving averages, can help traders identify potential areas of support where buying pressure may emerge. However, the volatile nature of Bitcoin makes it challenging to predict these levels with certainty.
Gold vs. Bitcoin: A Comparative Analysis
The stark contrast between gold's recent performance and Bitcoin's struggles has reignited the debate about their respective roles as safe-haven assets. Gold, with its long history and established reputation, has benefited from the current climate of uncertainty.
However, Bitcoin proponents argue that its decentralized nature and limited supply make it a superior store of value in the long term. The comparison between the two assets highlights the evolving nature of safe-haven assets and the growing acceptance of digital currencies. The quote "Gold has taken 26 years to 10X. Bitcoin has taken 4 years to 10X" shows the potential for rapid growth, but also its volatility.
Looking Ahead: Volatility and Uncertainty
The coming week promises to be a period of significant volatility for Bitcoin. Traders should brace for potential price swings, driven by a combination of factors, including:
• Continued Trade Tensions: The ongoing trade disputes and potential for further tariffs are likely to continue to impact market sentiment.
• Whale Activity: Large buy or sell orders from whales could trigger significant price fluctuations.
• Regulatory Developments: Any regulatory announcements or policy changes could have a substantial impact on Bitcoin's price.
• Macroeconomic Factors: Inflation data, interest rate decisions, and other macroeconomic indicators will continue to influence investor behavior.
•
In conclusion, Bitcoin's disappointing first quarter has set the stage for a period of heightened volatility. The confluence of trade tensions, whale activity, and market manipulation creates a challenging environment for traders. While the long-term potential of Bitcoin remains a subject of debate, the immediate future is marked by uncertainty and the need for caution.
