BTCUSDTEntry price: 80580.9
SL: 80390.4
TP: 81139.4
Your reward must be at least 3 times greater than your risk.
As I always mention, your probability is 50%
Bitcoinprice

Bitcoin hit that 236 Fib circle I warned you about- and now ?As we come to the end of the week, we see the potential for further drop as PA slides along that 236 Fib circle. ( Red)
It NEVER ceases to amaze me how PA reacts to Fib circles and yet, as if by magic, there is some Macro News at exactly the same time
On this occasion, It seems the US inflation figures on Friday caused this Drop in price.
This Chart is the daily verion of the Weekly chart i often post about weekly candle closes.
I trust this chart
The chance for a drop to arounf 75K is very real and if that fails, down to the 2 Fib extension arounf 68K, though I think that is unlikely
We do need to watch on which side of thois Fib circle PA sits tomorrow. - Idealy, it breaks through tonight and next week candle sits on the "Support" side on the circle.
If it remains as resistance, A Steep drop is highly likely.
In my opinion.
Daily MACD is turned down, heading towards it ssignal line. If that crosses, the Daily becomes very BEARISH
We have to wait and see what happens and be ready to react.
I do have SPOT buy orders around 78 K
If we Drop Lower, I will dig up some funds and buy more lol
WE WAIT FOR WEEKKY CLOSE

BTC Volatility Play: Compression, Fib Confluence & 48% IV OptionBTCUSD | Volatility Compression Meets Macro Catalyst: Options & Technical Thesis
Chart: BTC/USD 1M (BITSTAMP)
Bitcoin is currently consolidating below all-time highs after touching the $95K level. The monthly candle structure shows the first significant pause in momentum, with price now holding around the $82,000–$84,000 range. This area represents a confluence of prior resistance-turned-support, Fib retracement zones, and the VWAP session level (~$84,910).
Technically, the long-term ascending broadening wedge remains intact. MACD is extended but positive, while RSI has cooled to approximately 62. The structure supports the thesis of short-term rebalancing before a potential continuation or breakdown. Volatility compression is evident.
Options Market Context | BTC1! (May 30, 2025 Expiry)
Implied Volatility (IV): 48.1% across strikes
Underlying Spot Price: $82,978
ATM Strike: $84,500
Theta: ~ -52 per leg (high decay environment)
Delta Cluster: Calls around 0.53–0.59, Puts around -0.41 to -0.47
Despite BTC's recent move and upcoming halving-related volatility potential, the options market is pricing in moderate movement, not extreme. This opens the door for straddles, strangles, and gamma-based strategies if volatility expands or price breaks out of range.
Breakeven Analysis: BTC Straddles (May 30, 2025)
The table below illustrates the breakeven zones and required directional moves for various straddle positions, based on total premium (call + put).
Strike Total Premium ($) Upper Breakeven ($) Lower Breakeven ($) % Move Up % Move Down
82,500 13,468 95,968 69,032 15.65% 16.81%
83,000 13,454 96,454 69,546 16.24% 16.19%
84,000 13,488 97,488 70,512 17.45% 15.04%
84,500 13,546 98,046 70,954 18.16% 14.48%
85,000 13,607 98,607 71,393 18.87% 13.97%
Interpretation:
The FWB:83K –$84.5K strikes offer the most balanced convexity. The average breakeven range requires BTC to move approximately 15%–18% in either direction by expiration to achieve profitability.
Strategy Considerations
1. Long Straddle at ATM ($84,500):
Total cost: ~$13,546
Profit potential if BTC > GETTEX:98K or < $70.9K
Ideal for traders anticipating a significant move in either direction
Vega + gamma rich; best for breakout environments
2. Directional Option Play:
Long Call at $85,000 (~$6,538) for a lower-cost breakout bet
Long Put at $82,500 (~$5,713) to lean bearish
Scaled exposure possible for either side, depending on directional bias
3. Advanced Structures (Neutral Thesis):
Short Straddle or Iron Butterfly at $84,500 to harvest premium
High decay potential, but vulnerable to directional expansion
Only suitable if anticipating range-bound behavior near-term
Final Thoughts
Bitcoin is entering a historically volatile phase post-halving with price compressing below all-time highs and implied volatility sitting at moderate levels. This convergence of technical consolidation and underpriced volatility creates a strong environment for defined-risk, high-reward trades.
Whether you favor directional breakouts or volatility-based strategies, the current setup offers clear levels, manageable risk, and strong reward-to-risk symmetry.
Chart source: BTCUSD Monthly (BITSTAMP)
Options source: CME BTC Options (May 30, 2025)

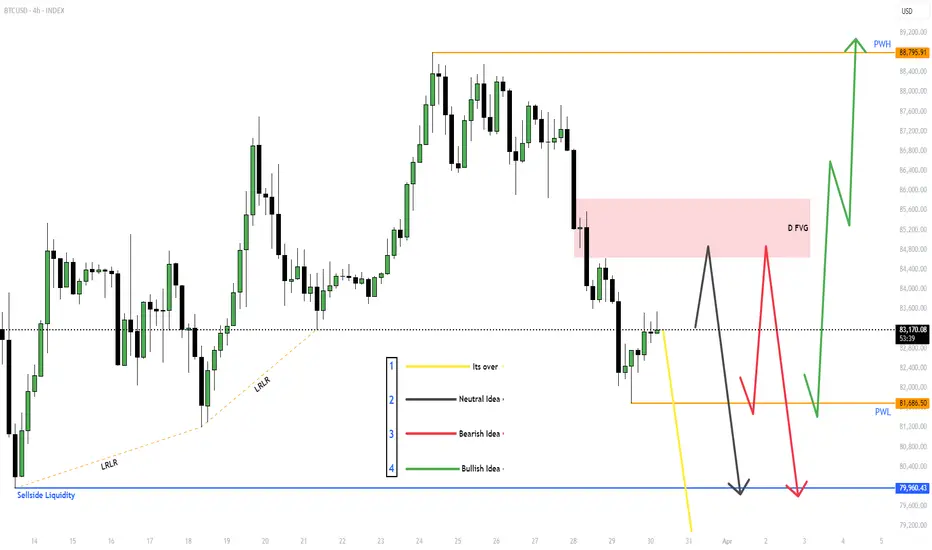
$BTC for Next week (31st March - 4th April)Given out all the ideas, Will react to the market based on which idea presents itself.
If Yellow line - Its better to stay out of the markets.
With the other wait for MSS (Market Structure Shift) and then take the trade and target the other side of the liquidity.
BITSTAMP:BTCUSD , BINANCE:BTCUSDT.P BINANCE:BTCUSDT
Overall I'm neutral on CRYPTOCAP:BTC but SEED_ALEXDRAYM_SHORTINTEREST2:NQ and NYSE:ES look bearish to me, and CRYPTOCAP:BTC could follow.
Bitcoin Price Action: Breakdown in Progress Bitcoin is showing clear signs of a breakdown from a rising wedge pattern, a classic bearish reversal structure. The chart suggests that BTC failed to sustain momentum above key moving averages and is now heading toward critical support zones.
Key Observations:
🔹 Rising Wedge Breakdown: BTC recently broke below a rising wedge, indicating potential further downside.
🔹 Moving Averages as Resistance: The 200 SMA (blue) and 50 SMA (yellow) are acting as resistance, confirming bearish momentum.
🔹 Support & Target Levels:
First Target : Around $79,845 - $78,516, aligning with previous structure support.
Second Target : $75,762 - $72,500, where strong demand could emerge.
What’s Next?
Bearish Case: If Bitcoin fails to hold the $78,000-$79,000 zone, we could see further declines toward $72,500.
Bullish Rebound: A strong bounce from support levels could push BTC back toward $85,000, but it needs to reclaim key moving averages to confirm strength.
🚨 Final Thought: Bitcoin bulls need to step in soon, or we might see deeper corrections ahead. #DeathCross

Bitcoin Squeeze Point – Breakout or Breakdown?Bitcoin is approaching a key inflection zone where the Daily Downtrend Resistance and the Monthly Uptrend Support intersect. This confluence could be setting the stage for a major breakout or breakdown, and the next move could define BTC’s medium-term trend.
🧠 Key Levels to Watch:
Daily Downtrend Resistance (Red) – Price is testing this descending trendline again.
Monthly Uptrend Support (Green) – Strong support held since August 2024.
Fibonacci 0.5 Level (~79.3K) – Acting as mid-zone control point.
Fibonacci 0.618 Golden Zone (~72K) – Strong historical retracement support.
🟦 Bullish Scenario (Blue Arrow):
If BTC breaks above the daily downtrend and holds above the green uptrend line:
Possible target: 110K, aligning with the 1.0 Fibonacci extension.
Would confirm continuation of the larger bullish trend.
🔻 Bearish Scenario (Not drawn but implied):
If BTC breaks down below 79K and the monthly trendline:
Eyes on 72K for a potential bounce at the 0.618 Fib level.
Below that, potential deeper retracement toward the 65K–60K zone.
⏳ Conclusion:
BTC is sitting at a high-confluence zone. This is not the time to chase—wait for confirmation of breakout or breakdown before reacting.

$BTC HTF IdeaLooks like the starting of "Major Correction"
If the price goes above $93k, there are chances CRYPTOCAP:BTC could make a new ATH, if not 40s seem to be the bottom before the next rally.
Neutral Thoughts.

Bitcoin(BTC/USD) Daily Chart Analysis For Week of March 28, 2025Technical Analysis and Outlook:
Bitcoin underwent several significant peaks as it completed the Interim Coin Rally 88400. Subsequently, it experienced a decline, moving towards the Mean Support 82500, with the possibility of extending its trajectory to retest the previously completed Outer Coin Rally 78700. An upward momentum may be initiated from the Mean Support of 82500 or the Key Support of 79000/completed Outer Coin Dip of 78700.

Ethereum Major Breakout Confirmed, Targeting $7800Ethereum has just confirmed a major breakout above a critical resistance zone, signaling a strong bullish continuation. Here's the detailed breakdown:
1.Ascending Triangle Breakout:
ETHUSD had been consolidating within an ascending triangle pattern since late 2024, with the upper resistance around $4000 and a rising support trendline (highlighted in yellow).
The breakout above $4000 on high volume confirms the bullish pattern, often a precursor to significant upward moves.
2. Accumulation Zone:
Prior to the breakout, ETH spent several months in an accumulation zone between $2000 and $4000. This phase allowed buyers to build positions, setting the stage for the current rally.
3. Price Targets:
The measured move of the ascending triangle (height of the pattern) projects a target around $7800. This is calculated by taking the height of the triangle (from the base at $2000 to the resistance at $4000, which is $2000) and adding it to the breakout point ($4000 + $2000 = $6000). However, considering the momentum and historical price action, the next psychological level at $7800 seems achievable.
4. Support Levels:
The previous resistance at $4000 now acts as strong support. If ETH pulls back, this level should hold to maintain the bullish structure.
Additional support lies around $3000, aligning with the 50-day moving average (not shown but inferred from typical setups).
5. Momentum Indicators:
While the chart doesn’t display specific indicators like RSI or MACD, the sharp upward move suggests strong momentum. Traders should watch for overbought conditions on RSI (above 70) as ETH approaches higher levels, which could signal a potential pullback.

BTC/USDT: Strategic Entry Points for a Potential Bullish ReversaAnalysis of Key Positions in the BTC/USDT Chart
The chart provided shows a 30-minute timeframe for Bitcoin (BTC) against Tether (USDT) on Binance. The chart includes two labeled positions ("Position 1" and "Position 2") that highlight key areas of interest for traders. Below is a detailed breakdown of these positions:
---
1. Position 1
- Location: Near the horizontal green support line, around the $83,600 level.
- Significance:
- Support Zone: This area acts as a strong support level, where the price has previously bounced back after testing it. The horizontal green line indicates that this level has held firm multiple times, suggesting it is a critical zone for buyers.
- Potential Entry Point: Traders can consider entering long positions near this support level if they believe the price will reverse higher. This is a classic "buy the dip" strategy.
- Stop-Loss Placement: To manage risk, traders should place stop-loss orders slightly below this support level (e.g., $83,200–$83,400). If the price breaks below this level, it could signal a continuation of the downtrend.
2. Position 2
- Location: Near the descending blue trendline, around the $85,000–$86,000 range.
- Significance:
- Resistance Zone: The blue trendline acts as dynamic resistance, and the price has been bouncing off this level multiple times. A breakout above this trendline would be a strong bullish signal, indicating that buyers have overcome short-term selling pressure.
- Potential Entry Point: Traders can consider entering long positions after a confirmed breakout above the trendline. A breakout is typically confirmed when the price closes above the trendline on a candlestick.
- Stop-Loss Placement: For safety, traders should place stop-loss orders just below the trendline (e.g., $84,800–$85,000). This ensures that the trade is exited if the breakout fails and the price reverses lower.
---
Comparison Between Position 1 and Position 2
- Position 1 (Near Support):
- Risk Profile: Lower risk, as it is closer to a well-defined support level.
- Reward Potential: Moderate, as the upside target would likely be the next resistance level (e.g., the trendline or Fibonacci retracement levels).
- Strategy: Suitable for traders who want to enter at a cheaper price but are willing to take on some downside risk.
- Position 2 (Near Trendline Breakout):
- Risk Profile: Higher risk, as it requires waiting for a confirmed breakout.
- Reward Potential: Higher, as a successful breakout could lead to a stronger upward move.
- Strategy: Suitable for traders who prefer confirmation before entering long positions.
---
Actionable Insights
1. For Short-Term Traders:
- Entry Strategy: Look for pullbacks to the $83,600 support level to enter long positions. Use tight stop-loss orders below the support to manage risk.
- Exit Strategy: Set profit targets based on Fibonacci retracement levels or previous highs (e.g., $85,000–$86,000).
2. For Long-Term Traders:
- Entry Strategy: Wait for a confirmed breakout above the blue trendline ($85,000–$86,000) before entering long positions. This ensures that the bullish trend is sustainable.
- Exit Strategy: Use trailing stops or take profits at key resistance levels (e.g., $87,000–$88,000).
---
Risk Management
- Always use stop-loss orders to protect against unexpected price movements.
- Consider using position sizing to limit exposure to market volatility.
- Monitor volume and momentum indicators to confirm the strength of any breakout or reversal.
---
Conclusion
The two positions highlighted in the chart provide distinct trading opportunities:
1. Position 1 (Near Support): A potential entry point for aggressive traders looking to buy the dip near $83,600.
2. Position 2 (Near Trendline Breakout): A safer entry point for traders who prefer confirmation before entering long positions near $85,000–$86,000.
By combining these positions with proper risk management and technical analysis, traders can increase their chances of success in the BTC/USDT market.
---
Final Answer: The two positions indicate key trading opportunities:
- Position 1: Near the $83,600 support level, suitable for traders willing to buy the dip.
- Position 2: Near the $85,000–$86,000 trendline breakout, ideal for traders seeking confirmation before entering long positions.

Bitcoin Daily UPDATE - something for the weekend sir ?Chances are we will see PA Drop over the weekend if what has happened today is anything to go by
As mentioned in apost this morning, Pa fgot rejected off the upper trend line of the descending channel and currently Sits on the POC ( point of control ) on the VRVP ( Vivible Range Volume Profile )
The Drop if we loose this support could be swift but we do have support lines below to try and hold up the fall
But again, as mentioned, a drop is NOT such a bad thing....unless we loose 73K, in which case I will seriously think again about what I Hold.
The 4 hour chart shows the current situation more clearly
If we do bounce of this, remain cautious....we need to get over and Hold 91K before we start screaming "ATH"
For me, I have opened anotehr Spot order at 74K
I go higher than the expected Low incase the visit to the low is a Very quick wick down and the order does not have time to fill.
DO NOT PANIC
Have a good Weekend

Alternatively, Bitcoin just Drops to 73K in the near future In a slight contradiction to my previous post - as I like to consider ALL options and present them to you, so YOU can make up your own mind.
I saya SLight contradiction, as 73K is Still the target here.
See this channel AP is in? The descending channel we been in for a while.
We seem to be getting rejected off the upper trend line.
The lower line crosses the 1 Fib extension and Hits the rising Long term support around 73K
We do have Support just below the Current PA position on the POC ( Point of control) of the VRVP
So, Hang on and we wait to see what happens.
If PA returns to 78K and then 73K - DO NOT PANIC
This would be SUPERB buying opportunities
So, Consider all the possibilities I have sugested today, Make up your own minds and, if you want to, please do leave a comment

Bitcoin's Current Structure Is Definitely DIFFERENTBitcoin's Market structure is definitely different this cycle.
But why?
In this video we'll discuss just that and what it might mean.

a posible bearish move or continouus bullish move on BTCUSDa possible bear or bull movement; if it bounce back from the current position, then it might continue the bull move but if the breaks don happen, then it might be going for the next support

Bitcoin -potential to 91K, back to 78K wick to 73K and THEN -->>In this cycle, since the push up from the Low in Jan 2023, we have had 2 other Major pushes.
Each of these came off the Rising line of support that we are currently heading towards again, with the date of "Touch" currently in Mid June.
If we rise and stay back in the higher Range Box, that date is even later in the year ( around Mid Q4 )
As I have talked about many times, I am watching the MACD as the "trigger".
The chart below is the Weekly MACD
We reach Neutral , if we continue current rate of descent, around end of April
This is obviously before we would hit the line of support being talked about above.
That leaves 2 possibilities.
1) - MACD may drop below Neutral
2) - We may see a bounce from PA but NOT to a New ATH
If you look back at previous range we had in 2024, there was a bounce there.
See how the Histogram went White as we had that bounce
We Just had a white bar on the histogram .
Will we see another White bar next week and a further rise in PA
Top of current Range box in 91K - We could head to that again, Drop back to the Low around 78K and then we would be ready. This would be over the next 3 - 6 weeks
78K is the Price that touches that line of support the soonest, in early June
Why could we go back down?
For the reasons above regarding the MACD BUT ALSO ;-
There are things called FAIR VALUE GAPS (FVG)
. These gaps highlight market inefficiencies and potential trading opportunities, allowing traders to anticipate price movements and confirm trends.
That area just below Current PA on this weekly chart is the FVG that goes down to 73K
It is NOT guaranteed that PA will revisit that area but while we sit so close, the potential exists
But something to note, that could be benifical is that Should PA Drop to Fill that Gap, PA could hit that line of support earlier than Mid June..infact, it would be a month earlier and be in Mid May.
So, I can see the potential for a push higher in the near future, to extend MACD, then a drop back to the range Lows, a Sharp wick down to around 73K and THEN a sustained push higher...
This is just an idea.....No guarantees...But it does have Potential
We will see - Time will tell...........

BTC/USDT - The moment of truthThe BTC/USDT chart highlights a crucial moment as the price breaks out of a bearish trendline and tests a Fair Value Gap (FVG) zone. Key scenarios include:
- A potential continuation of the bullish trend if the price successfully holds above the FVG zone and confirms support.
- Alternatively, a rejection at this level could signal a return to bearish momentum.
Keep an eye on price action within the FVG zone for confirmation of the next move. Which way do you see BTC heading?

Is Bitcoin slowly forming a top? What to expect from the market About a week ago, I posted that the recent uptick in BTC (and the broader crypto market) was as a result of Bears taking profits and that the market will dip lower once this correction runs its duration. Well, so far, my prediction is still on track and we can expect prices to climb higher over the next few days (maybe even a week from when this is published).
I believe that that mini rally (black path) within the larger uptrend (green path) has enough juice for one more leg before it pulls back. Once that happens, price might stall around that area and then push higher, setting the stage for the final leg of the larger upswing.
I personally don't like trading matket correction unless they're on the weekly or monthly chart. However, I will keep monitoring price until my prediction plays out.
What are your predictions for Bitcoin's short term price? Let me know in the comments section below.
Make sure you follow me to get future updates as they unfold.

Bitcoin Stalls Below $90,000 as Buying Pressure WeakensThe last four trading sessions for Bitcoin (BTC) have been fairly neutral, with the cryptocurrency fluctuating by around 2% , staying just below the critical $90,000 resistance level. The current uncertainty in the market is mainly driven by the renewed trade war narrative, following Trump’s recent comments about imposing tariffs on cars and auto parts. These statements have once again elevated global economic concerns, prompting investors to avoid risk assets in the short term — a category that includes Bitcoin. As long as this uncertainty persists, this neutral behavior could remain a defining feature of BTC in upcoming sessions.
Key Bearish Channel in Play
Since January 20, a notable bearish channel has taken shape, favoring selling pressure and driving BTC down to $77,000 in recent weeks. At present, the price is testing the upper boundary of the channel, but recent buying attempts have not been strong enough to trigger a breakout.
RSI Indicator
The RSI line initially showed a strong upward slope, but this momentum has faded as the indicator approaches the neutral 50 line, suggesting a balance between buyers and sellers. This reinforces the resistance posed by the upper edge of the bearish channel.
MACD Indicator
A similar situation is developing in the MACD, where the histogram has begun to decline steadily, nearing the zero line. This behavior points to a lack of strength in the moving average trends and may indicate that neutrality could continue to dominate BTC price action in the near term.
Key Levels:
$98,900 – Distant resistance: This level sits near the mid-range zone of a large sideways range observed in previous weeks. A bullish move toward this area could revive the forgotten bullish bias and reestablish the importance of the broader lateral structure.
$90,000 – Major resistance: Arguably the most relevant resistance zone at the moment. It aligns with the Ichimoku cloud and the upper limit of the current bearish channel. A breakout above this level could jeopardize the prevailing downtrend and introduce a strong bullish momentum.
$78,600 – Key support: This level marks the recent low for BTC. If the price drops back to this zone, it could provide confirmation for the continuation of the bearish channel.
By Julian Pineda, CFA – Market Analyst

Trading opportunity for Bitcoin BTCUSDT Based on technical factors there is a Buy position in :
📊 BTCUSDT
🔵 Buy Now
🪫Stop loss 85000.00
🔋Target 93000.00
📏 R/R 2,1
💸RISK : 1%
We hope it is profitable for you ❤️
Please support our activity with your likes👍 and comments📝

Bitcoin - Please Just Listen To The Charts!Bitcoin ( CRYPTO:BTCUSD ) remains in a bullish market:
Click chart above to see the detailed analysis👆🏻
Despite literally everybody freaking out about cryptos lately, big brother Bitcoin is still creating bullish market structure. During every past cycle we witnessed a correction of at least -20% before we then saw a parabolic rally. So far, Bitcoin is just doing its normal "volatility thing".
Levels to watch: 70.000, $300.000
Keep your long term vision,
Philip (BasicTrading)

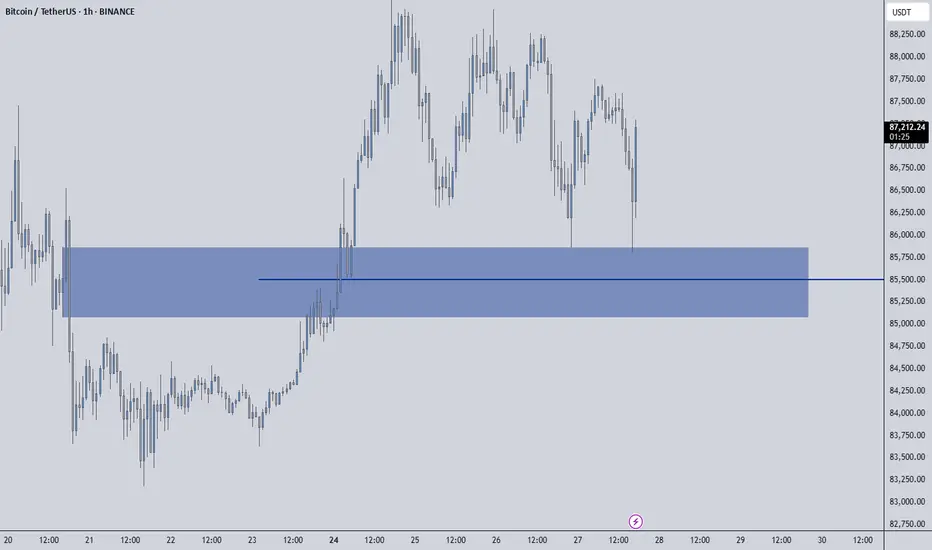
BTCUSDT - Low Time Frame Support Level I believe that BTCUSDT is at a critical level right now, and this blue box combined with the blue line is where we could see some price reaction. However, don't expect a major move, this is a low timeframe zone that might only give us smaller, more precise opportunities.
🔹 What To Watch For:
Reaction Potential: If the price touches this blue box and blue line, there may be a short-term reaction, but don't overestimate it.
Low Timeframe Focus: Keep an eye on the lower timeframes for breakouts or rejections around these areas.
Patience Is Key: This isn't a large move zone, so we will wait for confirmation before acting.
💡 Stay Smart: Always trade with confirmation. If the price moves fast and unexpectedly, we won't chase it. Stay in control, and wait for the right signals!
📌I keep my charts clean and simple because I believe clarity leads to better decisions.
📌My approach is built on years of experience and a solid track record. I don’t claim to know it all but I’m confident in my ability to spot high-probability setups.
📌If you would like to learn how to use the heatmap, cumulative volume delta and volume footprint techniques that I use below to determine very accurate demand regions, you can send me a private message. I help anyone who wants it completely free of charge.
🔑I have a long list of my proven technique below:
🎯 ZENUSDT.P: Patience & Profitability | %230 Reaction from the Sniper Entry
🐶 DOGEUSDT.P: Next Move
🎨 RENDERUSDT.P: Opportunity of the Month
💎 ETHUSDT.P: Where to Retrace
🟢 BNBUSDT.P: Potential Surge
📊 BTC Dominance: Reaction Zone
🌊 WAVESUSDT.P: Demand Zone Potential
🟣 UNIUSDT.P: Long-Term Trade
🔵 XRPUSDT.P: Entry Zones
🔗 LINKUSDT.P: Follow The River
📈 BTCUSDT.P: Two Key Demand Zones
🟩 POLUSDT: Bullish Momentum
🌟 PENDLEUSDT.P: Where Opportunity Meets Precision
🔥 BTCUSDT.P: Liquidation of Highly Leveraged Longs
🌊 SOLUSDT.P: SOL's Dip - Your Opportunity
🐸 1000PEPEUSDT.P: Prime Bounce Zone Unlocked
🚀 ETHUSDT.P: Set to Explode - Don't Miss This Game Changer
🤖 IQUSDT: Smart Plan
⚡️ PONDUSDT: A Trade Not Taken Is Better Than a Losing One
💼 STMXUSDT: 2 Buying Areas
🐢 TURBOUSDT: Buy Zones and Buyer Presence
🌍 ICPUSDT.P: Massive Upside Potential | Check the Trade Update For Seeing Results
🟠 IDEXUSDT: Spot Buy Area | %26 Profit if You Trade with MSB
📌 USUALUSDT: Buyers Are Active + %70 Profit in Total
🌟 FORTHUSDT: Sniper Entry +%26 Reaction
🐳 QKCUSDT: Sniper Entry +%57 Reaction
📊 BTC.D: Retest of Key Area Highly Likely
📊 XNOUSDT %80 Reaction with a Simple Blue Box!
📊 BELUSDT Amazing %120 Reaction!
I stopped adding to the list because it's kinda tiring to add 5-10 charts in every move but you can check my profile and see that it goes on..
BTC/USDT Analysis: Local Buyer AggressionYesterday, Bitcoin continued its downward movement. At one point, after breaking the local level of $86,300, buyers defended the price, pushing it back into a narrow range.
Currently, it's worth noting the repeated defense at around $86,700, where a significant buyer volume has accumulated (as indicated by the positive delta in that bar). Given this, we may see a retest of the local high from the current levels.
Despite this, the primary scenario remains a correction toward the sell zones. This is supported by the nature of the current uptrend, characterized by weak new highs, as well as selling pressure reflected in the delta.
An alternative scenario would be a full breakout of the current high on strong volume, which could indicate a continuation of the trend.
Sell Zones:
$95,000-$96,700 (accumulated volumes)
$97,500-$98,400 (pushing volumes)
$107,000–$109,000 (volume anomalies)
Buy Zones:
$84,400-$82,900 (accumulated volumes)
$77,000-$73,000 (volume anomalies, pushing volumes)

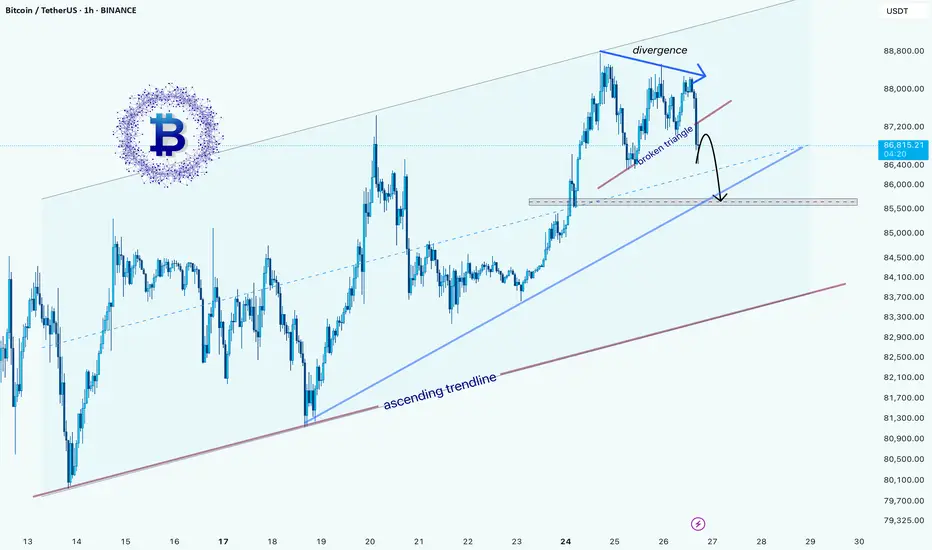
Bitcoin Price Analysis: Potential Correction Ahead?hello guys
The Bitcoin/USDT chart shows an ascending channel with recent price action forming a divergence at the top, indicating potential weakening momentum. A bearish breakout from a smaller triangle suggests a short-term correction. The price may test the ascending trendline around $85,400, where a key support zone exists. If this level fails, a deeper correction toward the major support area around $76,800 could follow. However, if Bitcoin holds above the trendline, the uptrend could resume.
Traders should watch price action around the $85,400 level for confirmation of further downside or a potential bounce.