BITCOIN HAS TO BREAK LONG TERM TREND by DEC - SQUEEZE APEX DECI have posted this before and I post it again now, just months away from a CRUCIAL point for Bitcoin PA
As with any time scale trading chart, An Apex is a point of reaction. PA usualy reacts BEFORE the Apex is met.
This Giant Apex is in DEC 2025
Every single ATH in the life span of Bitcoin has been rejected by the Arc of Resistance that is overhead.
We can also see how from the ATH in 2011, a trend line was formed that has acted as Support ever since 2012. PA has never dropped below this line.
So, as you can see, PA has been in a diminishing "Sandwich" and Now, we are coming to the Crunch
We can see how the ATH's have been a reducing % Rise ever since this point also.
And you will notice how this number on the chart reduces each time, even though the real value is increasing.
Low to ATH A ( ATH 2011) - 3,465,178%
Low to ATH B ( ATH 2013) - 49,670 %
Low to ATH C ( ATH 2017) - 9,865 %
Low to ATH D ( ATH 2021) - 2,148 %
E is not over yet but coing on current ATH we have
Low to ATH E ( ATH 2025) - 575 %
So, you see the reduction of % rise, held back all along by the ARC Of RESISTANCE
What is interesting, is that since PA has been in the chanel formed in 2011, when comapred to each other, we have been seeing a rise of 20% of the previous rise ( on average )
This closer chart shows you this in more detail
I will ignoew the A - B as thia is out of channel
C-B = 19.6 %
D-C = 21.77 %
Currently E-D = 26.7 %
As you can see, we are currently OVER that average % Rise.
And we are also heading into a tight APEX in Dec.
The expected 200K ATH this cycle will take us out of the pattern, out of the Apex and out of the 20 % average rise of previousl
This really is CRUNCH TIME for Bitcoin
The REALLY interesting thing is, What would be Next ?
This would break the Cycle routine.
We may already have broken that as described in previous charts of mine from years ago
But what IS Certain is that something HAS to happen.
This Cycle ATH will reveal a HUGE amount but we have yto Wait and see what will happen
Bitcoinprice

Bitcoin <> Gold Correlation: Bullish for Bitcoin? I’ve been diving deep into the relationship between Bitcoin and Gold, and based on my analysis, I’m setting a price target of $100,000 to $105,000 for Bitcoin over the next couple of months.
Why?
The correlation coefficient between BITSTAMP:BTCUSD and TVC:GOLD is 0.84, which indicates a strong, beautiful correlation.
As you can observe in the chart, Bitcoin and gold price movements converge over time, building on the current correlation.
This leaves us with 2 options:
a) Gold price drops to meet the recent BTC decline
b) BTC rises to meet gold's recent surge 👀
c) BTC and gold meet in the middle
Given the long-term trend and the adoption of Bitcoin by US institutions and the government, I see option B as the most likely to happen. In this case, then, I see Bitcoin getting somewhere close to $105,000 over the next few months. This can mean a 25% uptick in BTC, totally within normal BTC price ranges.

Btc (bitcoin): formed a head and shouldershello guys.
As you can see, btc hunted the last low!
On the other hand, it formed a head and shoulders.
there are two entries: the neckline and the origin of the last move!
The target: $89500

Bitcoin(BTC/USD) Daily Chart Analysis For Week of March 21, 2025Technical Analysis and Outlook:
This week's trading session demonstrated considerable volatility in Bitcoin's price action. The cryptocurrency made multiple attempts to attain our Interim Coin Rally 88400, yet it ultimately remained at the same level as the week commenced. The current analysis suggests that Bitcoin must reach our Mean Support of 82500 before initiating an upward progression aimed at the Interim Coin Rally of 88400 through the Mean Resistance of 87000. Furthermore, a retest of the completed Outer Coin Dip 78700 is essential before the emergence of a significant rally.

The Current State of Bitcoin on the CME Futures ChartAs we analyze the current state of Bitcoin on the CME Futures chart, it's clear that a mixture of market forces and investor sentiment is playing out in an intriguing way. Looking at the Commitment of Traders (COT) index, we can observe a distinct divergence in the positioning of different market participants: commercials, retail traders, and fund managers.
Commercials: Bearish but Accumulating Over-the-Counter
Commercials, who are typically large institutions and market makers, continue to hold a bearish stance on Bitcoin in the futures market. This suggests that they are still not convinced of Bitcoin’s long-term price sustainability, likely reflecting a cautious outlook amid broader macroeconomic uncertainty. However, what stands out is their behavior in the over-the-counter (OTC) market. Despite their bearish position in the futures market, these same entities are accumulating Bitcoin in the OTC market. This suggests that while they might be hedging against short-term volatility, they still recognize Bitcoin's potential value or see it as a long-term store of value, allowing them to position themselves for future upside.
Retail Traders: Fearful and Bearish
Retail traders, on the other hand, have a far more pessimistic view of Bitcoin at the moment. With a lot of fear circulating in the market, many smaller traders are hesitant and have adopted bearish positions. This fear is compounded by the volatility that has become characteristic of the cryptocurrency market, alongside the macroeconomic challenges in traditional markets. Retail traders’ bearishness is a sign of market uncertainty and can often present opportunities for those who can see past short-term price movements. It is also indicative of the emotional influence that sentiment, such as fear, can have on the broader market.
Fund Managers: Extremely Bullish
In stark contrast to both the commercials and retail traders, fund managers are incredibly bullish on Bitcoin. They see the cryptocurrency as a valuable asset, particularly in the context of diversification and inflation hedging. The strong bullish positioning of fund managers indicates that institutional interest in Bitcoin is growing. These larger investors, likely driven by long-term growth prospects and the increasing recognition of Bitcoin as digital gold, remain optimistic about its potential. Their strong positions also suggest a belief in the fundamental value of Bitcoin and its resilience in the face of market turbulence.
Conclusion: A Complex Market Sentiment
The current state of Bitcoin futures on the CME reveals a market characterized by stark contrasts. Commercials are hedging their bets with a bearish outlook in the futures market while accumulating Bitcoin over-the-counter. Retail traders are fearful and bearish, showing caution amid uncertain market conditions. Meanwhile, fund managers stand in stark contrast, displaying strong bullishness, likely driven by the long-term potential of Bitcoin. This divergence of sentiment suggests that the market is at a crossroads, with various players taking different approaches based on their time horizon, risk appetite, and views on Bitcoin's role in the financial system.
In the short term, volatility and fear could dominate, but the long-term bullish positioning of institutional players may point toward a stronger future for Bitcoin as the market matures.

Explanation Why Bitcoin BTC Bull Run Is not Over YetHello, Skyrexians!
Time to update BINANCE:BTCUSDT huge analysis. Market became bigger and it needs more rime to form bull and bear stages. Now everyone is waiting for the bear market because it was every time, but this time it will be tricky for retailers.
Let's take a look at the 2 week time frame. If we apply our Fractal Trend Detector to this chart we can see that Bitcoin is still in the green zone and now is inside the huge support area. If it will be held we will see the following Elliott waves scenario where wave 3 will reach at least $144k. Awesome Oscillator also gives us a hint that it's still not over. The entire bull market will be finished only in the middle of 2026.
Best regards,
Skyrexio Team
___________________________________________________________
Please, boost this article and subscribe our page if you like analysis!

Global Tensions, Market Manipulation, and BTC Uncertainty The cryptocurrency market, a realm notorious for its volatility, is currently grappling with a confluence of factors that are forcing investors to reassess their strategies. Global trade tensions, macroeconomic uncertainties, and the intricate dance of market manipulation are all contributing to a complex and unpredictable landscape. Specifically, Bitcoin, the flagship cryptocurrency, is experiencing a period of intense scrutiny, with analysts offering a range of perspectives on its potential future.
A recurring theme in recent analyses is the notion of "whale manipulation." Reports suggest that large holders, or "whales," are engaging in strategic trades on exchanges like Binance to influence Bitcoin's price. This "liquidity massaging" is seen as a deliberate attempt to create artificial price ceilings, with some analysts predicting that Bitcoin's upward momentum could be capped below $90,000, and more conservatively, $87.5K. Such manipulations introduce uncertainty, making it difficult to discern genuine market sentiment from artificially inflated or deflated prices.
Adding to the complexity is the debate surrounding retail investor participation. Contrary to the prevailing narrative of retail investors being absent, some crypto executives argue that they are already actively involved. This perspective challenges the notion that a surge in retail interest is needed to propel Bitcoin to new heights. If retail participation is already significant, the anticipated catalyst for a bull run may have already materialized, leaving investors to wonder what new catalyst is needed for further price appreciation.
Data from Bitcoin's Realized Cap and UTXO (Unspent Transaction Output) analysis is also signaling a "major shift." These metrics, which offer insights into the actual value stored within the Bitcoin network and the movement of coins, are crucial for understanding the underlying health of the market. Changes in these indicators can foreshadow significant price movements and shifts in investor behavior. Traders are closely monitoring these metrics for clues about Bitcoin's future direction.
However, despite recent attempts to pare losses, Bitcoin is struggling to maintain a consistent uptrend. This instability has led some traders to adopt a bearish stance, with predictions of a potential drop to as low as $65,000. These bearish sentiments are fueled by the inability of Bitcoin to decisively break through resistance levels and the persistent volatility that characterizes the current market.
Conversely, some analysts are finding bullish signals by examining indicators that also correlate with the Nasdaq. The correlation between traditional financial markets and the cryptocurrency space has become increasingly evident, and analyzing these relationships can provide valuable insights. If the Nasdaq shows signs of strength, it could potentially buoy Bitcoin's price. However, this correlation is not always consistent, and the inherent volatility of both markets can lead to unpredictable outcomes.
The performance of U.S. spot Bitcoin ETFs is another critical factor influencing market dynamics. The collapse of the "cash-and-carry" trade, a popular arbitrage strategy, has had significant implications for investors. The stagnation of inflows into these ETFs, compared to the initial surge earlier in 2024, has raised concerns about the sustainability of institutional interest. While there have been recent reports of net inflows returning, questions remain if this is a temporary blip, or a sustained uptrend. This fluctuation in ETF inflow signals a wavering confidence from institutional players.
The combination of these factors creates a challenging environment for investors. Global trade tensions, which can disrupt economic stability and investor sentiment, add another layer of uncertainty. Fluctuations in traditional markets, geopolitical events, and regulatory developments can all have a ripple effect on the cryptocurrency market.
In this tumultuous landscape, investors are advised to exercise caution and adopt a diversified approach. Relying solely on technical analysis or market sentiment can be risky. Instead, a comprehensive strategy that incorporates fundamental analysis, risk management, and a deep understanding of market dynamics is essential.
The current situation highlights the inherent volatility and complexity of the cryptocurrency market. While Bitcoin remains a dominant force, its future trajectory is far from certain. The interplay of whale manipulation, retail participation, technical indicators, and macroeconomic factors creates a dynamic and unpredictable environment. Investors must remain vigilant, adapt to changing conditions, and prioritize risk management to navigate this challenging terrain successfully.

BTC Showdown: Smash 84,700 for a Rocket Ride to 93KMorning, trading peeps! BTC’s at a crossroads – if we punch through 84,700, we’re looking at a sweet climb to 88K or even 93K. But if we slip below 83,500 and close there, brace yourselves for a dip to 76,300 or lower. Let’s see where this ride takes us today!
Kris/Mindbloome Exchange
Trade Smarter Live Better

Bitcoin April 2025 Forecast - Bullish Continuation, or Bearish?Here is a simple visualization of the decision time coming up for BTC, where trendline support meets trendline resistance, with decision time around the middle of May. Break to the upside would target $150K, with a break to the downside sending us into $40K panic selling levels. I am leaning more towards the bullish continuation scenario, but we will have to wait and see.
GL, hit thumbs up.

BTC/USDT Analysis. Yesterday’s scenario remains validBitcoin eventually tested the local buyer zone at $84,800–$83,500 (pushing volumes). Throughout the day, price has been consolidating within this range with reduced volatility. Meanwhile, the cumulative delta continues to break its lows, indicating an imbalance and absorption of market sell orders.
The primary scenario suggests a continuation of the upward movement toward $90,000–$93,000. This scenario will be invalidated if price secures a foothold below the current buyer zone, in which case a full retest of last week’s low is likely.
Sell Zones:
$95,000–$96,700 (accumulated volumes)
$97,500–$98,400 (pushing volumes)
$107,000–$109,000 (volume anomalies)
Buy Zones:
$84,800–$83,500 (pushing volumes)
$77,000–$73,000 (volume anomalies, pushing volumes)

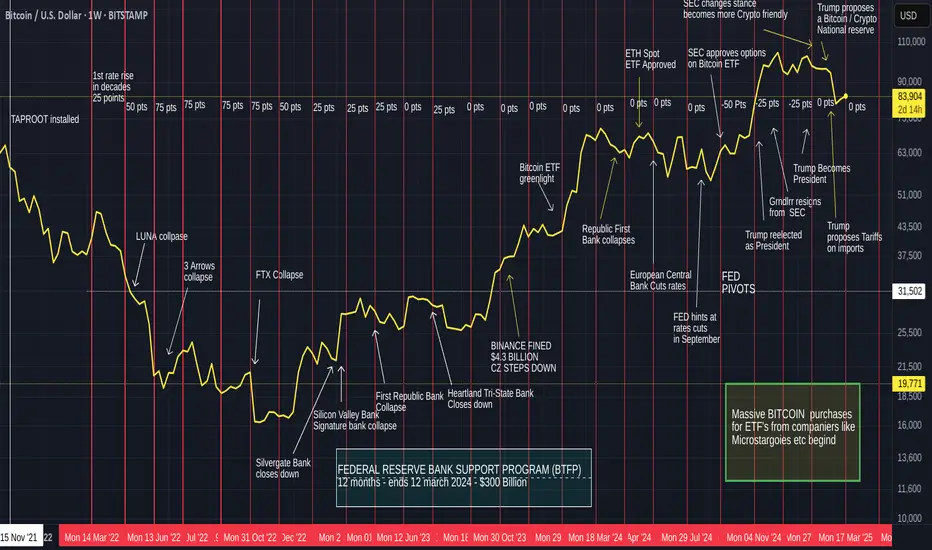
Bitcoin, interest rate effects, Macro events since 2021 - UPDATEThere is one very simple takeaway for me from this chart and that is simply that raises and Lowering of interest rates had Very little Effect on Bitcoin
It is more the effect it had on other organisations and the sentiment that followed Bitcoin and the traders.
For instance, From Jan 2023, when we saw Bitcoin begin its recovery, interest rates continued to rise.....and had NO effect on the Bitcoin recovery
And I think this continues to this day.
After the First push higher by Bitcoin in 2023, PA went into a Long range...in this time, interest rates began remaining at a static level. Bitcoin did not rise because of this.
When BTC was ready, it made a push higher again, interest rates were static and remained so while BTC entered another long range in 2024
It could be said that BTC PA rose once Rates were reduced but PA leveled out again even while the next rates decision was to reduce.
Bitcoin has its own agenda, it is NOT dependant on the USA to control its choices
On Each range, the MACD on the weekly timef rames was OVERBOUGHT.
And it is currently resetting having been overbought again.
This s NOTHING to do with interest rates.
MACRO events do have an impact though and we need to pay attention this this
But over all, Bitcoin is GOOD, BULLISH and getting ready for its next push
Have a Nice day now
(BTC/USD) – Rising Wedge Pattern - Critical Breakout Setup🔍 Market Overview & Technical Breakdown
Bitcoin (BTC/USD) is currently forming a rising wedge pattern on the 4-hour timeframe, which is a bearish signal indicating a potential reversal. The price action shows higher highs and higher lows, but the narrowing wedge suggests that buying momentum is weakening.
BTC has been battling a major resistance zone around $85,000 - $87,500, struggling to break higher. If Bitcoin fails to hold above the key support level at $80,000, we could see a strong downside move. However, if BTC breaks the upper resistance, the bearish setup may be invalidated, opening the door for a push toward $95,000+.
📉 Rising Wedge Pattern (Bearish Formation)
A rising wedge occurs when the price moves upward within two converging trendlines, making higher highs and higher lows but with a weakening bullish momentum. This pattern often breaks downward, leading to a sharp sell-off.
Characteristics of This Wedge Formation:
✅ Upward Sloping Support & Resistance Lines: BTC is trending higher, but the slope is narrowing, showing a loss of bullish strength.
✅ Decreasing Volume: Volume is declining as price moves higher, indicating buyers are losing control.
✅ Bearish Breakout Probability: Rising wedges typically break down 75% of the time, suggesting a high likelihood of a drop below support.
🔑 Key Levels to Watch
🔺 Resistance Zones (Potential Breakout Levels)
1️⃣ $85,000 - $87,500 → Strong resistance; BTC has repeatedly failed to break above.
2️⃣ $90,000+ → A confirmed breakout would invalidate the wedge and shift the trend bullish.
3️⃣ $107,000 Target → If BTC breaks above resistance, we could see a move toward the psychological $100,000 - $107,000 level.
🔻 Support Levels (Bearish Breakdown Zones)
1️⃣ $80,000 - $82,000 → Key support within the wedge; a breakdown confirms the bearish move.
2️⃣ $75,000 → Strong historical demand zone; BTC could bounce here if it drops.
3️⃣ $70,000 and Below → Ultimate bearish target if selling pressure accelerates.
📈 Bullish vs. Bearish Scenarios
⚠️ Bearish Scenario (Rising Wedge Breakdown)
🔴 Entry: Below $80,000 (confirmed breakdown).
📉 Stop-Loss: Above $83,500 (to avoid fakeouts).
🎯 Take-Profit Targets:
TP1: $78,000
TP2: $75,000
TP3: $70,000
🔹 Confirmation: Look for increased selling volume and a retest of $80,000 as resistance after breakdown.
🚀 Bullish Scenario (Breakout Above Resistance)
✅ Entry: Above $87,500, confirming bullish momentum.
📉 Stop-Loss: Below $85,000 (to minimize risk).
🎯 Take-Profit Targets:
TP1: $90,000
TP2: $95,000
TP3: $107,000
🔹 Confirmation: BTC must break the wedge’s upper boundary with strong volume for bullish continuation.
📊 Technical Indicators & Market Sentiment
🔵 RSI (Relative Strength Index)
Currently near 60 – Showing bullish momentum but not yet overbought.
A move above 70 could signal an overbought market and potential reversal.
🔴 Volume Profile
Volume is decreasing as BTC rises, suggesting a possible exhaustion of buying power.
A breakout should be accompanied by strong volume to confirm bullish strength.
🟢 Moving Averages (EMA & SMA)
BTC is trading above key EMAs (50 & 200), supporting the bullish case.
A breakdown below the 50 EMA could accelerate selling pressure.
📢 Final Thoughts: High-Risk, High-Reward Setup
🚨 BTC is at a critical decision point! The rising wedge pattern suggests a bearish reversal, but confirmation is needed. If BTC breaks below $80K, expect a strong sell-off. However, if bulls manage to break above resistance, BTC could rally toward $100K+.
🔹 Risk Management Tip:
✅ Always wait for confirmation before entering a trade.
✅ Use stop-losses to protect your capital.
✅ Monitor volume & key levels for stronger trade signals.
🔥 What’s your take on this setup? Will BTC break down or push higher? Let’s discuss in the comments! 👇

BITCOIN AFTER FOMC MEETING - IN HINDIIn this video i try to share btc short n long term move after fomc meeting.
detail analysis in english i will share soon.

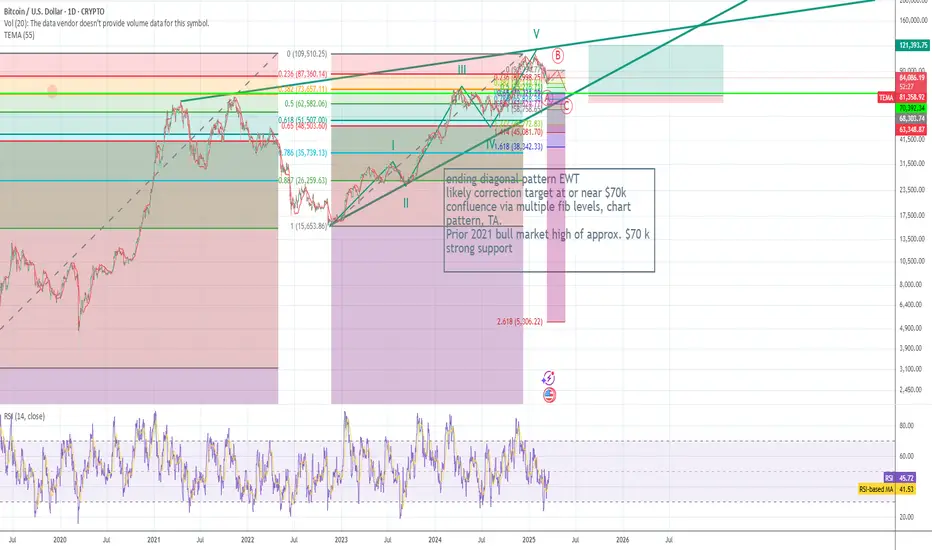
short opportunity playing out for BTCplease see chart with relevant fib levels, strong support around $70k- FWB:73K where target 1 is. Confluence with current price action, fib levels, projected fib levels of recent move with likely 1.618 target for c wave down

BTC long opp continuation of prior trade ideas at $70kplease see chart text for greater details. Multiple confluence indicating btc will correct to approx $70k area. Strong prior support from 2021 bull market. Fib projection levels and ABC elliott wave correction.
BTC Whales Stir, Trump's Crypto Push, and the Path to $85,000
Bitcoin's recent price action has ignited a renewed sense of optimism within the crypto community. A confluence of factors, ranging from whale activity and political pronouncements to macroeconomic indicators and regulatory developments, is shaping the current market narrative.
Whale Activity: A Harbinger of Bullish Momentum?
The resurgence of Bitcoin whale activity is a significant indicator that has captured the attention of traders and analysts. Large-scale Bitcoin holders, often referred to as "whales," possess the capacity to significantly influence market dynamics.1 Their accumulation of Bitcoin can signal strong conviction and potentially trigger broader market rallies. The recent uptick in whale activity suggests a renewed interest in Bitcoin among these major players, potentially laying the foundation for a sustained upward trend. This can be viewed as the building of a strong base of long positions.
Political Winds: Trump's Crypto Pronouncements and Market Sentiment
Political discourse has increasingly intersected with the cryptocurrency market, with recent statements from a prominent political figure influencing market sentiment. Rhetoric emphasizing the United States as a "Bitcoin superpower" has undeniably contributed to bullish momentum. This political articulation of a crypto-friendly approach signals potential policy shifts and improved regulatory clarity, both crucial factors in attracting institutional investment. Market participants are interpreting this as a sign of acceptance, if not outright endorsement, of digital assets at the highest levels.
It is worth noting that consistent pronouncements regarding the US becoming the "crypto capital of the world," while driving short term volatility, need to be followed with legislative action for long term impact.
Macroeconomic Factors: Fed Policies and Inflationary Concerns
The Federal Reserve's monetary policy and the evolving narrative surrounding inflation play a pivotal role in shaping Bitcoin's trajectory. Recent indications from the Fed regarding continued rate cuts, despite persistent inflationary pressures, have boosted investor confidence. This stance, coupled with Powell's assessment of certain inflationary factors, such as tariffs, as "transitory," has provided much-needed relief to risk assets, including Bitcoin. This monetary policy creates a favorable environment for investment. The combination of Fed policy confirmation and rumors of "significant updates" to US crypto plans have driven Bitcoin to new two-week highs.
Technical Analysis: The $85,000 Threshold and Beyond
From a technical perspective, Bitcoin's ability to reclaim the $85,000 level is considered a crucial milestone. Surpassing this threshold would validate the current bullish momentum and potentially pave the way for further gains. Analysts are closely monitoring key support and resistance levels to gauge the strength of the ongoing rally. The return of significant volume combined with the price retaking old highs lends to an increasingly bullish sentiment.
BlackRock's prediction of a price shift ahead indicates a growing acceptance of Bitcoin as a mainstream asset, potentially aligning it with traditional Wall Street investments.2 These kinds of comments indicate an institutional bullish long-term perspective.
Regulatory Clarity: Ripple's Resolution and Its Impact on Bitcoin
The resolution of Ripple's legal battle with the SEC has sent ripples (pun intended) throughout the cryptocurrency market. This development has provided much-needed regulatory clarity, bolstering investor confidence and fostering a more favorable environment for digital assets. The jump in XRP's price after confirmation of the case coming to an end further exemplifies the markets sensitivity to regulatory action. This resolution will influence Bitcoin’s adoption rates, as investors now know the US regulatory stance may be moderating.
Options Market Sentiment: A Shift Towards Bullishness
The Bitcoin options market has exhibited a noticeable shift towards bullishness, particularly after Powell's "transitory inflation" remarks. This sentiment reflects increased optimism among traders and investors, potentially signaling a sustained uptrend. An increased amount of bullish options being written displays further faith in the rise of Bitcoin’s price.
Bitcoin's Volatility: Navigating the Uncertainty
Despite the positive developments, Bitcoin remains inherently volatile. Price swings, driven by a combination of market sentiment, news events, and technical factors, are to be expected. Investors should remain vigilant and exercise prudent risk management strategies. While large volume and long term political promises are strong positive indicators, there are still volatile short term swings to consider.
Looking Ahead: The Potential for a Sustained Rally
The convergence of positive catalysts, including whale activity, political support, macroeconomic factors, and regulatory clarity, paints a potentially bullish picture for Bitcoin. However, the cryptocurrency market is subject to rapid shifts, and unforeseen events can significantly impact price movements.
To conclude, the present environment is ripe for sustained Bitcoin price discovery. The political and macroeconomic climates are aligning, coupled with increased whale activity and regulatory clarity. While markets will remain volatile, the trend is looking increasingly bullish.

The best investment since Nov 2021 - GOLD or BITCOIN ? - FACTSThe Main Chart is the chart from BITFINEX that trades Bitcoin to Gold DIRECTLY
I look to this often and find it a MUST See to compare the two assets.
This is Not done to try and make BTC like GOLD but that they are both investments with returns,
It is as simple as that
But which one has the higher return ?
I have taken the November 2021 Bitcoin ATH as the Datum point. a Worse case scenario for Bitcoin.
Bitcoin Directly to Gold.
As you can see on the main chart. If you had sold your Gold into Bitcoin and Just Held since Nov 2021, you are currently at a slight loss. Less ounces of Gold to one Bitcoin.
It is as simple as that. But PA has fallen from Above the buy price recently.
But to also mention, if you had bought Bitcoin with your Gold at the Bottom in Jan 2023, that is a 360% Rise in Value DIRECTLY OVER GOLD as opposed to the -75% Losses from ATH to Low.
Nothing else does that
Lets look at a comparison Via 100 USD investments into each asset
GOLD USD CFD
Let us say we invested 100 usd in Nov 2021 at the Bitcoin ATH that year.
Since then, there has been a 62.71 % increase in price; from your buy price, if you simply just held your investment.
This gives you 162.71 usd currently
PA had risen 12% from that date but then dropped 22% to the low. From the Low, PA has risen 89 % and if you had Traded your investment, selling high, buying Low, you would now have 211.68 usd currently
Now to Bitcoin - again, 100 usd invested at the ATH in Nov 2021
100 invested in Nov 2021 currently has a 24.68 % increase from Buy price. if you just HODL, off the 2021 ATH and so you would have 124.68 currently
From that ATH point, we saw a Loss as PA dropped 77.2% to the Low but then Rose up 596% from the Low.
If you traded , Depending on when you sold your bad 100 investment , the gains are different But lets say, you sold what was left of your 100 at the slight rise in PA in March 2022 - that was a loss of 28.5%, leaving you 71.5 usd
Wait till the Low in Jan 203 and then continue Buy Low, Sell high, you currently have 743 usd , having sold the top at 109K and waiting for the next Low
So, in summery, from 100 usd investment in Nov 2021 BTC ATH
GOLD
HODL 162.71 - Traded 211.68
BITCOIN
HODL 124.68 - Traded 743.34
The ONLY REAL Loss currently is with the BTC GOLD pair, where BTC is -20% currently off Buy price, having fallen from HIGHER than Buy price recently,.
However, PA is on the lower trend line, as you can see in the chart, and the expectation is for a Strong Bounce over the next few weeks..This will set BTC off towards that magical 50 ounces of Gold per Bitcoin.
But it has to be said, the journey if you held Bitcoin having sold out from Gold has been painful.
Tthat pain is about to end, very possibly forever.
Trading is not for everyone and Hitting the perfect High or Low point is almost impossible.
But the Gains are there in Bitcoin against Gold if you even do basic trading.
And, inmy opinion, if you have gold....SERIOUSLY think abot Bitcoin now.
Gold is OVERBOUGHT on many timeframes....
Bitcoin is not...................

Bitcoin BTC price analysis, FOMC 19/03 - FED rateOur previous idea for OKX:BTCUSDT worked out 10 out of 10
Well, let's try to hit it again !)
Yesterday, CRYPTOCAP:BTC price showed growth despite the fact that the Fed left the rate unchanged yesterday #FOMC
In short, Powell said that he was "hesitant" to cut the rate now because it is not known how the economy will be affected by the new "economic tariffs and economic wars" that come into effect in early April. In the US, one "grandfather" does not know what to expect from the other "grandfather" ))
Nevertheless, #BTCUSD price has every chance of reaching $94k in the coming days.
And then, I would like to see a decline in BTC.D and USDT.D, which in turn will allow altcoins to "stop collapsing", and some low-liquid ones, which are easier to pump, will show good growth, such as X Empire.
👀 In general, the last 2 months have been: "not about making money, but about surviving and keeping the deposit, even with a drawdown", but the next 3 months may be very much about making money.
_____________________
Did you like our analysis? Leave a comment, like, and follow to get more

$BTC Bitcoin at critical point... Head and shoulder Pattern!CRYPTOCAP:BTC Bitcoin is at a critical point
Current price: 91000
Bitcoin has retraced over 16% from an all time high of 108k, Price action is currently forming a head and shoulder pattern which is usually a bearish pattern!
#btc needs to remain supported around 90.5k to continue its uptrend to all time highs at 119k
If MARKETSCOM:BITCOIN price action loses support at 90.5k then expect prices to retest supports at 85k and then 80k.
Definitely a critical point to watch! What do you think?

A possible scenario for Bitcoin over next 2 monthsI do think this has a Strong possibility of happening
MARCH will close as a RED Candle and the statisical expectation is that April will close GREEN and yet there are many reasons why Bitcoin Cannot rise a lot in April to make that Green
SO, We may see March drop down to the 74K area to end the month
This Gives PA the ability to Rise, hit that trend line and still Close the month GREEN and then take off in May.
Why May ?
Because that descending trend line perfectly matches the Weekly MACD decent and the date is when MACD reaches Neutral. Begining of May.
This is also why PA will likely be rejected from the Trend line before MAY
Should PA remain where it is now, it doesn't give a lot of room for April to close Green.
This really is just an Idea so we just need to see if it happens.
I do have a SPOt buy order sitting at 74779 just in case lol

BTCUSD LONG IDEALong Trade idea for BITCOIN looking at where price is coming from. Scale to your LTF of choice see if you could spot buy opportunities once price is in poi .. Drop a comment and tell me what you think..

$9.4M Bitcoin Short Squeeze and its Market ImplicationsThe volatile nature of the cryptocurrency market is a well-established fact, but the sheer scale of some trades can still send ripples across the entire ecosystem. Recently, a Bitcoin whale executed a masterful maneuver, closing a $516 million short position with a staggering 40x leverage, pocketing a cool $9.4 million profit in just eight days. This event, occurring shortly after a lower-than-expected Consumer Price Index (CPI) reading, highlights the intricate interplay between macroeconomic indicators, market sentiment, and the strategic actions of large players.
The whale's decision to close the short position immediately following the CPI release is particularly noteworthy. The lower-than-expected inflation figure signaled a potential easing of monetary inflation concerns, a development that is generally viewed favorably by Bitcoin investors. This optimistic signal likely triggered a shift in market sentiment, prompting the whale to capitalize on the impending price surge.
The use of 40x leverage amplified both the potential gains and the risks associated with the trade. While it allowed the whale to generate a substantial profit in a short period, it also exposed them to significant losses if the market had moved against their position. This high-risk, high-reward strategy is characteristic of whale activity, where large players leverage their capital and market insights to execute impactful trades.
The timing of the trade also underscores the importance of macroeconomic indicators in shaping Bitcoin's price trajectory. The CPI reading, a key measure of inflation, directly influences monetary policy decisions by central banks. Lower inflation can lead to a more dovish stance, potentially resulting in lower interest rates and increased liquidity, both of which are conducive to asset price appreciation, including Bitcoin.
Interestingly, Tuesday has emerged as Bitcoin's most volatile day in 2025.2 This heightened volatility can be attributed to the release of key economic data, including the CPI, as well as the influence of global economic trends. Market participants anticipate increased activity on Tuesdays, making it a crucial day for traders and investors to monitor market developments.
Despite the recent correction, Bitcoin's long-term outlook remains a subject of intense debate. While some analysts believe the bull run is over, citing on-chain metrics and expecting up to 12 months of bearish or sideways price action, others maintain a more optimistic perspective, predicting a potential rally to over $200,000.
The recent whale trade, coupled with the resumption of Bitcoin accumulation after three months of distribution, suggests that underlying demand for Bitcoin remains strong.3 This accumulation, particularly by long-term holders, can act as a stabilizing force, mitigating the impact of short-term price fluctuations.4
The "Bitcoin Price Prediction 2025: BTC Eyes Breakout, But Sellers Still In Control" sentiment accurately reflects the current market dynamics. While the potential for a breakout remains, the presence of significant selling pressure cannot be ignored. The interplay between bullish and bearish forces will continue to shape Bitcoin's price trajectory in the coming months.
The notion that the "Bitcoin bull cycle is over" is supported by some on-chain data, which can reveal information about investor behavior and market trends. However, interpreting on-chain metrics requires a nuanced understanding of the underlying data and its limitations. While these metrics can provide valuable insights, they should not be the sole basis for investment decisions.
Bitcoin's resilience in the face of market corrections is a testament to its growing adoption and acceptance as a mainstream asset. Despite the current correction, the cryptocurrency's ability to outperform global assets post-Trump election further reinforces its potential as a long-term investment.
The whale's $9.4 million profit is a reminder of the potential for substantial gains in the cryptocurrency market. However, it also highlights the inherent risks associated with high-leverage trading. Investors should exercise caution and conduct thorough research before engaging in such strategies.
In conclusion, the Bitcoin whale's strategic short squeeze and the subsequent market reactions underscore the complex interplay of factors influencing Bitcoin's price.
Macroeconomic indicators, market sentiment, and the actions of large players all contribute to the cryptocurrency's volatile nature.5 While the long-term outlook remains uncertain, the resumption of Bitcoin accumulation and the potential for a breakout suggest that the market is far from stagnant. Investors should remain vigilant, closely monitoring market developments and adapting their strategies accordingly. The story of the whale's successful trade is a potent reminder of the fortunes that can be made, and lost, in the dynamic world of cryptocurrency.

Unpacking the Bitcoin-Gold Correlation and its Current Dynamics
The narrative of Bitcoin as "digital gold" has gained significant traction, fueled by its perceived scarcity, decentralized nature, and potential as a hedge against economic uncertainty. Recent market movements, particularly the surge in gold prices and the subsequent, albeit delayed, reaction in Bitcoin, have brought this correlation into sharp focus. While the relationship isn't always perfectly synchronized, the underlying dynamics suggest a fascinating interplay between these two assets.
Gold's recent climb to an all-time high is largely attributed to escalating geopolitical tensions, particularly the resurgence of tariff war concerns. In times of uncertainty, investors often flock to traditional safe-haven assets like gold, seeking stability and protection against inflation. This surge in gold prices has naturally sparked renewed interest in Bitcoin, which, despite its volatility, is increasingly viewed as a viable alternative store of value.
However, the correlation isn't a simple, immediate mirroring of price movements. There's often a noticeable delay, with gold leading the way and Bitcoin following suit. This lag can be attributed to several factors. Firstly, gold's established status as a safe-haven asset gives it a head start in attracting investor capital during times of crisis. Secondly, Bitcoin's relatively nascent market is more susceptible to speculation and sentiment-driven fluctuations, which can introduce delays and variations in its price response.1
Currently, Bitcoin is navigating a period of consolidation, trading within a narrow range of $82.3k to $84.5k.2 This consolidation follows a "sell-the-news" event, likely related to a major market catalyst that failed to meet overly optimistic expectations. Consequently, Bitcoin is facing significant bearish pressure, evidenced by the accumulation of short positions. The pattern breakdowns observed by analysts further reinforce this bearish sentiment, suggesting a potential retest of the $78k support level.
Despite these challenges, the renewed interest in Bitcoin, driven by gold's surge, offers a glimmer of hope for a potential rebound. The "digital gold" narrative is gaining momentum, particularly among younger investors who are more comfortable with the digital asset landscape. If Bitcoin can successfully decouple from the immediate bearish pressures and capitalize on the broader trend of safe-haven asset allocation, it could witness a significant recovery.
However, several factors could impede this recovery. The significant short positions indicate a strong bearish sentiment, which could lead to further price declines if not countered by substantial buying pressure. Moreover, Bitcoin's inherent volatility remains a significant risk factor. Sudden market events or regulatory changes could trigger sharp price swings, disrupting any potential recovery.
Looking ahead to 2025, the Bitcoin price prediction remains a subject of intense debate. While some analysts foresee a potential breakout, fueled by increasing institutional adoption and the diminishing supply of new Bitcoin, others remain cautious, citing the persistent bearish pressures and the potential for further market corrections.
The "Bitcoin Price Prediction 2025: BTC Eyes Breakout, But Sellers Still In Control" sentiment accurately reflects the current market dynamics. The long-term potential for Bitcoin remains undeniable, but the short-term outlook is clouded by uncertainty. The interplay between bullish and bearish forces will likely continue to shape Bitcoin's price trajectory in the coming months.
The correlation with gold, while not a perfect predictor, provides valuable insights into Bitcoin's potential as a safe-haven asset. As gold continues to attract investor capital amid global uncertainties, Bitcoin's appeal as "digital gold" is likely to grow. However, the delayed response and the inherent volatility of the cryptocurrency market necessitate a cautious approach.
To navigate this complex landscape, investors should closely monitor both gold and Bitcoin price movements, paying attention to key technical indicators and fundamental developments. The accumulation of short positions, the potential retest of support levels, and the broader macroeconomic environment should all be considered when making investment decisions.
In conclusion, the Bitcoin-gold correlation provides a fascinating lens through which to understand the evolving dynamics of the cryptocurrency market. While the delayed response and the inherent volatility of Bitcoin present challenges, the growing recognition of its potential as "digital gold" offers a compelling narrative for long-term growth. However, in the immediate future, Bitcoin must navigate the current bearish pressures and capitalize on the renewed interest driven by gold's surge to achieve a meaningful rebound. The battle between buyers and sellers will continue to shape Bitcoin's price trajectory, and only time will tell whether the "digital gold" narrative will ultimately prevail.
