BITCOIN (BTC/USD)BTC/USD – Technical Outlook
Bias: Bearish
BTC/USD has completed the ABCD pattern and is now printing lower highs and lower lows, confirming a shift in market structure to bearish.
Price is currently retesting a previous support, now turned resistance. If this level holds, it could open the door for continued downside; with the 68K–50K zone as a potential BTD (buy-the-dip) area.
TARGET 1 (78K):
A key structural zone. A clean break and close below this level would confirm bearish momentum and increase the likelihood of price falling.
TARGET 2 (66K):
Likely to act as a magnet; a previous resistance turned support that launched price toward 100K. A return here would retest the foundation of the previous rally to 100k.
TARGET 3 (50K):
From a fractal and psychological standpoint, double tops often retrace to the origin of the bullish move. In this case, around the 50K zone.
Invalidation:
A reclaim of 85K–90K would shift bias back to bullish, signalling potential for upside momentum.
Bitcoinprice

Bitcoin’s Monthly RSI Nearing Danger Zone – Time to Sell?The chart above illustrates Bitcoin’s price action alongside the Relative Strength Index (RSI) on a monthly timeframe, which helps identify overbought and oversold conditions. Historically, Bitcoin’s major bull cycle peaks in 2013, 2017, and 2021 coincided with the monthly RSI reaching between 85-95, as highlighted by the blue circles. A downward trendline connects these peaks, suggesting that each cycle has seen slightly lower RSI highs, indicating a potential long-term momentum decline.
Currently, the RSI is approaching this historical resistance zone, signaling that Bitcoin may be nearing its market peak. If this trend continues, it could mark the final phase of the bull run, making it a strategic period for profit-taking. Traders should closely monitor RSI behavior, as a rejection from this level could indicate the start of a correction.
Historically, a monthly RSI of 85-95 has been a strong sell signal, marking the end of Bitcoin’s bull markets. If Bitcoin follows this pattern again, a distribution phase followed by a downturn could be expected.


Bitcoin’s Final Surge? One Month Before the Post-Halving Drop!Bitcoin Halving Cycles: What History Tells Us About 2025
The Bitcoin halving is a highly anticipated event that occurs approximately every four years, reducing the block reward by 50% ⛏️. This supply shock has historically been a major catalyst for price movements. By analyzing previous cycles, we can attempt to forecast what might happen in the upcoming halving cycle of 2025.
Historical Performance of Bitcoin Halving Cycles
First Halving (2012)
365 Days Before Halving: 📈 +385%
365 Days After Halving: 🚀 +8069%
Peak-to-Trough Decline After Peak: 🔻 -76.98%
Second Halving (2016)
365 Days Before Halving: 📈 +142%
365 Days After Halving: 🚀 +284%
Peak-to-Trough Decline After Peak: 🔻 -82.88%
Third Halving (2020)
365 Days Before Halving: 📈 +17%
365 Days After Halving: 🚀 +559%
Peak-to-Trough Decline After Peak: 🔻 -75.64%
Current Cycle and 2025 Halving Expectations
- Last Halving Date: 📅 April 15, 2024
- 365 Days Before Halving: Bitcoin gained 📈 +130% from $28,827 (April 2023) to around $65,000.
- Projected 365 Days After Halving (April 2025): If history rhymes, we could see a price increase of around 📊 +72%, with a potential closure at the current Peak of $110,000.
- Post-Peak Decline Estimate: Previous post-halving peaks saw declines of 📉 75%–82%. With Bitcoin's all-time high around $110,000, a 🔻 75% drawdown would target a bottom of ~$30,000 before the next recovery cycle.
Key Takeaways
Bitcoin's price tends to rally leading up to the halving, but the largest gains historically occur in the year following the halving. 📊
Post-bull run drawdowns are severe with past declines ranging from 🔻 -75% to -82%.
While the Pre and Post-Halving theory suggests that the decline starts around 365 days after the halving, the full bear market typically unfolds between ⏳ 486 to 510 days post-halving. This aligns with the ⛓️ 70,000-block mark post-halving, as Bitcoin halvings occur approximately every 210,000 blocks. This means that while the peak may occur within a year after the halving, the deep bearish phase historically becomes evident around 1.3 to 1.4 years after the halving, reinforcing the long-term cyclical nature of Bitcoin’s market trends 🔄.
Final Thoughts
Bitcoin halving events are pivotal moments in the crypto market cycle 🔥. The data suggests that 2025 could see significant gains, but we should also be prepared for the inevitable correction that follows 📉.
What are your thoughts on the upcoming cycle? Share your insights in the comments!
Disclaimer
This article is for informational and educational purposes only and does not constitute financial, investment, or trading advice. The historical performance of Bitcoin halving cycles does not guarantee future results, and past trends may not necessarily repeat. Cryptocurrency markets are highly volatile, and investing in Bitcoin or any other asset carries risks, including the potential loss of capital.
Readers should conduct their own research, assess their risk tolerance, and consult with a licensed financial advisor before making any investment decisions. The information provided is based on publicly available data and historical observations, which may be subject to change.
Sources:
Nakamoto, S. (2008). Bitcoin: A Peer-to-Peer Electronic Cash System.
Bitcoin block time and halving data: Blockchain.com
Historical Bitcoin price data: CoinMarketCap
Bitcoin halving cycles and trends: Messari
Market performance metrics: Glassnode
By reading this article, you acknowledge that you are solely responsible for your own financial decisions and that the author assumes no liability for any losses incurred from trading or investing. 🚀

Bitcoin 50 SMA time snaps and Low to ATH since 2014 - UPDATEIn a similar vein to the chart posted earlier today about the patterns between the 50 and 100 SMA, this post is using the 50 SMA ( RED) and the time spent above and below PA.
Alongside this, we have the day counts for PA LOW to PA ATH since 2014
After 2013 ATH and once the 50 SMA dropped below PA, it spent 399 days below PA
After 2017 ATH and once the 50 SMA dropped below PA, it spent 329 days below PA
After 2021 ATH and once the 50 SMA dropped below PA, it spent 420 days below PA - This is an impressive stat as it includes the Deep Bear that we experienced after the Luna, 3 Arrows & FTX crashes, includes the raising of interest rates and the utter presecution by Banks and SEX in the USa.
The fact that the drop below PA was only extended by 35 days ( average) Max shows a strength in Bitcoin sentiment. It could NOT be broken
In 2015, once the 50 SMA has risen above PA, it remained there for 938 days
In 2019, once the 50 SMA has risen above PA, it remained there for 1001 days
In 2023, once the 50 SMA has risen above PA, we have been above for 756 days of an expected average projection of 966 days
This projects that PA will Drop Below the 50 SMA in about October 2015, After the ATH as previously.
This points towards an ATH in Q4 - this has some confluence with the previous post though open to suggestion.
Next is the simple PA LOW to ATH and Back to LOW day counts
2013 ATH to Cycle Low was 665 days then 847 days to Cycle ATH
2017 ATH to Cycle Low was 350 days then 1064 days to Cycle ATH
2021 ATH to Cycle Low was 378 days then, using the average of the two previous day Count from Low to ATH, gives us 952 days to Cycle ATH
This puts an ATH in JUNE 2025 !
I do not think this is realistic in anyway however, Anything is possible currently.
I do however think that June is about when PA could seriously begin to make Moves higher, with intent to reach a Cycle ATH.
The reason being, the weekly MACD will have reached Neutral by then ( if not in mid May )
So while this chart offers some confluence to other ideas, it also offers another ATH date that is way earlier than any previous cycle ATH - While I feel this is unlikely to happen, we Must keep open minds.. the adoption of BTC by main stream now may well accelerate the PA cycle.
We shall wait and find out.
Be prepared for ALL occasions....including the arrival of an early Bear. - THAT will be in another post, at some point soon
Stay safe

Bitcoin(BTC/USD) Daily Chart Analysis For Week of March 14, 2025Technical Analysis and Outlook:
In the current week's trading session, Bitcoin has made multiple hits by retesting our completed Outer Coin Dip 78800 on Sunday and Monday. Consequently, the cryptocurrency has experienced a significant uptrend, reaching the inverse (Resistance) Mean Sup 84700 level. This upward oscillation indicates a potential for further price rally and suggests a likelihood of advancing toward the target designated as the Interim Coin Rally 88400. Such developments could facilitate an extension toward the supplementary target of Mean Res 94500 and beyond. If there is a decline from Interim Coin Rally 88400 or its current price level, the coin is expected to retest the completed Outer Coin Dip 78700, potentially reinstating the upward rally.

Falling wedge found on Daily TimeframeYou're absolutely right, the falling wedge pattern often suggests a potential breakout to the upside, but it's important to be cautious. That "bleed off" to around 70k could still be part of a larger consolidation before a big move. If we break down out of the wedge, it would definitely signal more bearish market sentiment, especially considering the broader macro risks you're highlighting like geopolitical instability, health crises, and climate concerns.
It's a bit of a nerve-wracking but exciting situation, especially with the unpredictable nature of markets these days. How are you thinking of positioning yourself in this scenario? Holding out for the breakout, or preparing for the downside risk as well?

BITCOIN 50 & 100 SMA Patterns since 2014 -UPDATE - ATH in Q4 ?This is a long post but please read it all, there are some Major things to take note of.
The Main item in this post is the day counts between 50 SMA ( RED ) and 100 SMA ( BLUE ) and the days between Cross overs of these.
The upper day counts on the chart, count from ATH to when 50 crosses below the 100.
Then from that point to when the 50 Crosses back Above the 100
And then, in Grey, the number of days from Cross over to ATH
From 2014 ATH to 50 dropping Below = 504 days
When the 50 returned Above the 100 = 406 days
And from that point to the 2017 ATH = 560 days
From 2017 ATH to 50 dropping Below = 448 days
When the 50 returned Above the 100 = 284 days
And from that point to the 2021 ATH = 686 days ( I am using the Nov 2921 ATH as it was the higher price )
From 2021 ATH to 50 dropping Below = 308 days
When the 50 returned Above the 100 = 441 days
And from that point to the 2025 ATH = The average of the 2 previous is 623 days and takes us to a possible ATH in August, though I feel this is too soon.
If we Look at the day count from ATH to 50 dropping below 100
From 2014 ATH to 50 dropping Below = 504 days
From 2017 ATH to 50 dropping Below = 448 days
From 2021 ATH to 50 dropping Below = 308 days
Could this point towards around 200 days after ATH in 2025?
( This reduction in day count is most likely due ti rapid Profit taking. )
What is interesting is how, on Both the 2014 - 2017 and 2017 - 2021 ATH it was approx 1005 days between the 50 rising above the 100 to when ot fell back below after an ATH. This is Despite a variation in the days count between SMA cross overs.
Using this day count and projecting forward, maybe we can expect the 50 to drop back below the 100 in August 2026, next year
Using the day count from ATH to when 50 Drops below, that was mentioned above, that is around 200 days after ATH and using that August date just mentioned, We are projecting a Cycle ATH in Feb 2026 !
This is NOT a realistic date if we are to remain in the patterns of ATH in late Q4, that we have had every previous cycle.
As I pointed out in a post yesterday, the traditional patterns of Bitcoin HAVE to change this year.
And to many extents, they already have begun.
Take a Look at the angle of ascent of the 50 and 100 SMA's since 2014. Each cycle has seen a reduction of Steepness of Rise.... A slowing down on trajectory and this is most likely caused by the increase of price of a Bitcoin.
The more expensive it gets, the heavier it is to move PA higher.
So far this cycle, PA has landed on the 50 SMA twice and we are SO Close to doing that again.
This has NEVER happened before.
In 2021, we did it once and bounced to the Nov 2021 ATH, so far this cycle, we have done that twice.
This ARE CHANGING and for this to continue, we do need to see PA Bounce again off the 50, when the Bulls are ready.
The ATH in Q4 is open to question as a result. It may happen anytime from Late Q3 to Late Q1 2026
And we are only going to find out when it happens.
But be aware f things changing.
Because they are and so using History may become unusable....a bit like Price discoveryIt will become Trend discovery
Enjoy

The bulls have left the building—time for the bears to party.PENDLE currently at strong support zone on weekly timeframe.
Break of this support could trigger a massive fall downwards. Chart is self explanatory.
Note: This is not Buy/Sell Recommendation. DYOR always & always.

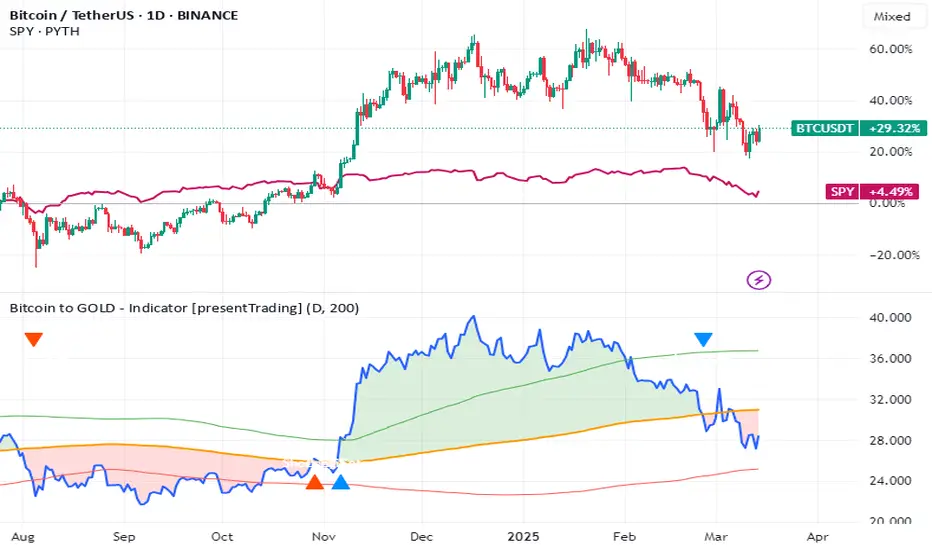
Bitcoin, S&P, Gold: Market Decline & DivergenceThe intricate dance of financial assets often reveals hidden correlations and predictive patterns. Recently, the synchronized decline of Bitcoin and the S&P 500 has raised concerns, while gold's historic rally has left Bitcoin trailing. However, a deeper dive into the data suggests a potential turnaround, hinting at a shift in market dynamics.
For much of the past few years, Bitcoin has exhibited a strong correlation with the S&P 500, behaving as a risk-on asset.1 When the stock market surged, Bitcoin often followed suit, and conversely, market downturns typically coincided with Bitcoin's price depreciation. This correlation stems from shared macroeconomic drivers, such as interest rate expectations, inflation concerns, and overall investor sentiment. The recent parallel decline reflects anxieties surrounding persistent inflation, potential interest rate hikes, and geopolitical uncertainties.
However, this synchronized movement doesn't tell the whole story. While Bitcoin and the S&P 500 have been grappling with downward pressure, gold has embarked on a remarkable rally, reaching unprecedented heights. This surge is fueled by several factors, including substantial inflows into gold ETFs, escalating geopolitical tensions, and heightened market volatility. Gold's traditional role as a safe-haven asset has been reaffirmed, as investors seek refuge from the turbulence in equity and cryptocurrency markets.
The divergence between Bitcoin and gold is particularly striking. The Bitcoin-to-gold ratio, a metric that reflects the relative value of Bitcoin compared to gold, has broken a 12-year support level. This breach signals a significant shift in investor preference, with gold emerging as the dominant asset. The recent climb of gold to a hypothetical $3,000 mark (or equivalent in other currencies) further underscores this trend, demonstrating its resilience in the face of economic uncertainty.
The observed pattern of Bitcoin breaking its multiyear uptrend against gold bears a striking resemblance to the market behavior witnessed between March 2021 and March 2022. During that period, Bitcoin experienced a similar decline relative to gold, ultimately leading to a substantial drop in its dollar value. This fractal pattern suggests that Bitcoin may be poised for further depreciation, potentially falling below the $65,000 mark.
However, it's crucial to acknowledge that historical patterns are not infallible predictors of future performance. Market dynamics are constantly evolving, and unforeseen events can significantly alter the trajectory of asset prices. While the current data points towards a potential decline for Bitcoin, there are countervailing factors that could trigger a reversal.
One such factor is the increasing institutional adoption of Bitcoin. As more institutional investors allocate a portion of their portfolios to cryptocurrencies, the market may become less susceptible to short-term fluctuations driven by retail sentiment. Moreover, the long-term potential of Bitcoin as a decentralized store of value remains a compelling narrative for many investors.
Additionally, the regulatory landscape surrounding cryptocurrencies is gradually becoming clearer. As governments and regulatory bodies establish frameworks for the operation of digital asset markets, investor confidence may improve, leading to renewed interest in Bitcoin. The upcoming Bitcoin halving is also anticipated to reduce the supply of new Bitcoin entering the market, which could potentially drive up its price.
While the current correlation between Bitcoin and the S&P 500 may persist in the short term, the underlying fundamentals of Bitcoin suggest a potential decoupling in the long run. As the cryptocurrency market matures and gains wider acceptance, its correlation with traditional asset classes may weaken.
The recent divergence between Bitcoin and gold highlights the importance of diversifying investment portfolios. While gold has proven its resilience in times of uncertainty, Bitcoin offers the potential for substantial returns in the long term. Investors should carefully consider their risk tolerance and investment objectives when allocating capital to these assets.
The breakdown of the Bitcoin to gold ratio is a concerning indicator, however, the cryptocurrency world moves quickly. The market is driven by new innovation, and adoption. The market has been known to have large pullbacks, followed by even larger rallies. The current market may be pricing in a large amount of fear, and a simple change in the news cycle could cause a large change in the price of bitcoin.
In conclusion, the current market dynamics present a complex picture. The synchronized decline of Bitcoin and the S&P 500, coupled with gold's historic rally, suggests a potential downturn for Bitcoin. However, the long-term potential of Bitcoin, coupled with increasing institutional adoption and a maturing regulatory landscape, could trigger a reversal. Investors should remain vigilant, monitor market trends, and make informed decisions based on a comprehensive understanding of the underlying fundamentals. The data suggests a potential turn around, but only time will tell if the market will comply.
$84K BTC Battle, ETF Resilience, and Macroeconomic ShadowsBitcoin's journey remains a captivating saga of volatility, resilience, and the interplay of technical indicators and macroeconomic forces. Recently, the cryptocurrency surged past $84,000, reigniting bullish sentiment, but faces a critical test at a key resistance level.1 This surge, fueled by a broader rebound in risk assets, pushed BTC above its 200-day moving average, a pivotal benchmark for assessing long-term trends. However, this bullish momentum is juxtaposed with significant selling pressure, ETF outflows, and lingering concerns about regulatory and macroeconomic landscapes.
The 200-Day Moving Average: A Battleground for Bulls
The 200-day moving average is a widely recognized technical indicator that provides insight into the long-term trend of an asset. For Bitcoin, consistently closing above this level signifies a potential shift from bearish to bullish momentum. The recent breach is a positive sign for bulls, indicating renewed confidence and potentially attracting further investment. However, a sustained close above this level is crucial to solidify the bullish outlook.
The importance of this level is highlighted by the narrative that a weekly close above this average would confirm a market bottom. This emphasizes the significance of longer timeframes in validating trends in the highly volatile cryptocurrency market.
$86K or $65+K: A Price at a Crossroads
Bitcoin's price currently finds itself at a critical juncture. The immediate challenge is breaching the $86,000 resistance level. A successful breakout could pave the way for further gains, potentially pushing Bitcoin towards new all-time highs. Conversely, failure to overcome this resistance could lead to a pullback towards the $65,000 support level. This range represents a crucial battleground for bulls and bears, with the outcome likely to determine the short-term trajectory of Bitcoin's price.
MVRV Ratio: A Potential Reversal Indicator
The Market Value to Realized Value (MVRV) ratio is another key metric that investors closely monitor. It compares Bitcoin's market capitalization to its realized capitalization, providing insights into potential overbought or oversold conditions. A high MVRV ratio suggests that Bitcoin is overvalued and prone to a correction, while a low ratio indicates undervaluation and potential for a rebound. The MVRV ratio nearing a key level suggests that a major reversal could be imminent, adding another layer of complexity to Bitcoin's current price action.
ETF Resilience Amidst Volatility
Despite a 25% price drop, Bitcoin ETF investors have maintained a relatively strong stance. This resilience is reflected in the collective $115 billion in assets under management by US Bitcoin ETFs. This demonstrates the growing institutional adoption of Bitcoin and the increasing acceptance of cryptocurrencies as a legitimate asset class. However, since mid-February, Bitcoin ETFs have witnessed total outflows of nearly $5 billion. This outflow points to a potential shift in investor sentiment, possibly driven by concerns about market volatility or macroeconomic uncertainties.
The strength of the ETF market is a double edged sword. While significant holdings demonstrate institutional buy in, large outflows can increase sell pressure on the underlying asset.
Selling Pressure and Macroeconomic Shadows
Bitcoin's recent decline is attributed to intensified selling pressure, reflecting a broader trend of risk aversion in the market. This selling pressure is exacerbated by concerns about the potential impact of digital currencies on traditional banking systems. Banks are increasingly weighing the implications of Bitcoin and other cryptocurrencies, leading to regulatory scrutiny and potential policy changes.
Furthermore, macroeconomic factors continue to weigh on investor sentiment. Concerns about inflation, interest rate hikes, and geopolitical tensions are contributing to market volatility and impacting the demand for risk assets, including Bitcoin.
Presidential Policy and Market Sentiment
A presidential policy aimed at creating a strategic Bitcoin reserve initially sparked optimism among investors. However, this initial enthusiasm waned, highlighting the complex interplay between policy announcements and market reactions. While such policies can signal government acceptance of cryptocurrencies, they may not always translate into immediate price appreciation.
The market's reaction suggests that investors are more focused on broader macroeconomic trends and regulatory clarity. The lack of sustained positive impact from the policy announcement underscores the importance of addressing fundamental concerns about Bitcoin's long-term viability and regulatory framework.
Navigating the Volatility
Bitcoin's current situation highlights the inherent volatility and unpredictable nature of the cryptocurrency market. Investors must remain vigilant and adapt to rapidly changing market conditions. The interplay of technical indicators, ETF flows, and macroeconomic factors creates a complex landscape that requires careful analysis and strategic decision-making.
In conclusion, Bitcoin's battle at $84K, coupled with the resilience of ETF investors and the shadow of macroeconomic uncertainties, paints a picture of a market at a critical juncture. The coming weeks will be crucial in determining whether Bitcoin can sustain its bullish momentum or succumb to renewed selling pressure. Understanding the interplay of these factors is essential for navigating the volatile world of cryptocurrency investing.

Bitcoin is Headed to $36K And It’s Happening NOW!This might not be the most popular opinion, especially among those who still believe the current Bitcoin bull cycle hasn’t ended. However, I encourage you to take a few minutes, approach this with an open mind, and let me know whether you agree or disagree.
Understanding the Previous Cycle (2020–2021)
The last Bitcoin bull cycle began in March 2020, when BTC bottomed at approximately $3,810. It then surged to an all-time high (ATH) of $69,870 in November 2021, marking the cycle top.
By applying a Fibonacci retracement to this entire range, we can see that the golden pocket (0.618 - 0.786 Fib)—often a key support zone during bear markets—fell between $17,700 and $28,690.
Looking at the chart, BTC beautifully retraced into this zone, even dipping slightly below it to form a cycle bottom at $15,500 in November 2022.
The key sign that the bear market had ended and a new bull market had begun was when Bitcoin broke above the 0.786 Fibonacci level of the previous cycle and established a higher high on the weekly chart. This marked a clear shift from a bearish to a bullish market structure.
The Current Cycle (2022–2025)
From the November 2022 bottom, Bitcoin rallied, setting a new ATH at $73,600—just slightly above the previous peak. After some consolidation, it found strong support at the 0.236 Fib level of the previous bull cycle, signaling that the uptrend was still intact.
The real breakout came when BTC surpassed the psychological $100,000 level and consolidated around the -0.5 Fib extension of the previous cycle. The cycle top appears to have been put in after Donald Trump took office in January 2025, marking an approximately 26-month bull run—longer than previous cycles.
However, a major bear market confirmation signal has now emerged: BTC has decisively broken below the 0.236 Fib retracement of this cycle, which historically signals the end of a bull market and the beginning of a new bear phase.
Where is the Next Bottom?
By analyzing the Fibonacci levels of both the previous and current bull cycles, we can identify key potential support zones where Bitcoin may bottom out:
1. $51,370 - $53,700
• This range aligns with:
• 0.236 Fib of the previous bull cycle
• 0.618 Fib of the most recent bull cycle
• This zone has confluence, making it a high-probability support level.
2. $35,600 - $36,500
• This range aligns with:
• 0.5 Fib of the previous bull cycle
• 0.786 Fib of the most recent bull cycle
• If BTC breaks below the first support zone, this is the next key level to watch.
Historically, Bitcoin bear markets last around one year, so we can expect this downward trend to play out over a similar timeframe.
How to Position Yourself?
For long-term investors, these support zones offer prime buying opportunities to accumulate Bitcoin at discounted prices before the next bull run begins. While the market won’t move in a straight line down—expect bounces and fake-outs—the general expectation is that BTC will find its next higher low within one of these zones.
Looking Ahead: Next Bull Cycle Target
If we use the same -0.5 Fib extension strategy that predicted the previous cycle’s top, we can estimate the next bull market peak. Based on the current cycle’s Fib range, the projected ATH for the next bull run would be around $157,000.
Final Thoughts
While nobody can predict the future with certainty, historical price action, Fibonacci levels, and market structure provide strong clues about where BTC is headed next. As always, flexibility is key—if market conditions change, so should our expectations. But if history repeats itself, these levels offer a solid framework for identifying the best entry points and positioning for the next major bull run.
What do you think? Do you agree with this analysis, or do you see it differently? Let me know in the comments!

any day now moon shot to $130,000 then its going down to...any day now we will have a moon shot to $130,000 by march 25 2025 and that will be the top then we are going to a financial reset
Alt coins will 50x before they retrace %98
bitcoin will go down to $17,500 by October 2025
not a financial advise

Bitcoin Weekly LINEAR chart shows possible re run of 2021 2X ATHI was just looking at this Linear chart and spotted a couple of things.
So many people Use LOGARITHMIC charts.
In summery, A logarithmic chart is a graphical representation that uses a logarithmic scale, which differs from the conventional linear scale. In a logarithmic scale, the distance between values is not constant but increases by a factor, making it useful for datasets with a wide range of values. This approach helps in presenting numerical information more efficiently and allows for a better visualization of rates of change or percentages rather than absolute values.
A LINEAR chart however, shows you the REAL rate of change.
And on This Linear chart, I have noticed that PA is creating a very Similar Top to the MARCH ATH of 2021
I do not think we will follow it perfectly, as that drop in 2021 was over 50% and that would take us down to 52K, which I think is not a real possibility. But, being open to ALL possibilities, that trend line that was used by PA to bounce to the Nov ATH currently sits around 65K But the longer we wait, it heads higher, towards the 1 Fib ext around the Old 2021 ATH near 70K ( 69300)
Also note, how once PA had Dropped in March 2021, it levelled out and slide sideways for around 7 weeks.
So if we come over to Today, we have just dropped around 30% and seem to have found a Floor around 76K
We HAD to drop out of that Upper range box - It would have been December before we found support on the rising Trend line that has been the trigger for moves higher since 2023
And so, we have dropped to a Lower Range Box ( hopefully ) and this box hits the Rising trend line around June.
This has confluence with a number of other charts
And if we do range sideways, around this level, it is similar to that Range after the drop in 2021.
In 2021, after that range, PA rose by around 122%
I am not to sure we would see that but................
So now we wait to see if we stay in this range or not, with a top around 90K
We could See wicks out of this Range, down to the 70K mark maybe, with swift recovery.....
We may also see further Drop....
there is abcolutly NO guarentee that we will even head higher again.....
We have to wait and see and have plans and stick to them..for both BULl and BEAR

BTC 3 MONTHS LONG Starts, this week?Waiting for a last impulse 140 ds/3 months on INDEX:BTCUSD BITCOIN, this week could the 3 months BTC LONG START . Why? Let´s see:
- Channel with 4 elliot waves done. Looking for Wave 5.
- RSI 3D breaking out, like 1 year ago.
- RSI W Just about to Break out, like 1 year ago. Looking for confirmation.
- Rate Cuts this week, lets see.
www.tradingview.com INDEX:BTCUSD

BTCUSD - If it is a Similar Situation to 2017If we are experiencing a similar run to 2017 we would be 847days into the bull run
I have shown the bars pattern for where price could go with the rest of the time left, which shows a 3500% gain this bull market. This is compared to the 2017 run which was a 9000% gain to the top.
We have some bull time left is the take away if the runs are comparable.
Weekly chart.

Bitcoin at a Crucial Level: Another Pump Ahead?The price of Bitcoin is at a crucial region, with buyers continuing to defend the 200-day moving average on the daily chart and holding off the bearish pivot on the weekly chart. Yesterday's closing candle (March 11, 2025) is a PFR (Closing Price Reversal), indicating buyers defense in an important area. The fact that the price has consolidated since its last major bullish leg (Trump trade) strengthens the possibility of another upward move. Considering all the actions Trump is taking regarding cryptocurrencies, I see another pump ahead.

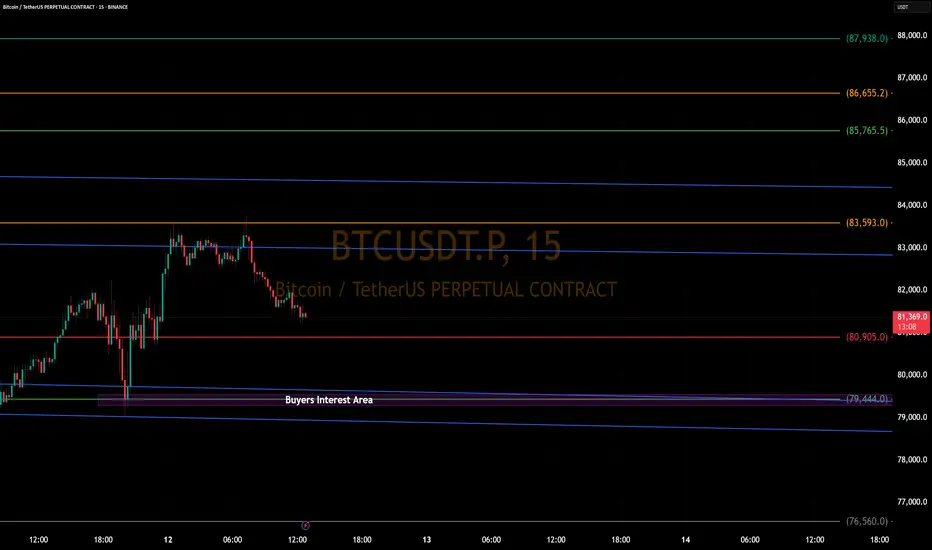
BTCUSDT Price Action | March 12, 2025BINANCE:BTCUSDT.P is now trying to recover from its 50% daily time frame correction. As per my analysis 79444 is now Buyers interest level to go long with stop loss of 76560 for targets of 83593, 85765 (50% Pullback level in 4 hour time frame).
Note. This is my personal analysis, please do your analysis and take decision for buy or sell with strict risk management. Thanks.
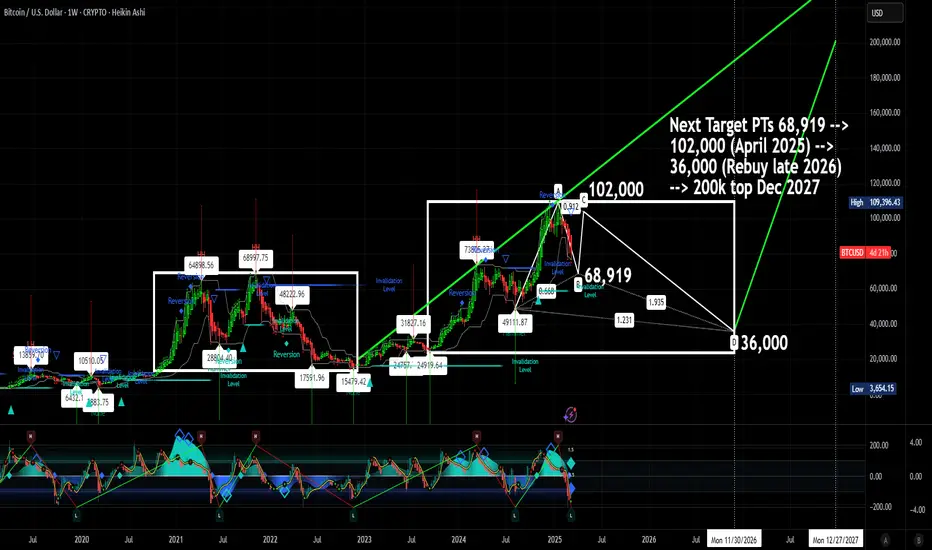
$BTC Bitcoin Next Target PTs 68,919 --> 102,000 (April 2025) CRYPTOCAP:BTC Bitcoin
Next Target PTs 68,919 --> 102,000 (April 2025) -->
36,000 (Rebuy late 2026) --> 200k top Dec 2027
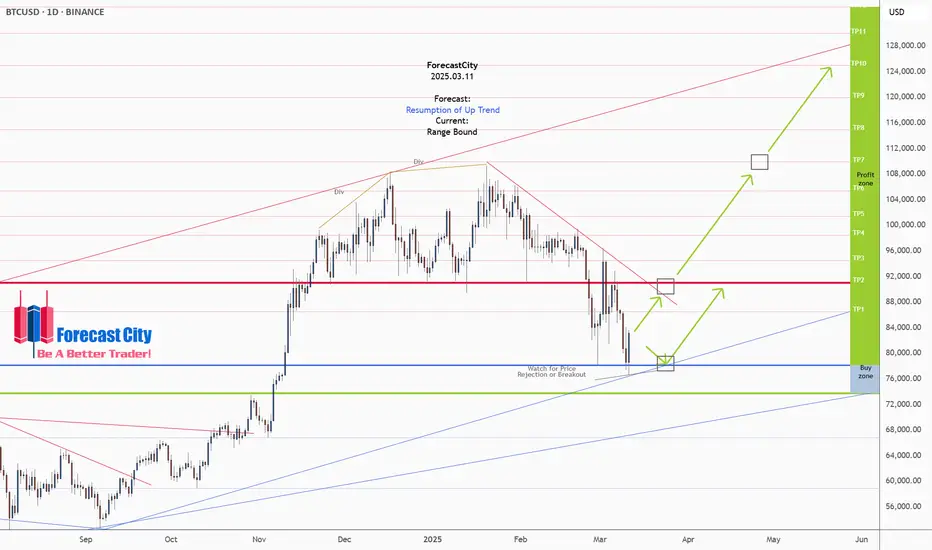
Bitcoin - Weekly Forecast - Technical Analysis & Trading IdeasMidterm forecast:
While the price is above the support 73777.00, resumption of uptrend is expected.
We make sure when the resistance at 91037.20 breaks.
If the support at 73777.00 is broken, the short-term forecast -resumption of uptrend- will be invalid.
BITSTAMP:BTCUSD
Technical analysis:
A peak is formed in daily chart at 109588.00 on 01/20/2025, so more losses to support(s) 78180.00 and minimum to Major Support (73777.00) is expected.
Take Profits:
86499.57
91037.20
94505.46
98489.63
101430.12
105431.17
109932.89
115000.00
120000.00
125000.00
__________________________________________________________________
❤️ If you find this helpful and want more FREE forecasts in TradingView,
. . . . . . . . Hit the 'BOOST' button 👍
. . . . . . . . . . . Drop some feedback in the comments below! (e.g., What did you find most useful? How can we improve?)
🙏 Your support is appreciated!
Now, it's your turn!
Be sure to leave a comment; let us know how you see this opportunity and forecast.
Have a successful week,
ForecastCity Support Team
130000.00
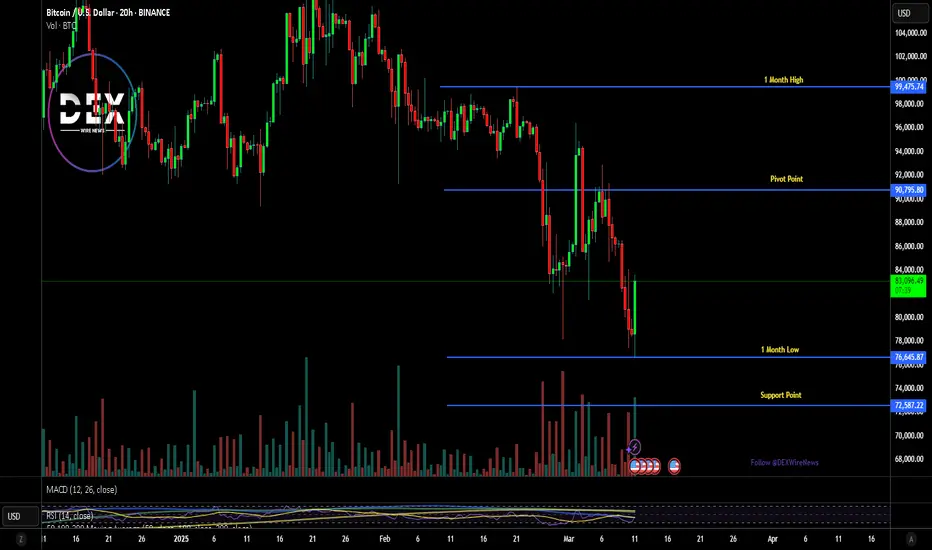
Breaking: Bitcoin Made a Comeback Surging 8%The world's first digital asset Bitcoin ( CRYPTOCAP:BTC ) shocked traders and investors alike as it surge 6% striking a comeback amidst the recent crypto bloodbath placing CRYPTOCAP:BTC in the FWB:83K zone with eyes set on the reclamation of the $100k Resistance.
Earlier on, we see Bitcoin retraced testing the $70k support point with many altcoins following suit. Should CRYPTOCAP:BTC break pass the $90k pivot point which is in lieu with the 38.2% Fibonacci point, a bullish campaign might evolved for CRYPTOCAP:BTC with odds set on the $120k zone.
Data from DefiLama shows industries and crypto projects are migrating to the Bitcoin blockchain network for scalability with about $5.414 Billion locked in Total Value Locked (TVL).
Bitcoin Price Live Data
The live Bitcoin price today is $83,341.47 USD with a 24-hour trading volume of $58,734,237,674 USD. Bitcoin is up 7.17% in the last 24 hours, with a live market cap of $1,653,114,998,100 USD. It has a circulating supply of 19,835,443 BTC coins and a max. supply of 21,000,000 BTC coins.
Bitcoin Weekly Analysis – Retest Incoming?BTC has lost momentum after breaking above its previous high but failing to retest that level. With the $91,500 support now broken, the trend shows signs of weakness.
Unless BTC reclaims $91,500 on a weekly close, I expect a move down to the $69K - FWB:73K zone (marked in red). This level aligns with a key breakout area that hasn’t been properly tested. A retest here would be a logical step before any potential continuation upwards.
I’ll be watching for bullish reactions in this range before considering long positions. What do you think—will BTC revisit this level, or are we heading for an even deeper correction? Let me know your thoughts! 🚀🔍

