Analysis Report for Bitcoin (BTC)1. Recent Price Action
Current Price: $97,123
Recent High: $102,014
Recent Low: $90,000
Price Movement: Bitcoin has experienced significant volatility, recently dropping below $100,000, which has raised concerns among traders. The price has fluctuated between $90,000 and $102,000, indicating a potential consolidation phase.
2. Key Technical Indicators
Moving Averages:50-day MA: $98,500 (currently acting as resistance)
200-day MA: $85,000 (providing long-term support)
Relative Strength Index (RSI): Currently at 52, indicating a neutral stance but leaning slightly bullish.
MACD: The MACD line is approaching the signal line, suggesting a potential bullish crossover if the price holds above $97,000.
3. Volume Analysis
Average Volume: Approximately 10 million BTC traded daily.
Recent Volume: A notable increase in volume was observed during the recent price drop, indicating strong selling pressure.
Volume Patterns: The correlation between price and volume suggests that the recent drop was supported by high selling volume, which may indicate a bearish sentiment.
4. Support and Resistance Levels
Support Levels:Primary Support: $93,000 (recent low)
Secondary Support: $90,000 (psychological level)
Resistance Levels:Primary Resistance: $102,000 (recent high)
Secondary Resistance: $106,000 (key overhead area)
5. Breakout/Breakdown Points
Breakout Point: A close above $102,000 with strong volume could signal a bullish breakout, targeting $106,000 and potentially $110,000.
Breakdown Point: A close below $93,000 could indicate a bearish breakdown, targeting $90,000 and potentially $87,000.
6. Anomalies and Divergences
Divergence: There is a bearish divergence noted between price and RSI, as the price has made lower highs while RSI has not confirmed this trend, suggesting potential weakness in the current uptrend.
7. Risk and Reward Scenarios
Long Position:
Entry Point: $102,500 (breakout confirmation)
Stop-Loss: $100,000 (below recent support)
Target Price: $106,000 (first target)
Risk/Reward Ratio: 1:2 (risking $2,500 to gain $3,500)
Short Position:
Entry Point: $92,500 (breakdown confirmation)
Stop-Loss: $94,500 (above recent resistance)
Target Price: $90,000 (first target)
Risk/Reward Ratio: 1:2 (risking $2,000 to gain $2,500)
Bitcoin is currently in a critical phase, with potential for both bullish and bearish movements. Traders should closely monitor the key support and resistance levels, as well as volume trends, to make informed decisions. The analysis indicates that a breakout above $102,000 could lead to further gains, while a breakdown below $93,000 could signal a deeper correction. Always adhere to risk management principles and adjust stop-loss levels as necessary to protect capital.
Bitcoinprice

Bitcoin’s price has finally started movingHello, dear friends!🩷
I’m so glad to see You here! After a week of stagnation, Bitcoin’s price has finally started moving—it’s heading downwards, continuing to form an inverted triangle, or as some might call it, an inverted wedge!
I believe that in the near future—perhaps a day or two—we might see Bitcoin at $90,000. Whether the price will continue to drop after that is still unclear, so we’ll keep a close eye on how it develops.
How are You doing? Where do You think Bitcoin is headed in the near term? Do You agree with my analysis, or do You have a different opinion? Share Your thoughts in the comments—I’d love to hear them!
Thanks for Your attention🫶
Sincerely Yours, Kateryna 💛

Bitcoin: Potential Bearish Breakdown with Key Support Zoneshello guys!
The chart suggests a Head and Shoulders pattern, indicating a possible bullish (in a higher time frame) continuation. Here are the key points:
Head and Neckline Structure
A well-defined head formation at the top, with a sloping trendline indicating weakness.
The neckline is around 97,657, which is a key support level.
QML2 & Price Rejection
The price could test the QML2 area, confirming bearish sentiment.
The descending trendline further reinforces selling pressure.
Expected Price Action
A short-term pullback might occur near 97,657, but a break below this level could trigger further downside.
The next major support is the QML1 zone at 93,455, where buyers may step in.
If selling pressure continues, the price could drop further into the 91,829 - 91,468 demand area.
Potential Reversal Scenario
If Bitcoin finds support at the lower QML1 or demand area, a strong bullish recovery toward 103,000+ could follow.
Overall, this setup suggests a short-term bearish continuation, but traders should monitor price action near key support zones for a potential bullish reversal.

AEVO LONG DEVIATION For the past 7 months, AEVO has ranged between $0.60 and $0.25. It seems to have broken below this range, creating a new low. However, for those with patience, this presents an ideal setup for a long position in this coin.
At the moment, market psychology suggests the following:
Traders who bought at the support zone are now losing money and likely closing their positions or even opening shorts, adding liquidity.
Meanwhile, whales that shorted from $0.64 down to the current levels are likely accumulating below support.
These whales could push the price higher to liquidate short positions.
As the price rises, short sellers may be forced to close in losses or add to their losing positions, creating further fuel for an upward move.
If the price re-enters the range, this would confirm that the breakdown was just a stop hunt, signaling a good opportunity to open a long-term position.

We warned you in the previous post about the crash, BitcoinDo you remember the last post where we warned you about the upcoming crash?
Today, reality has become even harsher.. Bitcoin has crashed below $100, and Tram Coin has plummeted into oblivion!
🔥 Unfortunately.. for those who didn’t read the previous post:
It was the golden opportunity to exit before the disaster..
Now.. regret and loss for those who ignored the warnings!
💡 If you want to know how low Bitcoin will go.. read the previous post!
And if you don’t want the market to crash on you.. hit follow so you don’t miss any important warnings or analysis!
💔 The fear of loss is worse than the loss itself..
Don’t let procrastination or neglect make you a victim..
Follow the analysis and always be prepared for any scenario!
📉 The market shows no mercy..
So, are you ready for the next move?
This is the post I warned you from.. If you were following me and read it, you wouldn’t have lost!

BTC Trading/Bouncing within RangeBTC has been bouncing from top to the bottom of this range every time it hits the OB at the bottom or top of the range. If BTC breaks down to $85k I think we definitely see it drop to $77k at least.

TradeCityPro | IMXUSDT Potential 30% Drop👋 Welcome to TradeCityPro Channel!
Let’s take a look at today’s altcoin on this market holiday, especially for those holding IMX, as it might experience a drop once the market reopens.
Before starting the analysis, as always, let's first check Bitcoin. On the 1-hour timeframe, Bitcoin dropped last night after getting rejected at 105,939, making a sharp move down to support at 101,654, where it is currently holding.
Along with this drop, Bitcoin dominance also fell, preventing altcoins from experiencing significant losses. However, as Bitcoin ranges at this support, its dominance is rising, which is causing altcoins to drop. If this trend continues, altcoins will likely undergo a deeper correction.
I personally plan to open a short position if 101,654 breaks, but I will secure profits quickly and exit fast. On the other hand, if Bitcoin breaks 102,571, I will enter a risky stop-buy long position, as I believe its movement to the upside could be as sharp as its previous drop, and I will set a logical stop-loss.
📉 Weekly Timeframe
Looking at the IMX weekly chart, we see that compared to 2023, it is holding a higher low, which is a bullish sign. However, the fake breakout and rejection at 1.817 led to a return inside the range, and sellers are now attempting to break the range low.
Let’s also talk about the candlestick pattern I highlighted on the chart. I’ve personally seen this pattern many times—it typically appears at the end of a trend and signals a potential reversal. I will discuss it more in the future, but for now, just take note of this behavior.
Additionally, after last week’s candle, IMX is trying to close below the key weekly support and range low at 1.084. If this breakdown is confirmed, it would signal a range breakdown, leading to a bearish correction towards the next major support at 0.764, which would be a 30% drop.
I do not hold IMX, but if I did, my approach would be to exit my holdings upon a weekly close below this level, regardless of whether I was in profit or loss. I would only re-enter if the price reclaimed the range or formed a clear trigger for a new buy position.
📊 Daily Timeframe
IMX is currently sitting on a major support level, which has consistently pushed the price upward in previous attempts. However, this support is showing signs of weakening.
If this level breaks, we will likely see a sharp drop towards 0.764. Given the importance of this level, it’s essential to monitor both bullish and bearish signals. If we see signs of weakness in the bearish trend, it could signal a buy trigger.
However, these triggers require momentum—I will not buy just because the price is sitting on a strong support level. Instead, I will wait for either a fake breakdown or a lower timeframe range breakout before considering a buy. One possible entry trigger could be the breakout of the trendline at 1.252.
⏳ 4-Hour Timeframe
IMX is currently breaking below the 1.061 support, which is a key weekly level. Because this is a high-volatility zone, it’s important to use a logical stop-loss when entering positions to avoid being stopped out unnecessarily.
📉 Short Position Trigger
the trigger is already active, so a short entry is possible. However, if the price lingers in oversold conditions for too long or takes too long to move downward, I recommend securing profits quickly—also keep in mind that it’s Saturday, so consider reducing your risk exposure.
📈 Long Position Trigger
there is no clear trigger yet unless we see a fake breakdown or a sharp recovery back to 1.252, after which a long entry would be valid. If this scenario plays out, there’s no need to feel FOMO, as strong momentum entering the market will provide multiple trading opportunities.
📝 Final Thoughts
Stay calm, trade wisely, and let's capture the market's best opportunities!
This analysis reflects our opinions and is not financial advice.
Share your thoughts in the comments, and don’t forget to share this analysis with your friends! ❤️

Bitcoin(BTC/USD) Daily Chart Analysis For Week of Jan 31, 2025Technical Analysis and Outlook:
During this week’s trading session, Bitcoin reached its targeted Mean Support levels, specifically at 101300 and 98000. This development indicates a probable pullback to retest the Mean Support level of 98000, with the potential for further extension to the Outer Coin Dip positioned at 96000 before a possible resurgence in the bull market occurs. Conversely, should this anticipated pullback not materialize, the currency may experience upward movement, retesting the completed Inner Coin Rally at 108000 and potentially expanding to 110000 and 114500, ultimately challenging the outermost Outer Coin Rally at 122000.

Bitcoin - An unexpected scenario that no one will tell u about!We all know about Bitcoin’s four-year cycle, and many compare the 2025 cycle to those of 2017 and 2021, analyzing common factors like the bull run and the massive price surges Bitcoin and altcoins experienced during those years.
But let me ask you an important question:
What if the bull run doesn’t happen in 2025 at all and this cycle extends until mid-2026?
As you know, the traders who truly profit in financial markets are the ones who think like market makers.
Does it seem logical to you that everyone expects a huge rally in 2025, and it actually happens just as anticipated?
Of course not.
2025 will be a year filled with price volatility designed to exhaust portfolios, drain liquidity, and spread uncertainty among traders.
We’ll see months where Bitcoin and altcoins surge parabolically, followed by months of brutal corrections, which will be less severe for Bitcoin but extremely painful for altcoins.
This price behavior may persist until Q4 2025 -Q1 2026, at which point Bitcoin will likely trade between $130K and $140K. All the analysts will tell you that the cycle has ended and that you should completely exit the market.
But in reality, that will be the true beginning of the bull run.
Bitcoin will continue its uptrend, targeting $300K, aligning with the Cup & Handle pattern target.
This level also corresponds to the 2.0 Fibonacci Retracement , reinforcing its significance as a major price objective.
It will be a violent surge within a short period, with a maximum duration of two months.
Most traders won't anticipate this move, and they will enter the market too late—right at the peak. That’s when the real bear market begins, trapping everyone in the market, just like in every previous cycle.
Best regards Ceciliones🎯

BTC to ETH - time comes to focus on etheriumBTC topped in a large five wave up rally against etherium
That means ETH should be outperforming BTC until we get a large A-B-C corrective structure hitting target 1 and target 2

XRP Parabolic !?As in recent posts, we’ve seen XRP climb from .042 towards $1,$2 and now consolidating a bullish structure in the $2.80-$3.25 range.
With the recent inauguration, new laws being passed including the introductory crypto bill. An XRP ETF has been filed just in the past 48 hours. I expect the SEC battle to be done soon as well as the XRP ETF being made available and accepted. From there i will speculate but like I said before. The trump admin and xrp will lead to an open world source for crypto reserves to be built worldwide. Which will increase the price beyond the point of market cap.
This is just a prediction, NFA. Good luck!

Bitcoin Returns to All-Time HighsThe cryptocurrency has managed to sustain a gain of over 4% in the last two trading sessions, as the market remains confident that Trump’s new administration will play a key role in the future of U.S. regulation. For now, the price is slowly approaching the all-time high resistance zone at 106K.
Neutral Bias
Bitcoin continues to trade within a strong lateral range, with resistance at 106K and support at 91K. The recent bullish momentum has once again brought the price to the resistance zone of the channel. If buying pressure remains steady, the current neutral formation could be challenged, potentially leading to a more significant upward move.
ADX Indicator
One factor that may not fully align with the recent buying spike is the ADX line’s movement. Currently, the ADX line is oscillating below the neutral 20 level, suggesting that recent upward movements lack a clear trend direction. This could lead to short-term bearish corrections, creating resistance at the current price level.
Key Levels
106K: The closest resistance level, positioned at the all-time high zone recorded by Bitcoin in recent weeks. If the price successfully breaks above this level, it would end the current lateral range and potentially trigger a stronger bullish rally in the short term.
99K: The nearest support level, aligning with the midpoint of the current range, the 50-period moving average, and the upper boundary of the Ichimoku cloud. This indicates that 99K serves as an important support barrier against bearish movements in the short term. If the price falls below this level in the coming sessions, it could confirm a bearish bias, undermining current market confidence and extending the lateral range.
91K: The final support level, positioned at the lower boundary of the lateral channel and acting as the last barrier before a potential trend reversal. If the price reaches this level, it could trigger strong bearish pressure in the BTC market.
By Julian Pineda, CFA - Market Analyst

UPDATE: Altcoin Market Set to Surge Toward $1 Trillion Should this pattern hold, we could see the altcoin market targeting full Fibonacci extensions, potentially ripping to all-time highs and pushing the market toward a $1 trillion valuation this cycle.
Momentum is building as liquidity returns to the crypto markets, with growing retail interest and institutional capital eyeing opportunities in diverse altcoin sectors. Rotation out BTC is happening as the BTC rally is losing momentum.

BTC | EXCITING PATTERN | Bullish Pattern in the DailyBTC has formed an interesting pattern in the daily timeframe.
The W-Bottom pattern is a bullish pattern that shows up on the daily timeframe usually when the price is about to go higher. This can be considered as a bullish pattern or even a fractal, if we look at previous price action with the same pattern.
This is likely the impulse that leads to a new BTC ATH as well as a new ETH and SOL all time high, which we are still waiting for:
__________________
BINANCE:BTCUSDT

Bitcoin, Big Picture - 25/2026BTC may retest ~65k zone (old high) to capture liquidity. Post-pullback, expect a bullish rebound to continue the "LTF" uptrend (daily).

$130K HERE WE COME! #BTCRight now I'm seeing so much fear across social media regarding BTC price that I cannot help but post that we are basically in wave 2 correction of a larger wave 5, and the wave 2 has probably ended or is about to end at any moment, so just sit back and relax and keep HODLing on cuz the wave 3 target is $130K minimum!

BTCUSDT Trade LogBTCUSDT – Short Setup into Bearish FVG
Context & Rationale: Price is pushing into a rising channel near a 4H Fair Value Gap (FVG), aligning with a bearish signal. Expecting a potential rejection, especially if upcoming macro news or Fed commentary adds downside pressure.
Trade Idea (Short):
– Entry: Enter short inside or near the 4H FVG region.
– Stop: Tight stop above the FVG boundary (risking 0.5% of account).
– Target: Look for a 1:2 or better risk-to-reward ratio, aiming for key structure lows.
Risk Management: This is a counter-trend play against the recent rally. If price closes above the FVG zone or invalidates the channel, be prepared to exit promptly and reassess.

BTC | Make sure to buy THIS Bitcoin dip!In the past I did a few predictions when people were uncertain and the results of these predictions were quite accurate if I may say. This is not financial advice. My only goal is to sketch a likely outcome for the people that find this information useful.
What we see right now is that we're building a lot of liquidity below. Yes.. I know, there is a mega liquidity area above us and the fundamentals are great. But keep in mind, the marketmakers are not going to let these long traders in these trades before we finally reach $110.000+.
Today is an important day and expect a lot of volatility come back to the market.
Therefore I think that the most likely short term target from this point is $95.000. This is a place were I'm adding to my long term bag. The worst case scenario would be that we spike below $90.000 (maybe up to around $87.000) somewhere this week.
Do your own research and trade safe.

BTC Small Short - Beginning of Altseason SoonSmall short trade on BTC - 1:4 R:R. I think in the next rally we will see alts rip with Bitcoin to the upside and also we will see BTC.D start to fall.


Crypto Alpha Report - January 28, 2025Happy Tuesday, friends! Fancy yourself a trader do you? In today’s episode, let’s face some hard facts and distinguish between a true trader (the 1%) and the gambler (the 99%). Grab a box of tissues, because this one might sting.
Ah, the trader. What a glorious lifestyle. From the luxury of an Adirondack chair on a cozy beach, sipping Mai Tai’s, scalping the one-minute chart, and reeling in a few grand a day. Is this what you initially pictured when you started trading?
Unfortunately, the sad reality is that this is mostly a pipe dream. It’s a lie that’s sold over and over again that appeals to our innate desire to live ‘the good life.’ But, as humans, we gobble this fantasy up and throw our hard-earned capital into the markets - often to disastrous effect.
While it’s not impossible to live this dream, the reality is that most of us focus on the end goal, the Mai Tai and the pretty senoritas, and not the process that achieves the end goal. Backtesting? Boooooring! Strategy creation? Pssh, why do that when all I have to do is find the right memecoin, bet big, and retire?
For every successful story you hear of a meme coin trade gone right, a few thousand traders could show you a -99% loss. Memecoin trading is the new lottery. You do know the odds of hitting the lottery, don’t you?
All right, as if that wasn’t enough fluff, let’s cut to the chase. If you don’t know the statistical odds of your ability to win or lose a trade, you’re not a trader; you’re a gambler. “But I follow price action, bro…” No, stop that; you’re a gambler. I’ve met a handful of price action traders with statistics, and kudos to them. But 99/100 “price action traders” are just gamblers. Confirmation bias, seeing what they want to see, and survivor bias - that’s the cocktail of “smart money concepts.” Hey, if you can backtest it, more power to you. But most of you can’t and won’t.
Building a strategy isn’t sexy, but it’s the difference between sitting down in front of the charts every day and knowing (roughly) how you will do, and sitting down in front of the charts just praying that today will be your lucky day.
Don’t rely on luck; become good. That takes hard work, just like anything else. It also takes a lot of trial and error. Start small and increase capital as your success increases. Slow and steady is the Path to Profit. Fast and loose is the road back to Burger King.
Make today the day you commit to building a long-term strategy. Make today the day you swear off gambling because your lucky day is likely not coming.
Stay frosty, friends.
Crypto Market Update
Stablecoin Dominance
Currently sitting at 5.79%, yesterday saw a strong attempt to break out above 6%, a level I have continually warned is the danger zone for the market, particularly altcoins. However, we did see a strong buy back from the market moving into yesterday’s daily close. This metric is overbought, but any strong close above 6% is a major warning sign.
Stablecoin + Bitcoin Dominance
Currently at 64.75%. This metric is also overbought, and showcasing the same technical position we were in right before Christmas, which led to a two week mark up period for the altcoin markets. Unfortunately, we’re not showing any weakness yet, so speculating on a reversal in altcoins is a high risk move at this point. Watch for a clearer sign of rejection and weakness first.
Altcoin Price Performance Relative to Bitcoin
Altcoins, besides the majors, are still getting obliterated. Underperforming Bitcoin by -24.74% currently. While we are oversold, no signs of strength yet. Perhaps in the next few days we might see a reversal in trend, but all eyes on the upcoming FOMC.
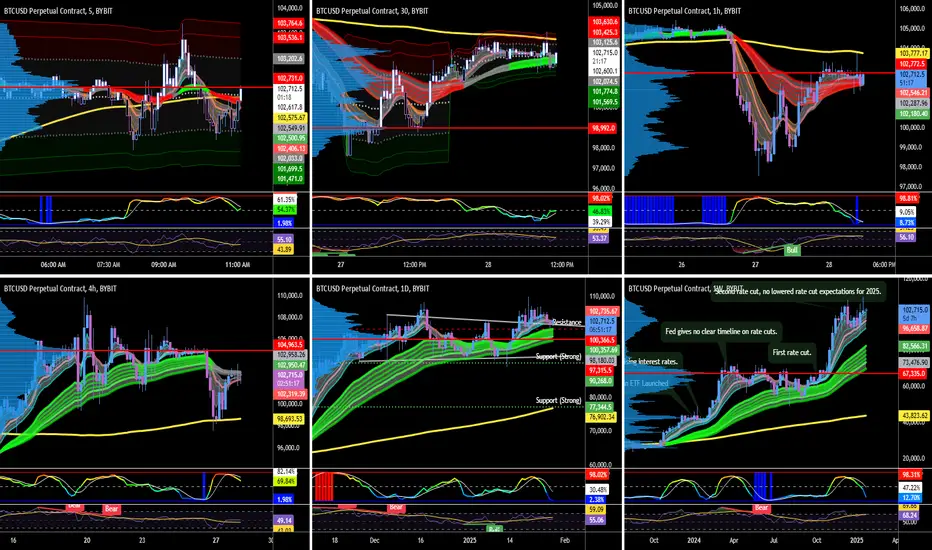
Bitcoin
Trends
5M: Bearish
30M: Bullish
1H: Bearish
4H: Neutral
Daily: Bullish
Weekly: Bullish
After a strong sell off in reaction to the DeepSeek news, Bitcoin did put in a strong buy back at Daily Support. So far, we have not closed below our Daily Trend, nor the Weekly 10 MA. Tentatively optimistic, but I’m quite concerned about a deeper retracement unless we get a rate cut tomorrow.
Key Levels
POC: $104,955
VWAP: $102,609
Value Area Low: $101,569 - $102,079
Value Area High: $103,139 - $103,649
Next Liquidity Zone Above: $104,474 - $105,800
Next Liquidity Zone Below: $98,773 - $99,723
Bitcoin is trading in a relatively tight range today, after yesterday’s big move down. Currently fighting resistance at ~$103,500 with support at $101,566.
Strategy:
Honestly, expecting further downside pressure. Re-evaluate bias on a close above $103,500 - likely a lot of chop and volatility leading into tomorrow’s FOMC. Stay safe.
BTC - 15m Scalp OpportunityCOINBASE:BTCUSD is consolidating within a narrow range, and a breakout could trigger a strong move. Given the sharp drop yesterday, this ascending channel may act as a bearish flag, signaling a potential continuation of the downtrend.
If BTC loses support, expect another significant fall. Watching for a breakdown confirmation!
📉 Stay alert for price action signals!

Did Chinese AI Company Deepseek Cause Bitcoin (BTC) Price Crash?
The cryptocurrency market is known for its volatility, with prices often experiencing sharp swings in short periods.1 Recently, Bitcoin (BTC), the leading cryptocurrency, experienced a notable price drop, sparking discussions and speculation about the potential causes.2 Among the various theories circulating, one has gained particular attention: the suggestion that the price crash was triggered by the emergence of a Chinese AI company called Deepseek.3
Deepseek: A New Player in the AI Arena
Deepseek is a relatively new player in the artificial intelligence (AI) field, but it has quickly garnered attention for its advancements in AI technology.4 The company has been developing cutting-edge AI models, particularly in the realm of large language models (LLMs), which are designed to understand and generate human language.5
Deepseek's emergence has raised concerns among some investors and analysts, who fear that the company's advancements could disrupt the existing AI landscape, potentially challenging the dominance of U.S.-based tech companies.6 These concerns have seemingly spilled over into the cryptocurrency market, with some suggesting a link between Deepseek's rise and Bitcoin's recent price decline.7
The Alleged Connection: Market Sentiment and Uncertainty
The primary argument linking Deepseek to the Bitcoin price crash revolves around market sentiment and uncertainty.8 The theory suggests that the emergence of a strong competitor in the AI space, particularly one from China, has created a sense of unease among investors.9 This unease has led to a risk-off sentiment, prompting investors to sell off their holdings in various assets, including cryptocurrencies like Bitcoin.10
The reasoning behind this theory is that investors may be concerned about the potential implications of Deepseek's advancements. Some may fear that the company's technology could lead to job displacement in certain sectors, while others may worry about the geopolitical implications of China gaining a stronger foothold in the AI industry. These concerns, it is argued, have contributed to a negative market sentiment, which has ultimately impacted Bitcoin's price.11
Analyzing the Claim: Correlation vs. Causation
While the theory linking Deepseek to the Bitcoin price crash is intriguing, it's crucial to approach it with a critical eye. It's important to distinguish between correlation and causation. Just because two events occur around the same time does not necessarily mean that one caused the other.
In this case, it's possible that both Deepseek's emergence and the Bitcoin price crash are coincidental. There could be other factors at play that contributed to the price decline, such as:
• Profit-taking: After a period of price appreciation, some investors may have decided to take profits, leading to a sell-off and a subsequent price drop.
• Market manipulation: The cryptocurrency market is still relatively unregulated, making it susceptible to manipulation.12 Large sell orders or coordinated "pump and dump" schemes could have contributed to the price decline.
• Broader economic factors: Global economic conditions, such as inflation or interest rate hikes, can also impact investor sentiment and lead to sell-offs in various asset classes, including cryptocurrencies.
The Role of Media and Speculation
It's also important to consider the role of media and speculation in amplifying the alleged connection between Deepseek and the Bitcoin price crash. News articles and social media discussions may have contributed to the spread of this theory, even if there is limited evidence to support it.
In the fast-paced world of cryptocurrency, rumors and speculation can quickly influence market sentiment. It's crucial to be discerning about the information consumed and to avoid jumping to conclusions based on limited evidence.
Conclusion: A Complex Picture with No Definitive Answer
The question of whether Deepseek caused the Bitcoin price crash is a complex one with no definitive answer. While the theory linking the two events is intriguing, it's essential to consider other factors that could have contributed to the price decline.
It's possible that Deepseek's emergence played a role in shaping market sentiment, but it's unlikely to be the sole cause of the price crash. The cryptocurrency market is influenced by a multitude of factors, and it's crucial to consider the broader context when analyzing price movements.
As the AI industry continues to evolve and the cryptocurrency market matures, it's likely that we will see more instances of speculation and theories linking seemingly disparate events. It's important to approach such claims with a critical mindset, to distinguish between correlation and causation, and to consider the broader context before drawing conclusions.
