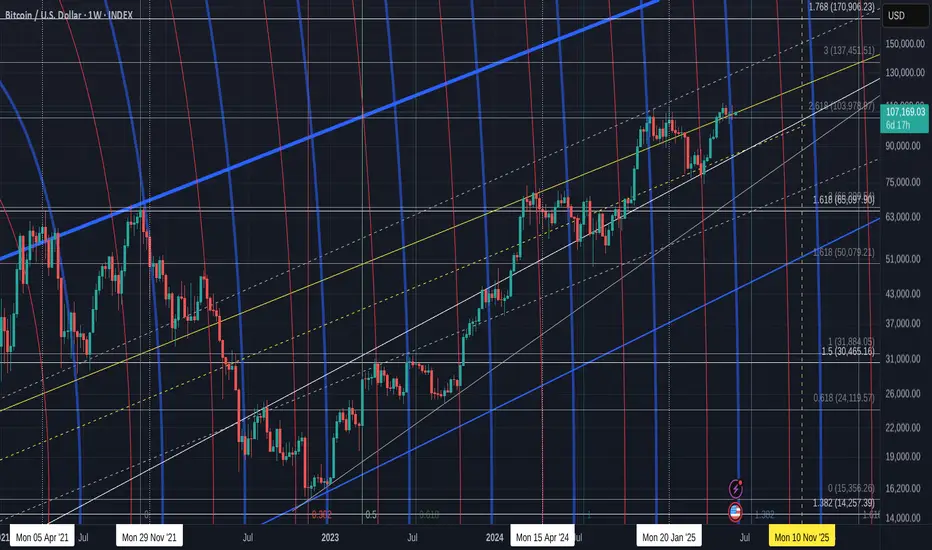
₿itcoin: Continuing B WaveBitcoin has recently reclaimed the key $106,000 level. Under our primary scenario, we anticipate continued increases into the blue Target Zone between $117,553 and $130,891 – where green wave B is expected to conclude. From that corrective peak, we project a significant move lower in wave C, which should ultimately pull prices into the lower blue Target Zone between $62,395 and $51,323. This range is expected to mark the completion of orange wave a. We then foresee a brief corrective rally before wave (ii) completes its broader correction with a final sell-off.
📈 Over 190 precise analyses, clear entry points, and defined Target Zones - that's what we do.
Bitcoinprice

PNUTUSDT Forming Falling WedgePNUTUSDT is presenting a compelling falling wedge pattern, signaling a high-probability bullish reversal. This technical formation typically occurs after a sustained downtrend and is characterized by converging trendlines sloping downward. In the case of PNUTUSDT, the wedge is nearing its apex, indicating that a breakout is likely imminent. The setup is further supported by healthy volume levels, adding credibility to the expected move. Historically, falling wedges often lead to explosive upside moves, and this pair is currently projecting a potential gain of 90% to 100%+ if the breakout confirms.
Market interest in PNUTUSDT is steadily growing, as indicated by rising trading activity and increased visibility across community forums and social platforms. This surge in attention aligns with the volume spike seen during recent trading sessions — a classic precursor to bullish breakouts. As more investors start to take positions in anticipation of a breakout, price momentum can accelerate rapidly, creating ideal conditions for short- to mid-term gains.
From a technical standpoint, a confirmed breakout above the wedge’s upper resistance line could open the door to rapid price expansion, especially with limited overhead resistance. Traders should watch for confirmation signals such as strong bullish candlesticks, increasing volume, or a retest of the breakout level. PNUTUSDT is shaping up as an exciting opportunity for swing traders looking to capitalize on pattern-based moves in the altcoin space.
With bullish sentiment, clear technical structure, and improving market participation, PNUTUSDT could be on the verge of a significant breakout. It’s a setup that combines strong technicals with growing investor interest — a powerful combination in crypto trading.
✅ Show your support by hitting the like button and
✅ Leaving a comment below! (What is You opinion about this Coin)
Your feedback and engagement keep me inspired to share more insightful market analysis with you!

Bitcoin (BTC)and NASDAQ: Intermarket Analysis and the Road AheadIn this four-hour BTCUSD chart, Bitcoin is currently consolidating within a symmetrical triangle pattern ⏳. The price is oscillating between a series of lower highs and higher lows, with the most recent swing high and swing low serving as key reference points for traders. This pattern reflects a market in indecision, awaiting a catalyst for a breakout.
Volume has picked up as price approaches the previous low, suggesting that buyers are stepping in to defend this area, rather than capitulating.
The next significant move will likely be determined by whether price can break above the last swing high or fall below the last swing low. A breakout above the previous high could open the door for a renewed uptrend, while a breakdown below the previous low may signal a deeper correction.
Geopolitical & Fundamental Backdrop 🌍
Bitcoin’s current consolidation is happening against a backdrop of heightened macro and geopolitical uncertainty. Recent global events, such as tensions in the Middle East and shifting US economic data, have contributed to increased volatility across risk assets. Institutional interest in Bitcoin remains strong, and the asset continues to be viewed as a hedge against inflation and currency debasement. However, short-term sentiment is sensitive to headlines and policy shifts.
NASDAQ & Correlation with Bitcoin 📈
The NASDAQ and Bitcoin remain closely correlated, especially during periods of heightened risk-on or risk-off sentiment. The NASDAQ has recently been consolidating after a strong rally, with price action also defined by a series of lower highs and higher lows. The index’s outlook is currently neutral to cautiously bullish, mirroring Bitcoin’s technical structure. If the NASDAQ can break above its recent high, it could provide a tailwind for Bitcoin and other risk assets. Conversely, a move below the last swing low in equities could trigger further caution in crypto markets.
Summary & Outlook 🚦
BTCUSD is at a pivotal juncture, with the next move likely to be determined by a break above the previous high or below the previous low on the four-hour chart.
Macro and geopolitical factors are creating short-term volatility, but the long-term structure remains constructive as long as the broader uptrend of higher lows is maintained.
The NASDAQ’s consolidation and its correlation with Bitcoin suggest that risk sentiment in equities will continue to influence crypto. Watch for confirmation from both markets before taking a directional bias.
Disclaimer:
This analysis is for informational purposes only and does not constitute financial advice. Cryptocurrency and stock markets are highly volatile and subject to rapid change. Always do your own research and consult with a financial advisor before making investment decisions.

Bitcoin Bounce & Breakout PlayChart Analysis:
🔹 Support Holding Strong:
BTC is respecting a key support area (~$105,600), which previously acted as resistance (marked by recent ATH).
🔹 EMA 70 (Blue Line):
Price is hovering above the EMA, adding bullish confirmation.
🔹 Bullish Projection Path:
The chart shows a projected bullish move toward the sell zone near $113,200 – $113,300, representing a potential 4.4% gain from the breakout.
🔹 Key Zones:
Support Zone: $105,600
Supply Zone: $100,500
Sell Zone (TP Zone): $113,200+
📌 Outlook:
If BTC breaks and holds above the resistance (~$107,000), a strong upward rally could follow. Entry near support or on breakout, with tight risk management, offers a favorable risk/reward.
✅ Entry Options:
Breakout Entry:
Trigger: Break and close above $107,200
Confirmation: Retest and hold above the breakout zone
Entry: $107,300 – $107,500
Support Bounce Entry:
Trigger: Pullback to support zone (~$105,600) with bullish reversal candle
Entry: $105,600 – $105,800
🎯 Target Zones (TP):
TP1: $110,400 (minor resistance)
TP2: $113,200 – $113,300 (major sell zone)
TP3 (aggressive): $114,000+
🔻 Stop Loss (SL):
For breakout entry: SL below $106,200
For bounce entry: SL below $105,200 or $104,800 (structure break)
📈 Risk–Reward Ratio:
Approx. 1:2.5 to 1:3+ depending on entry and target
🧠 Trade Management:
Move SL to breakeven after hitting TP1
Partial profit booking at TP1
Trail remaining with manual or dynamic SL (e.g., below EMA or recent low)
⚠️ Risk Notes:
Avoid chasing price without breakout confirmation
Watch for fakeouts and heavy selling near TP zones
Adjust position size based on your risk tolerance

Bitcoin closed week RED but that is OK, it was closeFor the last 3 weeks, Bitcoin has been in a tight range and each candle has been small body and long wicks, showing indecision and uncertainty
This close up chart shows how these 3 weekly candles have occurred at the intersection of a Fib circle (blue) and This alone could explain these "wicky" candles... The Bulls have been fighting hard to keep PA up and to not let it slide down that fib circle, as is normal the majority of the time.
.
We shall find out this week because, now, there is not a lot to stop the Bulls trying harder.
The FED will let us know the decision on interest rates on 18th.
This will likely cause a reaction in markets and I think we are most likely to see Rates remain static.
PA is currently on Support and remains above the 2.618 Fib extension.
All is Good
The MVRV (Green) and Z Score (yellow) can be complicated to fully understand but what is important to understand here is how the Yellow Z Score is still above the Green MVRV. this remains Bullish. We should notice how Both are falling and we wait for them to cross back over that falling line of resistance.
Currently, This chart shows us that Bitcoin has a slightly undervalued price. The higher we go, the more Oversold, Undervalued/ the top is the opposite, overbought / over valued.
The MACD is showing us a s;light levelling off
For me, I think this is similar to what we saw in the end of 2024. The MACD may go back down to the Red signal line and bounce....Again, we have to wait and see. Remember, that just because MACD drops, BTC PA does not always follow. We can range across instead
Over all, I am still Bullish long term but we may see some continued uncertainty in this market. The FED decision later this week will have an impact for sure
Bitcoin remains strong though but should circumstances allow, we could revisit 90K on that trend line below current position. I am not to sure this will happen but a good idea t be ready if it does.
What is certain is how PA has never really been in such a "soft" controlled action.
The nearest we have is way back in 2016 to 2016.
At this time period, we also saw BTC PA rise in a slow steady rise, no sharp pushes higher till the final push to ATH.
Currently, we seem to have repeated a similar Acton though. now, for longer
So, we wait and we will find out..
BTC “Golden Cross” Looms, but Geopolitics Could Delay ItBitcoin’s “Golden Cross” Looms, but Geopolitical Shocks Could Delay the Breakout
Deep dive into price action, derivatives, on-chain data, and the tug-of-war between Middle-East risk and crypto bull-run momentum
________________________________________
Table of Contents
1. Executive Summary
2. Scene-Setter: BTC at $105 K in a World on Edge
3. Technical Spark: What a Golden Cross Really Means
4. Price Action: From $103 K Dip to $106.8 K Hurdle
5. Options Market: A Sudden Lurch Toward Puts
6. Macro Overhang: Why Israel–Iran Turmoil Matters to Bitcoin
7. On-Chain Pulse: 656 % Cycle Gain, Yet Supply Is Tighter Than 2021
8. Mining Fundamentals: Difficulty Eases, Margins Improve
9. Corporate Treasuries: The Quiet, Sticky Bid
10. Targets & Scenarios: $97 K Downside vs. $229 K Upside
11. Strategy Playbook for Traders & Investors
12. Conclusion: Delayed, Not Derailed
13. Disclaimers
________________________________________
1. Executive Summary
• Bitcoin (BTC) is trading in a tight $103 K–$108 K band, unable to confirm a breakout as Middle-East tensions push investors into hedging mode.
• A Golden Cross—the 50-day SMA crossing above the 200-day—could flash within 10 trading sessions, historically adding +37 % median upside over the subsequent 90 days.
• Options flow has flipped decisively toward puts, with the 25-delta skew hitting –10 %, its most bearish since the FTX collapse, signaling short-term anxiety even as long-term bets remain bullish.
• On-chain metrics (exchange balances at six-year lows, HODLer supply at all-time highs) reveal structural demand; Glassnode notes a 656 % cycle advance despite a trillion-dollar market cap.
• Analysts’ upside targets range from $140 K (Q3) to $270 K (October) and even $229 K based on the Golden Cross fractal. Yet a clean break of $104 K support opens room to $97 K first.
________________________________________
2. Scene-Setter: BTC at $105 K in a World on Edge
Bitcoin entered 2025 with a blistering rally—spot ETFs hoovered nearly 200 K coins in four months, miners sold aggressively into strength, and macro tailwinds (Fed easing, USD weakness) fueled risk appetite. Then two macro curveballs hit:
1. Sticky U.S. core inflation revived “higher-for-longer” rate fears.
2. Israel–Iran hostilities spooked global markets, sending Brent crude to $76 and sparking a dash for USD liquidity.
BTC, once heralded as “digital gold,” behaved like a high-beta tech stock: it slipped 7 % in 48 hours, tagging $103,200 before bargain hunters stepped in. As of this writing, price sits near $105,800—right on the 100-hour SMA. Whether we escape the range depends on which force proves stronger: geopolitical dread or the long-term structural bid.
________________________________________
3. Technical Spark: What a Golden Cross Really Means
A Golden Cross occurs when the 50-day simple moving average (SMA-50) crosses above the 200-day (SMA-200). In Bitcoin’s 14-year history, we have logged nine such events:
Year Days to Cross 90-Day Return 180-Day Return
2013 51 +88 % +202 %
2015 73 +34 % +67 %
2019 46 +193 % +262 %
2020 38 +77 % +112 %
2023 59 +29 % +48 %
Median 90-day gain: +37 %
Median drawdown post-cross: –12 %
We are ~$700 shy of triggering the cross (SMA-50 at $97.9 K, SMA-200 at $98.1 K and rising). Assuming volatility stays muted, the lines converge within two weeks, potentially firing a widely watched buy signal. But remember: the cross is lagging; smart traders anticipate, not react.
________________________________________
4. Price Action: From $103 K Dip to $106.8 K Hurdle
Key intraday levels (Kraken feed):
• Support 1: $104,000 – prior weekly low + bullish order-block
• Support 2: $101,200 – 0.786 Fib retrace of the Feb–Mar impulse
• Bear Pivot: $97,000 – 200-day EMA + high-confluence volume node
• Resistance 1: $106,800 – last week’s swing high; three failed probes
• Resistance 2: $108,500 – May monthly open
• Bull Pivot: $113,000 – neckline of the March distribution range
Monday’s bounce broke a declining trend-line from $110 K, printing a higher low—constructive, yet bulls require a daily close >$106.8 K to invalidate the short-term bearish structure.
________________________________________
5. Options Market: A Sudden Lurch Toward Puts
Deribit data (largest BTC options venue):
• Put/Call Ratio: 0.62 last Friday → 0.91 today
• 25-Delta Skew (1-month): –10 %, lowest since Nov-2022
• Max-Pain for April 26 expiry: $104 K (huge open interest)
Translation: traders rushed to buy protective puts as Iran war headlines crossed. Market-makers, short those puts, delta-hedged by shorting spot or perpetual futures, adding downward pressure—classic gamma feedback loop.
Yet term structure remains contango; June and September IVs price higher topside. Institutions appear to sell near-dated panic, accumulate long-dated calls—a bullish medium-term stance.
________________________________________
6. Macro Overhang: Why Israel–Iran Turmoil Matters to Bitcoin
1. Risk-Off Correlation: Despite “digital gold” narratives, BTC’s 30-day correlation with the Nasdaq-100 sits at 0.64; equities slide → crypto follows.
2. USD Liquidity Drain: War premium lifts oil, stoking inflation and forcing the Fed to delay cuts; higher real yields pressure non-yielding assets.
3. Regulatory Optics: Heightened national-security chatter emboldens lawmakers keen to scrutinize crypto, a perceived sanctions-evasion channel.
4. Regional Flows: The Middle-East hosts some of the largest sovereign-wealth pools; risk aversion could pause their crypto allocations.
5.
Hence, every missile headline becomes a volatility catalyst. Still, flash-risk events fade quickly if energy supply stays intact, offering windows for BTC to re-assert its secular trend.
________________________________________
7. On-Chain Pulse: 656 % Cycle Gain, Yet Supply Is Tighter Than 2021
Glassnode frames Bitcoin’s ongoing bull as “one of the most explosive relative to market cap gravity.” Highlights:
• Cycle Return: 656 % from the $14 K November-2022 bottom—impressive given the asset is now >$2 T in free-float value, dwarfing 2017’s sub-$100 B base.
• Exchange Balances: Just 2.02 M BTC on centralized venues—13-year low.
• Realized Price (short-term holders): $92,500—suggests marginal buyers remain well in profit.
• Entity-Adjusted Dormancy Flow: At 275 K BTC/day vs. 2021’s 550 K—implying HODLers are less willing to spend.
Put simply: even after a seven-fold rally, supply scarcity persists.
________________________________________
8. Mining Fundamentals: Difficulty Eases, Margins Improve
The April 20 adjustment saw difficulty dip 1.2 %, the first contraction since January. Why it matters:
• Post-Halving Breathing Room: Block subsidy fell to 1.5625 BTC; a difficulty rollback cushions miner profit margins, lowering forced selling risk.
• Hashrate Plateau: Network hashrate hovers at 640 EH/s, only 3 % off the ATH—miners remain confident.
• Transaction Fees: Average fee per block = 0.37 BTC, still elevated by historical standards thanks to BRC-20 activity.
Miners thus appear cash-flow stable, reducing downside pressure on spot markets compared to previous post-halving eras.
________________________________________
9. Corporate Treasuries: The Quiet, Sticky Bid
Since MicroStrategy cracked the dam, 68 public companies now hold BTC on balance sheets, totaling 412,000 coins (~$43 B). Recent newcomers:
Company Purchase Date BTC Added Avg Cost
SemiconX Feb-2025 2,500 $94,800
Nordic Logistics Mar-2025 800 $98,200
Atlantech Energy Apr-2025 1,200 $101,500
Traits of corporate treasuries:
• Long-Dated Liabilities: Align with Bitcoin’s four-year halving cadence.
• Low Turnover: None of the 68 have sold core holdings despite 80 % drawdowns in 2022.
• Regulatory Transparency: SEC filings broadcast purchases, inviting copycat demand.
This sticky bid stabilizes spot markets during macro squalls.
________________________________________
10. Targets & Scenarios: $97 K Downside vs. $229 K Upside
Bearish Path (30 % probability)
• Trigger: Israel–Iran broadens, Fed signals no cuts in 2025.
• Price Action: Break $104 K, bulls capitulate at $97 K (200-day).
• Depth: Could wick to $88–90 K (0.618 retrace) if macro gloom persists.
Base Case (50 % probability)
• Trigger: Skirmishes contained; oil cools, Fed cuts twice by December.
• Price Action: Golden Cross confirms, BTC grinds to $128 K by September.
• Highs: $140 K tap as ETF inflows resume.
Bullish Path (20 % probability)
• Trigger: Middle-East cease-fire + ETF FOMO round two + dovish Fed pivot.
• Fractals: Prior Golden-Cross extensions averaged +120 % at extreme.
• Price Action: $150 K by summer, $229 K (Fib 2.618 from 2022 low) by year-end.
• Blow-Off: $270 K October spike before the next cyclical bear begins.
________________________________________
11. Strategy Playbook for Traders & Investors
Horizon Bias Instruments Risk Management
Intraday (0–48 h) Range scalp $104–$107 K Perp futures (5× max), options gamma scalping Hard stop $103 K; position <1 % equity
Swing (2–8 wks) Buy pullbacks ahead of Golden Cross Spot, dated futures roll, 1-month $110 K calls Stop $97 K daily close; size 5–10 %
Position (3–6 mo) Accumulate for $140–150 K target Spot, June/Sept call spreads ($120/150) Hedge via 25 % put collar
Long-Term (1–4 yr) Maintain core stash; ignore noise Cold storage, DCA Re-balance only when price doubles
Optional hedge: Long Gold / Short BTC ratio spread as a geopolitical shock absorber; ratio 1.3 currently, mean-reverts to 1.1 post-crises.
________________________________________
12. Conclusion: Delayed, Not Derailed
Bitcoin stands at a crossroads: a textbook Golden Cross beckons, ETF inflows smolder, miners relax, and corporate treasuries drip-feed demand. Yet war headlines and a cautious options market act as sandbags on the balloon. History says macro shocks slow, not stop secular bull cycles. Unless Middle-East conflict strangles global liquidity or the Fed slams the brakes far harder than priced, BTC’s higher-time-frame structure remains bullish. Expect turbulence, embrace risk controls—but don’t mistake a weather delay for a busted engine.
________________________________________
13. Disclaimers
This article is for educational purposes only and does not constitute financial advice. Cryptocurrency investing involves substantial risk; never invest more than you can afford to lose.

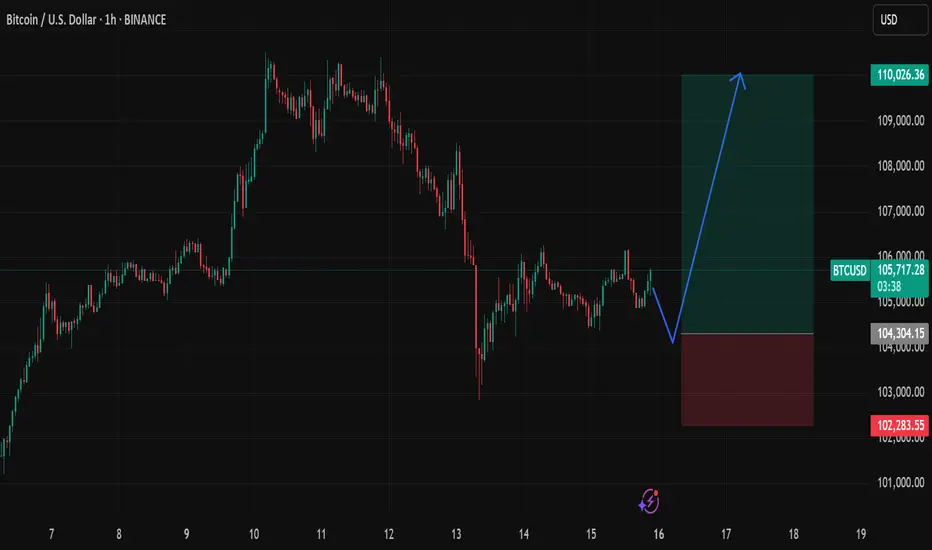
Waiting for a short-term BTC buy — easy setup, clean trade.No need for words — just follow the arrow and check the risk/reward.
I'm starting a signal room soon, but for now, it's all free. Watch and decide for yourself.
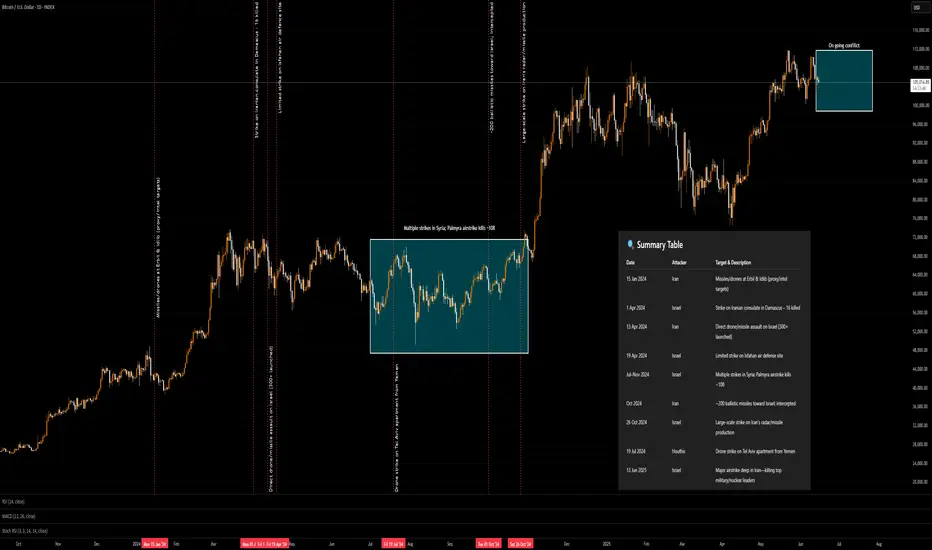
Major Conflict (Isreal - Middleeast and Iran) on CryptoAs you can see crypto is doing its own and what general markets are doing in general. I applied the dates thanks to ChatGPT to make a summary table. you can see these issues over the past two years did not make a huge impact.
The only problem is Iran's response might not be as short as the last time. therefore I am guessing a range of timeframe rather than a vertical line.
Remember any higher escalation will lead the risky assets to dump and off-risk assets rise, such as Oil and Gold.
Usually Summer time is not very profitable for crypto and as I stated in my last Youtube video I am expecting boring price action in June 2025.
This chart can clearly shows, as long as it not become a major international issue and world wide panic, such as 2019 and 2008 it would be scary moments for few weeks at top
Bitcoin(BTC/USD) Daily Chart Analysis For Week of June 13, 2025Technical Analysis and Outlook:
Throughout the past week, Bitcoin has exhibited considerable volatility. After reaching a peak at the first Mean Resistance level of 109500, the cryptocurrency experienced a significant decline. Nevertheless, on Friday, Bitcoin demonstrated a notable recovery, ascending to a newly established resistance now designated as the new Mean Resistance level marked at 110300.
At this juncture, Bitcoin is retracing downward as it retests the initial Mean Support level of 104000 while aiming to target the Mean Support at 101500 and the ultimate Inner Coin Dip at 96500. It is essential to recognize the potential for an upward rally from the Mean Support levels of $ 104,000 and/or $ 101,500, which could culminate in a retest of the Mean Resistance level of $ 110,300.

Bitcoin Prediction Update - BTC Crashed as expected! What’s nextBitcoin Crashed as Predicted! I am updating the current price action of CRYPTOCAP:BTC , and if we can reach our main target of $93K! Smash the Rocket Button if you did not completely hate this update! See you very soon again!

Bitcoin weekly / Daily showing a Dip to sub 100K possibleBitcoin weekly / Daily showing a Dip to sub 100K possible but is avoidable.
On the weekly, we can see how PA is top of Range, just below the arc that has rejected everything since 2011.
There is more resistance overhead than support below and the first Real line of support sits around 103,599 , 101K then we go to 98K.
If we loose 98K for some strange reason, it is a png drop to around 88K - I doubt we will see that just yet.
However, as you can see on the weekly chart, that is the area of a STRONG line of support that has been used this cycle 4 times to propel PA higher.
The Indicators are Bull Bear Power, showing the momentum of the Trend. We have just begun a Red Bear Candle..gut this is currently sitting on a line of resistance....
The RSI is above its average and has just been rejected off the high, so the likelihood os that this will retreat lower in time or with a sharp drop.
The ADX shows trend strength NOT DIRECTION. This has just turned and has begun rising and with BTC PA falling, it suggests the beginning of a Bear trend - MAYBE
Looking at the Daily
We can see once again, PA got pushed away from the Arc of Resistance ( blue) and has begun falling.
The Bull Bear power chart shows ua how the Bears maybe meeting resistance right now and we may see a drop in bear power in the near future.
RSI has fallen below its average now and now has bumped into the Neutral line that does offer support, as we saw recently and in early 2025
Again, the ADX is Low and turning up , indicating a new trend maybe forming but we have to wait to see what this maybe
To conclude, we need to wait to get a clearer picture right now but it seems almost certain that a new trend is forming.
On the shorter term we have the chance of a bounce back / Range horizontal at current price range but the longer term looks a little more bearish for now
We are half way through June and as suggested in my posts about monthly colour candle close, It seems that a Red June candle would be a Good thing but it needs t be a not to deep candle.
So 2 more weeks of scary PA would be OK but nerve raking.
We shall have to watch close here....

BITCOIN 2.5% Potential DropIt seems like BINANCE:BTCUSDT has lowered its trading volume and is potentially looking to make a correction in the upcoming days.

BTCUSDT – Ready for the Next Leg Up?Bitcoin is currently consolidating around $107,000 after a strong rally from the ~$73,000 region. I'm using Fibonacci extensions and key support/resistance levels to anticipate potential continuation targets and pullback zones.
Technical Analysis:
Fibonacci retracement levels from previous move:
0.786 – ~$102,359 → strong local support
0.618 – ~$96,382
0.5 – ~$92,185
Current price: ~$106,990
Key resistance: ~$109,971 (Fib 1.0 level)
Potential bullish targets:
1.618 extension → ~$131,956 (medium-term target)
2.618 extension → ~$167,530 (long-term projection)
Bullish Scenario:
If BTC holds above the $102K–$104K area, we could see continuation towards $110K, followed by a breakout toward $132K (1.618 Fib). The structure remains bullish as long as higher lows are maintained.
Bearish Scenario:
A break below $102K opens the door for a deeper retracement toward $96K or even $92K, which aligns with 0.618 and 0.5 Fib levels, respectively.
Conclusion:
Bitcoin is sitting at a critical point. A short-term dip might offer a strong buy-the-dip opportunity. The market structure still favors the bulls unless key support levels are broken.

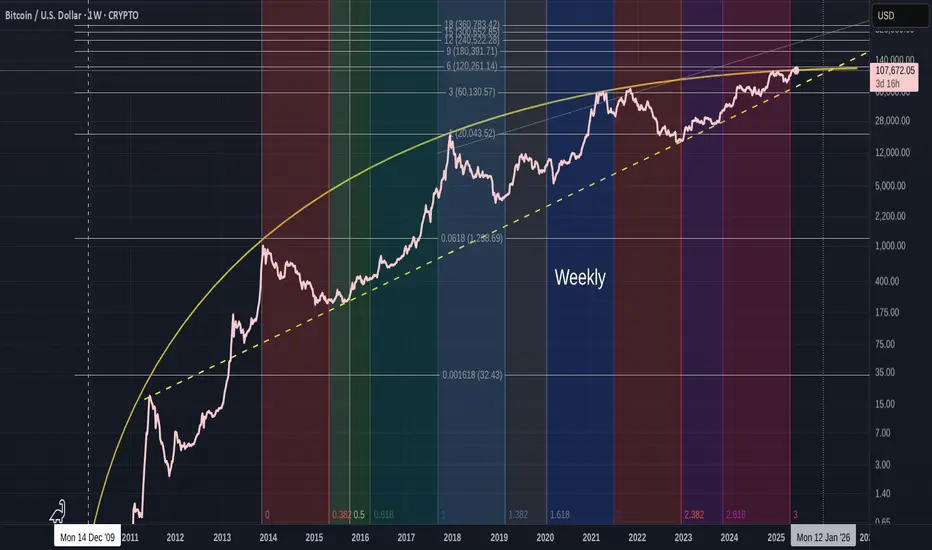
Bitcoin life cycle-stage One ending-Next cycle has to start NOW
There are 3 things to see in this chart
1) The Orange Arc of resistance. I have talked about this previously but to recap a little, it has its origins in Oct 2009 and has rejected EVERY ATH since then, as you can see on the chart. The Arc itself is part of a Fibonacci Spiral.
This Arc has begun to Squeeze PA against the lower trend line, that was formed in 2011.
And we are now in a position where PA MUST react or get pushed below the Long Term line of support.
This could be called Make or Break time for Bitcoin.
The Apex of this pennant is around Jan 2026
PA always reacts before the Apex.....99% of the time.
2) The Vertical Coloured bars are Trend Based Fibonacci Time, It begins on the 1st ATH in the channel that Bitcoin created. This channel is shown in the chart below
See how the Runs to the 2017 & 2021 ATH were all in a Bullish Green zone and how PA never retouched the lower trend line of support in this time
Since Mid 2021, we entered a Bearish Zone.
On the main chart, you will notice how this Fib Time has just ended.
3) The Trend based Fibonacci Extensions. Every single ATH rejected off a Fib extension.
The Root is at the 2009 Low and 1 is at the First ATH in the Bullish Fib time Zone.
The numbers here are all based off the 3,6,9 number sequence.
Lets look a little closer at the weekly chart
As we can see, PA got repeatably rejected off this orange Arc of Resistance and Current PA has been up there, trying to break through since 2024.
Many people have also commented on how PA has been so subdued this cycle and could this be reflected in the Fib Time showing us that we are in a Red Bearish Zone.
See how, from Mid 2021, when we entered a Strong Red zone, PA took a Deep dive off the Nov 2021 ATH.
Also note how this zone ended in late 2022 and in Jan 2023, PA began its current cycle Run. See the change in Colour ?
And Currently, while Bitcoin tries to break out of this squeeze, we were in a Red zone again....that just ended.
AND we can also see that we have not yet reached the 6 Fib Extension at 120,251 usd
The situation we face here is that if PA gets rejected off that Fib line, having just broken through the Arc, we could get pushed right back down under the Arc again. It is VERY STRONG RESISTANCE
This next move from Bitcoin HAS to be strong enough to take us up to the 9 fib line at 180,391 usd at a minimum. This way we can use the 6 Fib extension as support when PA cools off from a big push and so remain above the Arc and begin the Next long term cycle.
The Daily chart below shows us where we are right now
You can see how PA has repeatably tried to break above the Arc and been rejected Firmly Every time...so far, PA has avoided going right back down to the Lower trend line and has remained in near distance to this Arc..But we are running out of Time.
Recent attempts by PA have been Strong and I am sure that we will make it over but the real question is can we also get over that 6 Fib extension and stay above.
The weekly MACD certainly has enough strength to cope
Should we have a subdued Summer trading on Bitcoin, we will see this MACD cool off and be stronger before a sustained push near Autumn maybe.
To conclude, Bitcoin is under pressure to move out of its First Full Cycle.
It is getting Squeezed and now it is time for Bitcoin to prove it can cope with its new found "Adulthood"
The Next Big push, maybe later in the year, could very realistically reach 200K or more and this would place us Above that 9 Fibonacci extension I talked about earlier.
Of course, events could change and we could see PA collapse back below the Arc.
If this happens, all is NOT lost but it would certainly weaken the case for Long Term holders to continue doing so.
This then could create a Snownall effect and prices may tumble....And I will buy MORE....
Either way, we are in a HUGE moment for Bitcoin and I am privileged to be able see this all unfold...
Lets see what happens but, for me, I am Still VERY Bullish though Cautious....
We may have to revisit low 70K in the near future if Pa cannot get over this Arc and the 6 Fib extension
Last week Bitcoin created massive liquidity at a key resistance!🚨 Bitcoin Update – A Bullish Storm Is Brewing? 💥
Last week, Bitcoin created massive liquidity at a key resistance zone, and guess what? That liquidity is still untouched. The market hasn’t fully tapped into it yet — and that’s a big deal.
Recently, BTC smashed through resistance and even left behind a Bullish Fair Value Gap (FVG), signaling strength. But hold on—after this breakout, the market is showing signs of a minor pullback, likely to retest its marked IRL (Important Reaction Level).
📉 It’s cooling off temporarily... but don’t blink. This zone could act as a springboard for the next big leg up.
💡 Here’s the kicker: there’s still a ton of liquidity waiting above. If the market wants it—and it usually does—there’s a high probability (80%+) of another bullish push.
👀 Watch this area closely. It’s a make-or-break zone.
📊 Do Your Own Research (DYOR) – this is not financial advice, just a friendly nudge from the charts.

BITCOIN BIASWe saw price broke a resistance structure followed by an inducement. Currently anticipating a reacting back to either breaker block or order block for a potential entry to go LONG.

BITCOIN SHORT TERM UPDATE!!! Recently we have seen a great price move from 100K to 110K. We got clear Change Of Character , which indicates a sign of strength. Also we got bearish cypher harmonic pattern formed. So now we can expect a slight pullback up to 106-103k region from there we may see price reversing. But price should hold 100.3K region to remain bullish in short term.

AUSDT Forming Bullish ReversalAUSDT is showing early signs of a bullish reversal, supported by increasing volume and strong recovery candlesticks after a steep decline. The chart suggests a consolidation phase has completed, and the asset is preparing for a potential continuation to the upside. Although this setup may not be as aggressive as others, the market structure implies that a healthy gain of 20% to 30%+ could be realistic in the short term. Traders looking for a balanced risk-reward scenario may find this pair appealing.
What stands out about AUSDT is the strong buying interest that has recently emerged, with the price bouncing back from its lows on notable volume. This could be an indication of accumulation by smart money or early positioning before a breakout. If this momentum continues, the price may establish a steady uptrend with a series of higher highs and higher lows, signaling continued bullish sentiment.
As the broader market conditions stabilize and liquidity flows back into promising altcoins, AUSDT could benefit from increased visibility and investor interest. While the expected gain isn't extreme, the gradual upward movement makes this an attractive play for swing traders and investors who prefer steadier, technically sound setups.
With market momentum shifting and technical indicators aligning for a breakout, AUSDT is worth watching in the coming days. Price action will likely respect the projected levels outlined on the chart, making it a timely candidate for a short-to-mid-term bullish setup.
✅ Show your support by hitting the like button and
✅ Leaving a comment below! (What is You opinion about this Coin)
Your feedback and engagement keep me inspired to share more insightful market analysis with you!

Doge Double Trouble $0.22 or $0.17 NextTwofer Doge . 10-15% move either way likely based on how bitcoin does.
Breakout
0.224
Breakdown
0.172
Decided to throw this chart together based on my original idea of the end to end cloud touch that is working out well.

Do technical signals show Bitcoin’s path to $130K? Do technical signals show Bitcoin’s path to $130K?
Bitcoin briefly pushed above $110,000 for the second time this month, before pulling back slightly to trade around $109,500. The market consolidating just below the 61.8% Fibonacci extension level could be suggesting strong resistance is being tested near current levels.
Bitcoin remains within reach of its all-time high at $111,965, set on May 22.
The latest upward move may have been supported by comments from U.S. Commerce Secretary Howard Lutnick, who said trade talks with China in London were progressing well and likely to extend for a third day.
CNBC analyst Todd Gordon expects a breakout toward $130,000 according to his weekly chart analysis. According to our chart, A breakout above 111,897 could open the path to the 78.6% extension around $122,093, followed by the 100% extension target at $135,081

$BTC - Top Down BYBIT:BTCUSDT.P Top Down (10/06/25)
V-Levels Bias
Weekly = Bullish
Daily = Bullish
10-Hour = Bullish
1-Hour = Bullish
V-Levels Momentum
Weekly = Bullish
Daily = Bullish
10-Hour = Neutral
1-Hour = Neutral
Analysis & Insights
DeCode Market Breakdown
Macro Context
Overall, the Weekly structure remains bullish — both in bias and momentum. We’re trading below a key level at $111,968.0, and continuation is likely unless we see a clear Failed Auction at that level.
That would trigger some serious red flags and force a reevaluation of the directional bias.
Daily Chart
Daily structure is extremely bullish at the moment.
The price recently showed a Failed Auction around the $102,000.0 V-structure Higher Low — indicating aggressive absorption and buyer strength.
As long as price holds above that area, the priority is to stay on the long side.
⸻
10-Hour Chart
Still holding a bullish structure overall.
One thing I’ll be watching closely: the price reacting to the previous High at $110,660.8.
If we get a rejection + Failed Auction at that level, that opens up the possibility for intraday shorts; as a short-term shift in momentum and local resistance kicks in.
1-Hour Chart
📈 Long Setup: Waiting for a clean entry from an OTE / Fib zone + Over/Under structure.
📉 Short Setup: Watching for a sweep of the current highs + a clear Failed Auction (ideally with footprint confirmation).
There’s visible compression between $104k and $105k, so price might look to grab liquidity there first before any real move upward.
10-Min Chart
Currently, no clear trade setups on the 10M.
The 1H hasn’t reached optimal trade zones yet. I’ll be watching closely for any structure shifts or setups aligning with the macro bias.
⸻
🔍 Trading Plan Summary
Bias: Bullish (Weekly + Daily)
Look for longs aligned with HTF support + intraday confirmation
Short opportunities only if we get clear rejection from $110,660.8 + footprint signals

Today's Bitcoin Signal: Time to be braveHello friends🙌
Given the good price movement from support and buyers entering, now we can enter the position with capital and risk management and move with it to the specified targets.
🔥Join us for more signals🔥
*Trade safely with us*

Bitcoin Approaches Resistance as Momentum Cools: What’s Next?Bitcoin has been on a strong upward trend 🚀, but recent moves show signs of exhaustion as it approaches major resistance zones 🛑. The appearance of a three-drive pattern on the 4-hour chart, suggests the market could be due for a healthy correction 🔄. While the broader trend remains bullish, I'm watching for a potential pullback and then looking for renewed strength (bullish BoS) before considering new long positions. Patience and confirmation are key in these conditions! 👀✨
