Bitcoin Breaks Out: Bullish Momentum Builds Above Key LevelsHello guys!
The chart of Bitcoin reveals a significant bullish breakout, characterized by two key technical developments:
Broken Ascending Channel:
Bitcoin was trading within an ascending parallel channel, gradually making higher highs and higher lows. This channel was recently breached to the downside, suggesting a temporary weakening in momentum.
False Breakdown and Strong Reversal:
Despite the initial breakdown from the channel, Bitcoin swiftly reversed and surged upwards, reclaiming previous support levels with strong bullish candles. This “fake-out” move often traps bears and reinforces bullish sentiment.
Trendline Breakout:
More notably, BTC has broken above a descending trendline, which had acted as a resistance zone. This breakout, backed by strong volume and momentum, indicates a shift in market structure from consolidation to potential expansion.
Projected Upside Target:
Based on the breakout projection drawn on the chart, the next major resistance appears near the $109,600 level. This aligns with the upper purple dashed line, which may represent a historical resistance zone or a Fibonacci extension.
Bitcoinprice

Bitcoin Price: HODL Mode Fuels $140K ATH PushBitcoin, the pioneering cryptocurrency, is once again at the forefront of financial discussions, exhibiting a remarkable display of resilience and strength that points towards an imminent surge to uncharted price territories. The current market narrative is dominated by several compelling indicators: a significant increase in long-term holders, a climbing realized capitalization, the inherent stability provided by its difficulty adjustment mechanism, and a pervasive return to "HODL mode" among investors. These factors, combined with recent price action and expert analyses, suggest that Bitcoin is not just preparing for new all-time highs but is solidifying its position as a mature and indispensable asset in the global financial landscape.
Long-Term Holders Strengthen Their Grip: A Foundation for Future Growth
One of the most telling indicators of Bitcoin's underlying strength and investor conviction is the behavior of its long-term holders (LTHs). These are addresses that have held their Bitcoin for an extended period, typically over 155 days, signaling a strong belief in its future value rather than short-term speculation. Recent data reveals a significant uptick in the number of these steadfast investors, indicating a profound shift in market sentiment. This trend is critical because it removes a substantial portion of the circulating supply from immediate selling pressure, creating a scarcity that naturally supports price appreciation.
The "HODL mode" phenomenon, a term coined from a misspelling of "hold" in a 2013 forum post, perfectly encapsulates this behavior. It describes the strategy of buying and holding cryptocurrencies regardless of price fluctuations, driven by a long-term bullish outlook. The return of this "HODL mode" is not merely anecdotal; it is quantifiable through on-chain metrics. When long-term holders accumulate and resist selling, it signifies a collective conviction that current prices do not reflect Bitcoin's true intrinsic value or future potential. This behavior creates a strong psychological floor for the price, as fewer coins are available for sale on exchanges, making it harder for large sell-offs to occur.
Complementing this, Bitcoin's Realized Cap has been climbing to uncharted territory. The Realized Cap is a variation of market capitalization that values each Bitcoin at the price it was last moved on-chain, rather than its current market price. It essentially represents the aggregate cost basis of all coins in circulation. When the Realized Cap climbs, especially to new all-time highs, it indicates that a significant amount of Bitcoin has been acquired at higher prices and is being held, suggesting that the overall market is holding onto its coins with stronger conviction. This metric serves as a robust measure of the network's fundamental value and the collective cost basis of its investors. Its ascent to new peaks underscores the increasing capital flowing into Bitcoin and the growing confidence among those holding it. This phenomenon is often observed during bull markets, as new capital enters the ecosystem and existing holders refuse to sell, signaling a healthy and maturing market.
The strengthening grip of long-term holders and the rising Realized Cap collectively paint a picture of a market that is fundamentally sound and poised for sustained growth. It suggests that Bitcoin is moving from a speculative asset to a more mature store of value, attracting investors who are less concerned with short-term volatility and more focused on its long-term potential as a digital asset.
Bitcoin's Difficulty Adjustment: The Engine of Predictable Monetary Policy
One of Bitcoin's most ingenious and often underestimated features is its difficulty adjustment mechanism. This self-regulating system ensures that new blocks are found, and thus new Bitcoin are mined, at a remarkably consistent rate of approximately every 10 minutes, regardless of the total computational power (hash rate) dedicated to the network. Every 2,016 blocks, or roughly every two weeks, the network automatically adjusts the difficulty of the mining puzzle. If more miners join the network, increasing the hash rate, the difficulty increases, making it harder to find the next block. Conversely, if miners leave, the difficulty decreases.
This mechanism is the bedrock of Bitcoin's predictable monetary policy. Unlike traditional fiat currencies, whose supply can be arbitrarily increased by central banks, Bitcoin's supply schedule is immutable and transparent. The difficulty adjustment ensures that the issuance of new Bitcoin remains consistent until the total supply of 21 million coins is reached. This predictability is a cornerstone of Bitcoin's value proposition as a sound money alternative. It eliminates the uncertainty and potential for inflation that plagues fiat currencies, making Bitcoin a reliable store of value over the long term.
The consistent block time and predictable supply schedule, enforced by the difficulty adjustment, contribute significantly to Bitcoin's appeal as a deflationary asset. Investors are drawn to assets with a finite and transparent supply, especially in an era of unprecedented global monetary expansion. This mechanism not only secures the network from external attacks by making it prohibitively expensive to manipulate but also instills confidence in its long-term scarcity and value. It is this algorithmic certainty that underpins Bitcoin's potential to become a global reserve asset, providing a stark contrast to the discretionary policies of central banks.
Why are Bitcoin and Crypto Prices Going Up Today?
The recent surge in Bitcoin and broader cryptocurrency prices can be attributed to a confluence of factors, many of which are interconnected with the underlying strength discussed above. Bitcoin's impressive climb past $107,000 and its break above $108,000 at the start of the week are not isolated events but rather manifestations of building bullish sentiment.
One primary driver is the return of institutional interest and capital inflows. As Bitcoin matures and gains regulatory clarity in various jurisdictions, traditional financial institutions are increasingly comfortable allocating capital to the asset class. This institutional adoption provides significant buying pressure and lends legitimacy to the market. The establishment of Bitcoin ETFs in various regions, for instance, has opened new avenues for institutional investors to gain exposure without directly holding the underlying asset.
Secondly, the macroeconomic environment continues to play a pivotal role. Persistent inflation concerns, coupled with the potential for further quantitative easing by central banks, drive investors towards scarce assets like Bitcoin as a hedge against currency debasement. The narrative of Bitcoin as "digital gold" gains traction during periods of economic uncertainty, attracting both retail and institutional capital seeking to preserve purchasing power.
Thirdly, technical indicators are flashing strong buy signals. Bitcoin's weekly chart, for instance, is flexing significant strength. A sustained break above key resistance levels, such as the $108,000 mark, often triggers further buying as traders and algorithms recognize the bullish momentum. The return of "HODL mode," as evidenced by the behavior of long-term holders, further reduces selling pressure, allowing prices to climb with less resistance. This combination of fundamental strength and technical breakouts creates a powerful upward spiral.
Finally, anticipation of future events also fuels price rallies. The upcoming June 11 CPI report, for example, is being closely watched by analysts. Inflation data can significantly impact market sentiment, and a favorable report (e.g., lower-than-expected inflation) could signal a more dovish stance from central banks, potentially leading to increased liquidity and risk-on appetite, which benefits Bitcoin. An analyst has even suggested that the Bitcoin price could "explode" after the CPI report, indicating the market's sensitivity to such macroeconomic releases.
Bitcoin Chart Pattern, Return of ‘HODL Mode’ Point to Imminent All-Time BTC Price High
The technical analysis of Bitcoin's price charts, combined with on-chain data indicating a return to "HODL mode," strongly suggests that an imminent all-time high (ATH) is on the horizon. Chart patterns are crucial tools for traders and investors to identify potential future price movements based on historical data. When Bitcoin breaks above significant resistance levels, especially after a period of consolidation, it often signals the start of a new upward trend. The recent break above $108,000 is a prime example of such a breakout, indicating that the market has absorbed previous selling pressure and is now ready for higher valuations.
The "HODL mode" phenomenon, as discussed earlier, is a powerful fundamental indicator that reinforces technical signals. When a large proportion of the circulating supply is being held by long-term investors who are unwilling to sell, it creates a supply shock. This reduced selling pressure means that even moderate buying interest can lead to significant price increases. This is particularly true when new capital enters the market, as it encounters a much thinner order book on the sell side. The confluence of a bullish chart pattern and the return of "HODL mode" creates a self-reinforcing cycle: technical breakouts encourage more HODLing, which in turn reduces supply and facilitates further breakouts.
Analysts are increasingly confident that these combined factors point to an imminent all-time high for BTC. The previous all-time high serves as a psychological and technical barrier, but once breached, it often transforms into a new support level, paving the way for further price discovery. The current market structure, characterized by strong accumulation by long-term holders and a clear upward trajectory on the charts, suggests that the path of least resistance for Bitcoin is upwards.
Bitcoin Weekly Chart Flexes Strength—Is The Moonshot Just Getting Started?
Looking at Bitcoin's weekly chart provides a broader perspective on its long-term trend and current momentum. The weekly chart smooths out daily volatility, revealing more significant patterns and trends. Currently, Bitcoin's weekly chart is indeed flexing considerable strength, characterized by consistent higher lows and higher highs, strong closing prices, and increasing trading volume during upward movements. This sustained bullish momentum on a longer timeframe suggests that the current rally is not a fleeting pump but potentially the beginning of a more substantial "moonshot."
The term "moonshot" in crypto parlance refers to a rapid and significant price increase, often to unprecedented levels. While such parabolic moves can be speculative, the current strength on Bitcoin's weekly chart appears to be fundamentally driven. The accumulation by long-term holders, the predictable supply schedule enforced by the difficulty adjustment, and the increasing institutional adoption all contribute to a more sustainable upward trajectory. This is not just about short-term trading gains; it's about a fundamental revaluation of Bitcoin's role in the global financial system.
The question of whether the "moonshot" is just getting started implies that the current price levels are merely a stepping stone to much higher valuations. This perspective is supported by the fact that Bitcoin is still in its relatively early stages of global adoption compared to traditional asset classes. As more individuals, corporations, and even nation-states begin to integrate Bitcoin into their financial strategies, the demand will continue to outstrip the limited supply, fueling further price appreciation. The weekly chart's strength provides a visual confirmation of this underlying bullish narrative, suggesting that the journey to new price frontiers is indeed well underway.
Bitcoin Price Could Explode After June 11 CPI Report, Says Analyst
The highly anticipated June 11 CPI (Consumer Price Index) report is poised to be a significant catalyst for Bitcoin's price action. The CPI is a key economic indicator that measures the average change over time in the prices paid by urban consumers for a market basket of consumer goods and services. It is a primary gauge of inflation, and its release often triggers significant market reactions across all asset classes, including cryptocurrencies.
An analyst's prediction that Bitcoin's price could "explode" after the CPI report highlights the market's sensitivity to inflation data. If the CPI report comes in lower than expected, it could signal that inflationary pressures are easing, potentially leading central banks to adopt a more dovish monetary policy (e.g., interest rate cuts). Lower interest rates reduce the opportunity cost of holding non-yielding assets like Bitcoin, making them more attractive to investors. Conversely, if inflation remains stubbornly high, it could reinforce Bitcoin's narrative as an inflation hedge, also potentially driving its price up as investors seek refuge from fiat currency debasement.
The market's reaction to such reports is often driven by expectations. If the report aligns with or exceeds dovish expectations, it could lead to a surge in liquidity and risk appetite, benefiting Bitcoin. Conversely, an unexpectedly hawkish report could lead to short-term volatility. However, the overarching sentiment among many analysts is that even in a hawkish scenario, Bitcoin's role as a hedge will continue to attract capital. The June 11 CPI report is therefore a critical event that could provide the immediate impetus for Bitcoin's next major price movement, potentially validating the "moonshot" thesis.
Bitcoin Price Will See ‘Short-Term Correction’ Before $140K: Analysts
While the overall sentiment for Bitcoin is overwhelmingly bullish, some analysts predict a "short-term correction" before the price initiates a rally to all-time highs above $140,000. This perspective is not necessarily bearish; rather, it reflects a healthy market dynamic. Corrections are a natural part of any asset's price discovery process, allowing the market to consolidate gains, shake out overleveraged positions, and attract new buyers at slightly lower price points.
A short-term correction typically involves a temporary pullback in price after a significant upward move. This can be triggered by profit-taking from early investors, macroeconomic news, or technical resistance levels. Analysts who foresee such a correction often view it as a necessary reset that builds a stronger foundation for the next leg of the rally. For instance, a drop could see Bitcoin retest key support levels that were previously resistance, confirming their strength before moving higher.
The prediction of a correction before reaching $140,000 suggests that while the long-term outlook is incredibly strong, the path to new all-time highs may not be a straight line. Such a correction could present an excellent buying opportunity for those who missed the initial surge or wish to increase their holdings. It also aligns with the idea of a healthy market that allows for organic growth rather than unsustainable parabolic pumps. The $140,000 target itself is a significant psychological and technical level, and reaching it would mark a substantial milestone for Bitcoin, further solidifying its position as a premier digital asset.
The Return of Altcoin Season: Why Bitcoin Dominance Must Fall To 62%
As Bitcoin continues its ascent, the conversation often shifts to the broader cryptocurrency market, specifically the potential for an "Altcoin Season." Altcoin Season refers to a period when altcoins (cryptocurrencies other than Bitcoin) experience significant price appreciation, often outperforming Bitcoin. For an Altcoin Season to truly kick off, analysts often point to a crucial prerequisite: a decrease in Bitcoin's dominance.
Bitcoin dominance (BTCD) measures Bitcoin's market capitalization as a percentage of the total cryptocurrency market capitalization. Currently, Bitcoin's dominance is relatively high, reflecting its recent strength and the capital flowing into it. However, for altcoins to flourish, capital needs to flow from Bitcoin into other cryptocurrencies. This typically happens when Bitcoin has made significant gains, and investors begin to seek higher returns in riskier, smaller-cap altcoins.
The specific threshold of Bitcoin dominance falling to 62% is often cited as a key indicator for the start of Altcoin Season. When Bitcoin's dominance drops to this level or lower, it suggests that a substantial amount of capital is rotating out of Bitcoin and into altcoins, signaling a broader market rally. This rotation is a healthy sign of market maturation, as it indicates that investors are diversifying their portfolios and recognizing the value proposition of other blockchain projects.
The return of Altcoin Season would signify a broader bullish trend across the entire cryptocurrency ecosystem. It would mean that the value proposition of decentralized finance (DeFi), non-fungible tokens (NFTs), and various Layer 1 and Layer 2 solutions built on other blockchains is gaining traction. While Bitcoin remains the undisputed king, a thriving altcoin market indicates a robust and diversified digital economy. The anticipation of this shift further underscores the dynamic and evolving nature of the cryptocurrency market, where Bitcoin's strength often paves the way for the growth of the entire ecosystem.
In conclusion, Bitcoin stands on the precipice of a new era of growth, driven by a powerful synergy of fundamental strength, technical indicators, and evolving market dynamics. The unwavering conviction of long-term holders, evidenced by a climbing Realized Cap and a pervasive "HODL mode," forms a robust foundation. The predictable monetary policy enforced by the difficulty adjustment mechanism instills unwavering confidence in its scarcity. Recent price surges, fueled by institutional interest and macroeconomic tailwinds, underscore its immediate bullish momentum. While a short-term correction may be on the cards, it is viewed as a healthy precursor to an explosive rally towards and beyond the $140,000 mark. Furthermore, Bitcoin's continued strength is expected to eventually pave the way for an "Altcoin Season," signaling the maturation and diversification of the broader crypto market. For investors and
enthusiasts alike, ignoring Bitcoin's current trajectory would be to miss a pivotal moment in the ongoing digital revolution, as it solidifies its grip on the financial future.

Bitcoi 4 hour - Volatile Zone near bu = CAUTION
PA nearly at that Circle I posted
MACD near the Neutral line
Possible rejection from Both
Lets see how this plays out. I do ecpect PA to follow that arrow BUT Bulls could step in and take PA Above the upper trendline and then wait for the inflation data in the USA on the 11th
Watch BTC Dominance for Clues about how this all effects ALT coins

Bitcoin Approaches the $110,000 Zone Once AgainBitcoin has seen a strong bullish surge in recent trading sessions, climbing more than 7% and now trading back above $108,000 per BTC. The buying bias has been consistently fueled by the announcement from Metaplanet, which plans to raise over $5 billion to acquire Bitcoin — a move that has temporarily restored short-term confidence in the market. As euphoria continues to build in the short term, buying pressure may become increasingly relevant in the upcoming trading sessions.
New Uptrend Line Forming
Following recent upward movements, a new bullish rebound has formed on the chart, initiating a consistent uptrend as price action nears historical highs once again. If buying pressure remains stable, this emerging trendline could gain greater relevance in the short term.
MACD
The MACD histogram continues to oscillate below the neutral 0 line, which suggests that the primary market momentum still lies in bearish territory. If the histogram keeps showing lower values, the previously dormant selling pressure could begin to regain strength.
Bollinger Bands Width
The line measuring the width of the Bollinger Bands remains at low levels, indicating a steady decline in long-term average volatility. If this behavior persists, it could signal the beginning of a consolidation phase in Bitcoin’s price during the next few sessions.
Key Levels to Watch:
$111,000 per BTC: Previous all-time high zone. A breakout above this level could strongly reactivate the bullish bias and open the door to a more aggressive uptrend in the short term.
$106,000 per BTC: Nearby support that may serve as a buffer against potential selling corrections in the sessions ahead.
$100,000 per BTC: A key psychological support level, aligned with recent local lows. Price action falling below this level could put the current bullish formation at risk.
Written by Julian Pineda, CFA – Market Analyst

BITCOIN ROAD TO 300K !!! ELLIOTT WAVE CASE STUDYThere are three possible cases for Bitcoin which we can now consider according to Elliot wave count on big picture:
Case I: According to this count if we hold above 74.5k , recent low, we may see major shift in BTC. Retracement Up to 92-79k is good which will form inverse head & shoulders, potentially breaking ATH up to 170K, if things goes well & 74.5K region remains on hold.
Case II: If in case 74.5K region breaks, then it will invalidate minor count causing BTC to retrace more up to 64-52K major reversal zone region. If such thing happens, bullish shark pattern will be formed causing major reversal from that region BUT 49K region should remained hold!!!
Case III: Worst case scenario if 49K region breaks, then it will cause major count invalidation dropping BTC further up to 45-33K region.

Is Bitcoin hearing for a ATHs, again?After reaching new highs around $112k, BTC has since retraced to support around $100k.
Currently reclaiming support around $105k, continued strength could see price reach ATHs in the coming days or weeks.
Losing support around $105k could signal a retest of $100k.
Referring to a previous post, my theory that we may not see sub $100k for the rest of the year is still in play, perhaps a signal of market strength despite the fear of the bull market ending.
Evidently, BTC is still holding up to all bullish expectations... Until proven otherwise.

Bitcoin: Weekly Bullish Continuation🟠 The weekly divergence between the March 2024 and January 2025 peaks has driven the recent 3-month decline.
🔴 BTC is expected to make a weekly move higher, creating another divergence in the way.
🔵 BTC held above the 2024 peak range 73K without overlap, while the Stock RSI has completed a full reset, reinforcing the bullish momentum.
🟢 Outlook: Over the next 6 months, Bitcoin CRYPTO:BTCUSD is expected to rally into new ATH, with a potential target around 127K by October 2025.

Bitcoin above the supportBitcoin back tested the important yellow resistance on weekly and closed a hammer candle above the pivot.
I wont be surprise to see $130k in couple of weeks.

Time to go to the moon againRecent price action as retraced into the weekly level which is now the key level that Bitcoin can bounce off. once the week closes above, the next objective is price will rally and hunt the all time high. Grab your popcorn and lets watch the next move

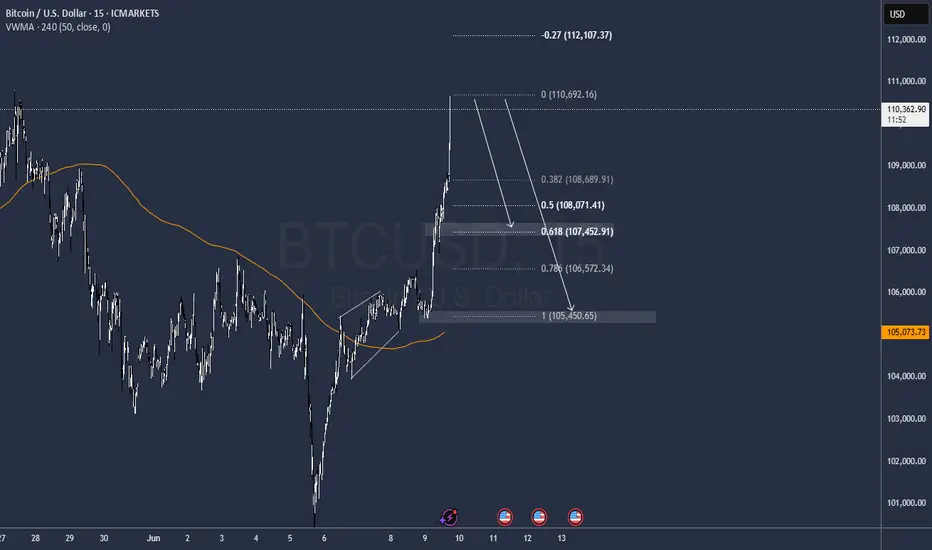
BTC Short Setup! OB + Fair Value Gap + Trend Channel ConfluenceBitcoin (BTCUSD) | 30-Min Chart – High Probability Sell Setup
Bitcoin continues to respect bearish structure inside a descending trend channel, creating prime opportunities for Smart Money traders to strike at optimal levels.
🔍 Trade Breakdown:
Bearish Market Structure
Price is forming lower highs and lower lows
Channel structure is being respected with multiple taps on both the upper and lower bounds
Liquidity Sweeps & Internal Range
Multiple yellow-highlighted zones show liquidity engineering — both buy-side and sell-side have been swept
Recent sweep + demand failure confirms bearish intent
Premium Entry Zone Setup:
🔴 Order Block Zone (OB): 105,200 – 105,400
🟣 Fair Value Gap (FVG): Overlapping with OB – perfect imbalance correction
📐 Fib Levels:
61.8% = 104,987
70.5% = 105,298
79% = 105,388
🔺 This is the kill zone — premium retracement + inefficiency fill = high confluence
Bearish Continuation Expectation:
BTC likely to react at OB zone and continue bearish leg
Projection into discount fib levels:
-27% = 104,000
-62% = 103,800
-100% = 103,727
Channel Respect = Structure Confidence:
Every key swing is aligning with channel resistance/support
Blue arrow shows expected path: liquidity sweep ➝ OB/FVG tap ➝ drop to channel low
🧠 Chart Ninja Entry Plan:
🔹 Entry Zone 105,280 – 105,388 (OB + FVG + 70.5–79% Fib)
🔻 SL Above 105,400 (above OB)
📉 Target 103,727 (channel + -100% Fib extension)
⚖️ RRR Over 1:4 — sniper-grade RR setup
💬 Ninja Wisdom:
You're not chasing moves — you're waiting where liquidity pools.
Fair Value Gaps + OB + Trend Channels = institutional signature.
Trade like Smart Money. Let retail chase candles. 🥷💸
📍 Save this setup before the market plays out
🔁 Share your thoughts below – entry, TP, SL?
👣 Follow @ChartNinjas88 for more sniper BTC setups daily

Bitcoin Short to 97 K into cpi numbersIn this video I cover the recent drop and what might be a great short on the horizon . With the V shape recovery off the defended 100K level I anticipate that we continue the move up to 107/108K before hitting some resistance and pushing us back into the range leading into the midweek . With cpi news release this could be the catalyst needed to trap the late buyers and drop us into 96K zone .
This video provides context and theory for this short setup so I encourage you to watch .
Tools used Vwap , volume profile , Fibonacci pulls .
Thanks for watching
Any questions please leave in the comments
Safe trading

BITCOIN REVERSAL INCOMING !!!! BUT WHEN????Currently we have seen a great move from 75k to new ATH 112k BUT now whole bullish momentum seems to be fading.
If we see charts, we clearly see ranges and recently Bitcoin has swept range high & reclaimed back into range, which indicates lose momentum. We may see BTC tapping 90K even 80'sK for next bullish move.
For all to maintain it's bullish momentum, Bitcoin have to stay above 74.5k and needs to break and hold above 109.5K.
Breaking below 74.5k would push BTC as low as 60-55k
STAY CAUTIOUS !!!!

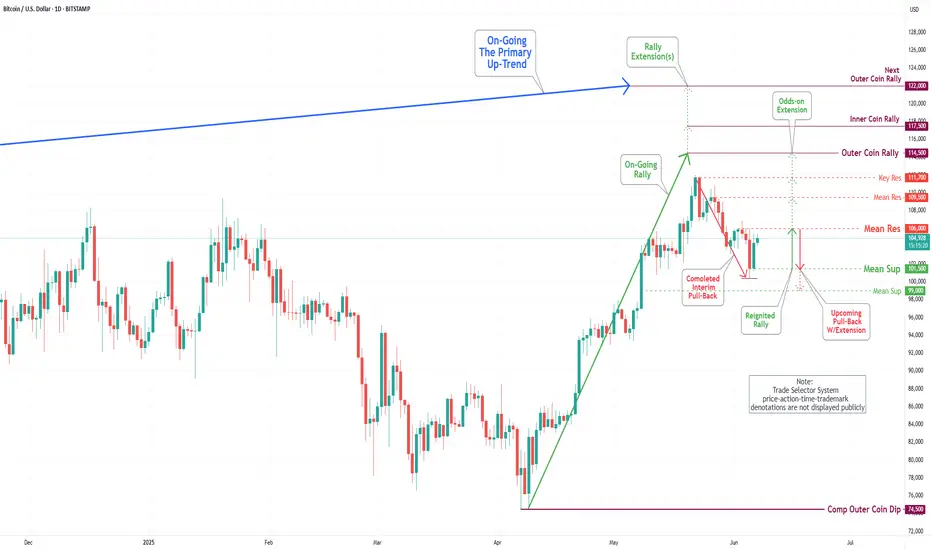
Bitcoin(BTC/USD) Daily Chart Analysis For Week of June 6, 2025Technical Analysis and Outlook:
Bitcoin has experienced a notable downturn throughout the week; however, on Friday, it made a substantial upward movement, effectively recovering all previous losses. It is currently positioned to establish a temporary pause at the Mean Resistance level of $106,000, which may facilitate the development of upward momentum from this point. This situation may pose challenges to achieving the Inner Coin Rally target of $ 114,500, which is contingent upon the Mean Resistance at $ 109,500 and Key Resistance at $ 111,700. It is essential to acknowledge the possibility of a downward pullback from the Mean Resistance level of $106,000, which could result in a decline toward the Mean Support level of $101500.
The Unraveling of an Empire: How Bitcoin Could Break the DollarFor decades, the U.S. dollar has reigned supreme, an undisputed king in the global financial arena. It is the world's primary reserve currency, the bedrock of international trade, and the safe-haven asset investors flock to in times of turmoil. This dominance has afforded the United States what has been called an "exorbitant privilege," allowing it to borrow cheaply and exert significant influence over the world economy. But the ground beneath this financial empire is beginning to shift. A confluence of mounting debt, shifting geopolitical sands, and the rise of a revolutionary technology is creating the conditions for a challenger to emerge. That challenger is Bitcoin.
Born from the ashes of the 2008 financial crisis, Bitcoin represents a radical departure from the centrally controlled monetary systems that have governed economies for centuries. It is a decentralized, digital currency, free from the whims of governments and central banks. While initially dismissed as a niche interest for tech enthusiasts and a tool for illicit activities, Bitcoin has steadily gained traction, evolving into a trillion-dollar asset class that is now capturing the attention of institutional investors, corporations, and even nation-states. The question is no longer whether Bitcoin is a fleeting fad, but whether it possesses the power to fundamentally disrupt, and perhaps even break, the long-standing hegemony of the U.S. dollar.
A Hedge Against a Failing System
One of the most compelling arguments for Bitcoin's ascendancy lies in its inherent properties as a store of value, particularly in an era of unprecedented monetary expansion and soaring national debt. Unlike the U.S. dollar, which can be printed at will by the Federal Reserve, Bitcoin has a finite supply capped at 21 million coins. This predictable scarcity is a powerful antidote to the inflationary pressures that erode the purchasing power of fiat currencies. As governments around the world, and particularly the United States, continue to accumulate staggering levels of debt, the temptation to devalue their currencies through inflation grows. The U.S. national debt, now standing at tens of trillions of dollars, raises serious questions about the long-term sustainability of the dollar's value. In this environment, Bitcoin's unalterable monetary policy makes it an increasingly attractive safe haven for those seeking to preserve their wealth.
The trend of "de-dollarization" is already underway, with several countries actively seeking to reduce their reliance on the U.S. dollar in international trade and reserves. Geopolitical rivals like China and Russia have been at the forefront of this movement, but even traditional allies are beginning to explore alternatives. The weaponization of the dollar through sanctions has further accelerated this trend, prompting nations to seek financial systems that are not subject to the political whims of a single country. Bitcoin, being a politically neutral and borderless currency, offers a compelling solution. It allows for direct, peer-to-peer transactions across the globe without the need for intermediaries, thereby circumventing the traditional, dollar-dominated financial system.
The Rise of a New Reserve Asset
The ultimate test of a global currency is its acceptance as a reserve asset by central banks. While this may have seemed like a far-fetched idea just a few years ago, it is now a topic of serious discussion in financial circles. A handful of nations have already taken the pioneering step of adding Bitcoin to their reserves, signaling a potential paradigm shift in how countries manage their sovereign wealth. For central banks, the appeal of Bitcoin lies in its potential for diversification. By holding an asset that is not correlated with traditional stocks and bonds, they can better hedge against various economic and geopolitical risks. As more central banks begin to explore this option, even a small allocation to Bitcoin could have a significant impact on its price and legitimacy.
The development of a robust financial ecosystem around Bitcoin is also paving the way for its broader adoption. The emergence of regulated exchanges, custody solutions, and investment products has made it easier for institutions to gain exposure to the asset class. This growing infrastructure is crucial for building the trust and liquidity necessary for Bitcoin to function on a global scale.
The Hurdles on the Path to Dominance
Despite its disruptive potential, Bitcoin faces a number of significant challenges that could hinder its ability to supplant the dollar. The most frequently cited concern is its price volatility. Wild swings in value make it a difficult medium of exchange for everyday transactions and a risky asset for conservative central banks to hold in large quantities. While volatility may decrease as the market matures, it remains a major obstacle to widespread adoption.
Scalability is another critical issue. The Bitcoin network can currently only process a limited number of transactions per second, making it unsuitable for the high volume of payments required of a global currency. While second-layer solutions are being developed to address this, they have yet to be proven at a massive scale.
Furthermore, the regulatory landscape for cryptocurrencies is still in its infancy. Governments around the world are grappling with how to approach this new technology, and the lack of clear and consistent regulations creates uncertainty for investors and businesses. The U.S. government, in particular, is unlikely to cede its monetary authority without a fight, and could impose stringent regulations that stifle Bitcoin's growth.
Finally, no currency in history has achieved global dominance without the backing of a major economic and military power. The U.S. dollar's reign is underpinned by the strength of the American economy and its military might. Bitcoin, by its very nature, is decentralized and lacks the support of any single nation-state. This could be both a strength and a weakness. While it provides neutrality, it also means that there is no central authority to backstop the currency in times of crisis.
A New Financial Order
The notion that Bitcoin could completely break the U.S. dollar and become the sole global reserve currency in the near future remains a speculative one. The dollar's incumbency advantages are formidable, and the challenges facing Bitcoin are substantial. However, to dismiss the potential for a seismic shift in the global financial order would be to ignore the powerful forces at play.
What is more likely than a complete replacement is a gradual transition to a more multipolar currency world, where Bitcoin coexists alongside the dollar, the euro, and other major currencies. In this scenario, Bitcoin could serve as a neutral reserve asset, a check on the inflationary tendencies of fiat currencies, and a parallel financial system for those who are excluded from or wish to opt out of the traditional one.
The rise of Bitcoin is a clear signal that the world is yearning for a more resilient, equitable, and decentralized financial system. Whether it ultimately breaks the dollar or simply forces it to become more disciplined, one thing is certain: the future of money will look very different from its past. The quiet revolution that began with a single whitepaper is now a global movement, and the foundations of the old financial empire are beginning to tremble.

RSI suggesting a bear market comingThis is BTC and it's RSI. Bellow you can see LMACD applied on the RSI indicator to see the trend more clearly. We might be on the stage that we can see higher prices like in 2021, but the bear trend is already printed. Sell some now and buy back at 40k next year. Cheers

Crypto bull market might be ending pretty soonI am warning you that we might seeing the last days of the bull market. SO FAR histogram is printing the first red candle(we need to verify once June ends). Look what happened with btc once LMACD crossed above 0. Winter is coming.

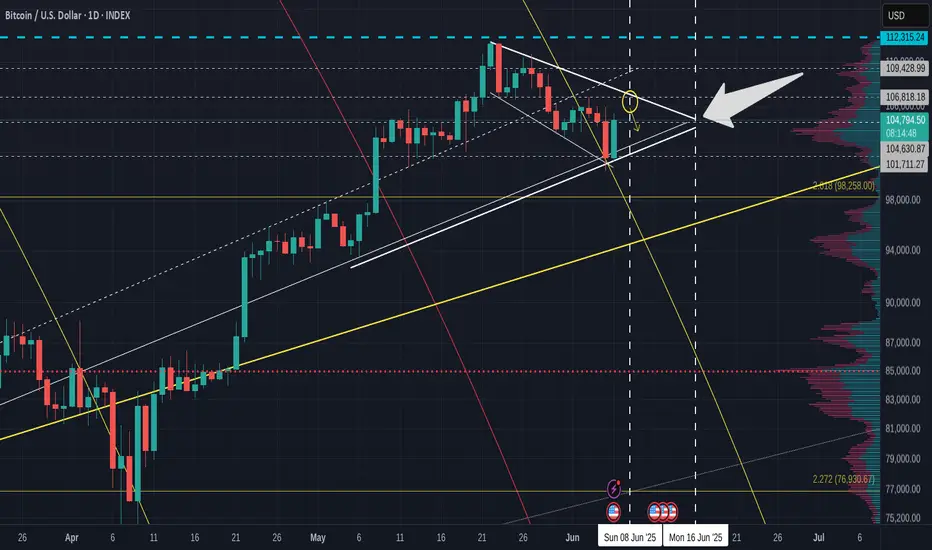
Bitcoin DAILY & 4 hour charts show possible push in 10 days ?
First of all SORRY for all the lines.
This is a working chart but they are all relevant to this post.
Main chart is DAILY and shows ua the Pennant that we appear to be printing with the descending channel inside. The diagonal line falling is the Fib Circle we recently broke through.
See how, once above the fib circle, we slid down the outside, using it as support, as we often do.
Then we hit another line of support and that created this recent push higher.
Should we continue, we will most likely go to the upper trendline, towards that circle. Circle center is around Sunday 6th.
While we are still on the daily, see that Pennant Apex...that is a Week on Sunday, the 15th.
99% of the time, PA reacts BEFORE the apex.
Should things continue, we can expect to see a rise till end of weekend, Rejection back to lower trend line and then a Rise and maybe a push Out of the pennant to new highs.....OR, and I think this is very probable, we go back to around the ATH line ( blue Dash) and Dip back down again.
It is worth remembering that we have inflation data being released in the USA next week.
People will likely wait to hear ths before making to many big moves.
The Daily MACD offers some guidence on this also
MACD nearly back on Neutral and could bounce. The Dashed line is this sunday.
MACD could continue to drop below neutral, we shall have to watch this closely.
As I mentioned, in the short term, BTC likely to reach for this circle in the 4 hour chart below.
I will admit, I expected PA to reach this point in a differnent way as posted earlier in the week, But, Hey, we still getting there..
Should we get rejected there, as I expect we will, then a revisit to 103K before a push back.
But given the inflation figures, things could get very volatile next week so CAUTION
We can see on the 4 hour MACD how we have already been rejected of Neutral once and we are heading there again
The potential to push through the neutral line exists but.......
I do expect some volatility and so we need to be aware things could change rapidly.
The inflation data is a key. Depending on if it is drooping, rising or flat, this WILL effect the situation with regard to the FED Rate decision later this month.
So, we wait, with caution and expectations
False Breakdown? BTC Eyes Rebound From Demand Zone!Bitcoin has broken below its strong rising trendline, but this move could well turn out to be a classic seller’s trap. Despite the breakdown, BTC is currently holding above the key breakout zone, which has historically triggered strong rebounds.
The price is also sitting right inside a previous "accumulated & explode" demand zone — an area where buyers have consistently stepped in. If BTC manages to hold this zone, a sharp rebound could follow, trapping late sellers and driving price higher.
However, if the support zone fails, we could see deeper downside. For now, this is a critical pivot — watch price action closely to see if bulls defend this level or if sellers gain control.
If you liked it, do comment and follow us for regular market updates.
THANK YOU

Quick BITCOIN update using old Fractal chart - a small red June
Bitcoin appears to be taking a rest when it is strictly not required.
We are heading towards the 2nd dashed arrow, which as I pointed out months ago is a very possible and more realistic path for Bitcoin to take this cycle.
We have left the 2013 - 2017 Fractal and yet are likely to follow the idea of moving higher to a new ATH from this level off the Fractal.
PA entered that circle I drew back in Feb and is still in it right now, as we can see in the chart below
We can also see how PA has bounced off the 50 SMA on this daily chart.
This does NOT guarantee a continued move higher but it may offer some levels of support.
Should this fail, we do have various levels of support down to around 94K
I will refer back to a previous post and mention that to some extents, I am expecting a RED June. This does not need to be a Big candle, just 1 usd less than the open price wil create that.
104648 was the open price, so, we can easily stay above 100K and create that red candle.
Why do we want a red candle..?
Because, to put it simply, statistically, we have a better chance of continued monthly Green candles after a red june this time
I will attach the chart below so you can read about this in more detail.
This may or may not be good for ALTS>.... but I do not have many now.....just my preference

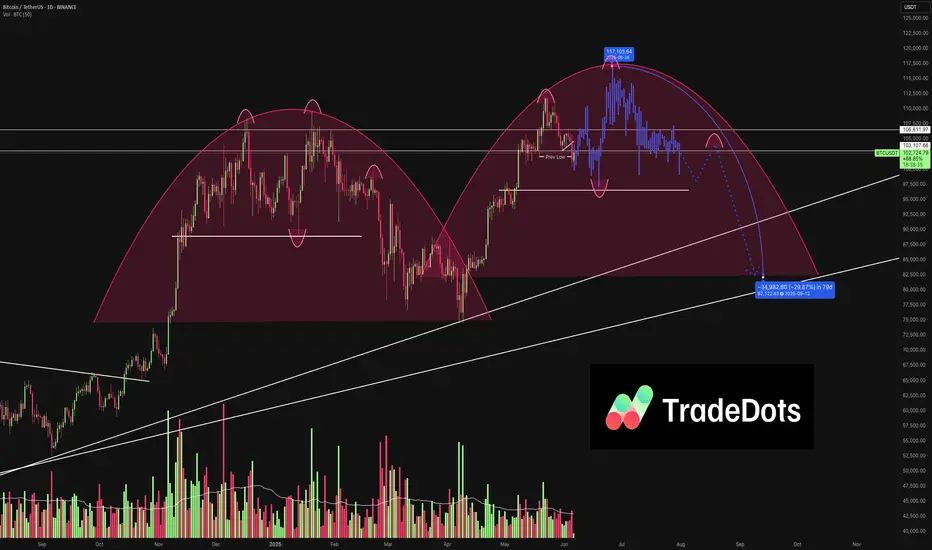
Is Bitcoin Repeating Its 2021 Price Action? | TRADEDOTSWe’ve observed that Bitcoin CME:BTC1! appears to be repeating a previous wave pattern. If it follows its historical price action yet again, here’s what we might expect:
2021 Comparison
Back in 2021, Bitcoin formed two large rounded wave structures where the second wave exceeded the first, forming two consecutive all-time highs followed by a huge drawdown. This year’s price action looks very similar to the beginning of the second 2021 waves. If it continues to unfold in the same way, we anticipate a new all-time high before the end of this year, followed by a notable pullback into early next year.
Key Support at $96,000
As long as BTC holds above $96,000, the bullish trend remains intact. This level has shown great demand and volume support, reinforcing its role as the floor for the short-term uptrend.
Upside Potential to $117,000
If buyers continue to support the market above $96,000, BTC could reach the $117,000 region, setting another all-time high. This expectation follows the earlier wave pattern seen earlier this year and completes a close parallel to the 2021 bull run.
Deeper Pullback Expected
After a potential new high, a larger correction is likely. Drawing on previous pullback price action, a 30% dip toward $82,000 could align with a higher-time-frame trendline and significant support area—mirroring the wave structure from 2021.
Final Thoughts
BTC remains structurally bullish above $96,000
A pullback to the $82,000 region could present a key buying opportunity if it occurs.
NASDAQ at Weekly Supply Zone – Bearish Breakdown Ahead? (READ)By examining the #Nasdaq chart on the weekly timeframe, we can see that the price is currently trading within the supply zone around 21,400. If it manages to close and stabilize below 21,100, we can expect further downside for this index. The potential bearish targets are 21,000, 20,700, 20,200, and 19,150. The key supply zone ranges from 21,400 to 22,200.
Please support me with your likes and comments to motivate me to share more analysis with you and share your opinion about the possible trend of this chart with me !
Best Regards , Arman Shaban

BTC/USD: The Big Player’s Pullback Strategy – Steal Profits!🚨 BITCOIN HEIST ALERT! 🚨 The Ultimate Bullish Raid on BTC/USD (Master Plan Inside)
🌟 Hola! Bonjour! Hallo! Marhaba! Money Makers & Market Robbers! 🤑💸🔥
Based on the 🔥Thief Trading Style🔥 (technical + fundamental analysis), we’re plotting the GREAT BTC/USD HEIST! Time to LONG & escape near the Red Zone—where bears lurk & traps snap shut! Overbought? Risky? Perfect for a slick exit. 🎯 Take profits & treat yourself—you’ve earned it! 💰🏆
🔑 Heist Blueprint:
🎯 Entry: "The raid begins!"
Buy MA Pullback near Big Players’ Zone (102,000)
OR Buy above pullback—bullish momentum = green light! 📈
🛑 Stop Loss:
Thief’s SL = Nearest swing low (or under wick) → 4H candle rules!
Adjust based on risk, lot size & multiple orders.
🏴☠️ Target: 115,000 (Cha-ching! 💵)
⚡ Scalpers’ Quick Strike:
LONG ONLY!
Rich? Strike hard. Not? Join swing robbers!
Trailing SL = Your money’s bodyguard. 🔒
💥 Why BTC/USD?
Bullish fuel pumping! Fundamentals + Macro + COT + On-Chain Data = 📈🚀
👉 Full analysis? Check our bio links! 🔗
⚠️ WARNING: News = Market Chaos!
Avoid new trades during news.
Trailing SL = Profit protector!
💖 Support the Heist!
💥 BOOST THIS IDEA! 💥 Help us steal more profits & grow stronger!
🚀 Daily market heists = Easy money. Stay tuned—next raid coming soon! 🤑🐱👤
