Bitcoin 2024 lowest and halving date price prediction 2022-2024Bitcoin 2024 lowest and halving date price prediction 2022-2024 created by bitcoin logarithmic chart analysis with recent falling wedge . Please zoom in for more clarity.
Bitcoinpriceprediction

Only Some Will Survive !!!History repeating itself as bitcoin is clearly resembling the patterns from the 2008 dot com bubble. I personally believe that the total crypto market cap will come down to the 500-600 billion range and many Alts will get absolutely reckt!!!
Not a financial advise, not a financial advisor either :))

Future of Bitcoin, how low will bitcoin go in bear marketBear markets always ended at weekly ma 200 , there is also a gap (bitcoin futures) at 24.5k and 18.8k.

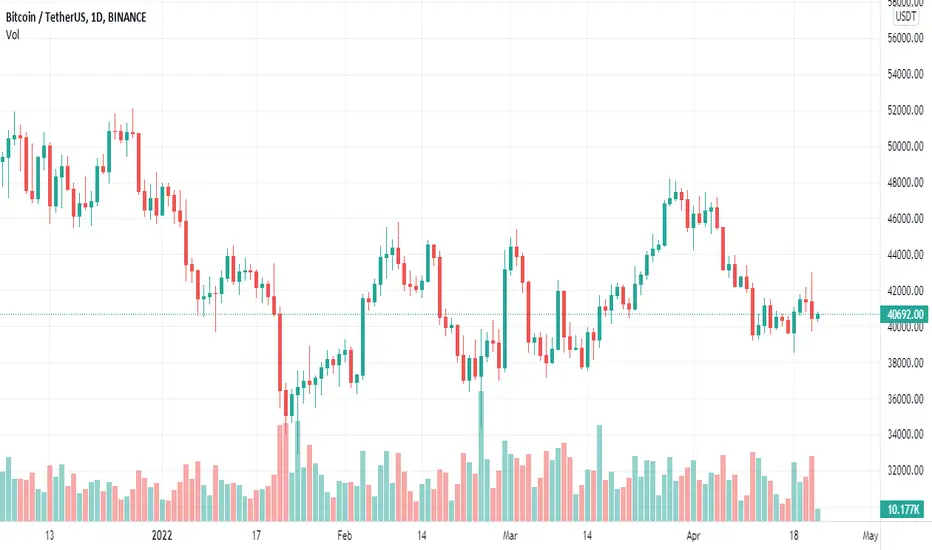
🔥 BTC / USD — Bitcoin Trading Mid-May 2022🔥Hey there, its Artem and here is update for upcoming week for Bitcoin.
After Bitcoin breaking below $37,000 it making impulsive moves down. Now taking $34,000 zone and might take a short recovery week during mid-May.
Expectations near $37,000ish and possible continuation down to $29,000 and $24,000 support regions in next 6 months.
Currently waiting in cash and taking small risk trades counter-trend (long) to $37.000 to see whats happening next.
Stay safe
Pray for Ukraine
Best regards
Artem Shevelev

Bitcoin about to break out bullishBitcoin has been test and retesting the rising support line build ever since Jul 2019.
Yesterday we tested this support line yet again.
Keep in mind both on the weekly and the daily we are in a triangle that screams for a change of trend.
I would argue we will see the long expected trend reversal upwards.
There is currently no new news in the market and institutional investors have been stocking up on Bitcoin (BTC).
There is been a huge order book on the buy side for weeks now keeping Bitcoin from dropping further.
The time seems to have come for the switch.
I would consider a daily close above the triangle bullish.
If we can reach $42.5k it gets super bullish and if we close above the weekly triangle we are can have a seat and ride on the bull.
--------------------------------------------------------------------------------------------------------
** Please support this idea with your likes and comments, it is the best way to keep it relevant and support me. **
--------------------------------------------------------------------------------------------------------
!! Donations via TradingView coins also help me a great deal at posting more free trading content and signals here !!

Bitcoin Bull flagBitcoin has formed a bull flag scenario on a 2H timeframe breaking to the upside might take it to 42,000 however we do have some massive resistance below at 40,800 also after breaking this 40.8 we can see this level.

bitcoin price predictionjust based off percentages from last year from may on. just adding another perspective. short term bear, mid-long term bull.

#Bitcoin's Sharp Reversal is Squashing Bulls, Path Back to $39.5Past Performance of Bitcoin
After sharp upside moves in the European and early New York sessions on April 21, Bitcoin prices plunged to close the day as an inverted hammer. The long upper wick points to strong selling pressure, unwinding gains posted in the days as prices reacted from the previous support--and now resistance--multi-week trend line. Based on the development in the daily chart, #BTC seems to have completed a retest.
Bitcoin Technical Analysis
Traders remain apprehensive at spot rates. Even after the complete reversal of April 11 losses and the close above the $42.5k level, sellers didn't sustain prices above $42k, indicating weakness. The uptrend has been nullified following the April 21 inverted hammer and prices trending below $42.5k. Prices are pulling back from the liquidation trend line, completing a retest. Sellers might ride with the newfound trend, targeting $39.5k in what could be a bear trend confirmation of the April 11 leg down.
What to Expect from #BTC?
The reversal from April 21 highs pours cold water on bulls' momentum. Since prices are now back within the April 11 trade range and $42.5k, the selling pressure of April 21 may spill over, possibly forcing BTC towards $40k in the short term.
Resistance level to watch out for: $42.5k
Support level to watch out for: $39.5k
Disclaimer: Opinions expressed are not investment advice. Do your research.
Bitcoin is about to have a huge move to the upsideIn this trend analysis, I show that Bitcoin has formed two bullish patterns which are about to break out to the upside.
The first one is a double bottom and the second one is a Bull flag. The interesting thing is that both patterns have the same price target of around $56500

Bitcoin - short term predictionHello traders,
Here is what I see currently on the charts for Bitcoin:
- We are right below another horizontal resistance here, forming a triangle pattern, which most likely will be broken to the upside;
- The weekend is also almost here, which always means manipulation and low volumes - this could lead us to a retest of the lower band of the triangle at around 40 000$, but I don't see it as much likely option;
- The most probable scenario is breakout to the upside today and a red sideways action on the weekend, acting as a retest of the horizontal resistance. There is also a small resistance box between 0.382 Fibonacci level and the triangle;
Bitcoin is currently above some very major resistances - 50MA and 100MA on the daily + 21EMA on the weekly, which is a sign of a market recovery. I would like to see a retest of the 21EMA before going up.
Take care of yourself and trade safe!

Total Crypto Market Cap in depth analysis before $1 TRILLIONLast year Crypto reached $3.00 Trillion milestone. Today 20 March total valuation is close to $1.83 Trillions and it bouncing around $1.67 - $1.93 during last months since beginning of the year.
If you like my graphics, please use Like button 💙💛
Check out the pics below to see why I consider market crash for this year:
1. 2018 - 2019 structure just repeating itself today:
Price just lining with rising support (dashed line) before the breakout and creating lower highs and higher lows.
2. SP500 correlation quite similar today, price had break down to support zones in 2018 - 2019 years, price stuck in sideways (dashed-flag) before another breakout:
In 2022 it is a different picture and price sharply going down, creating some kind of wedge look, and now back up to Resistance zone of $4560 where it can reverse again if there is another fears on the market come up during April-May period.
In case of reversal from resistance, I think SP500 can finish correction near support at $3900-ish zone, which mean another -19% crash for US stock market, at this point investors can drag down risky assets easily and Crypto will be highly volatile during this event, so shakedown to $1.00 Trillion or lower is quite possible event in our future.
Thanks for your attention
Stay safe and pray for Ukraine 🇺🇦

BTC SMASHES MULTI-RESISTANCE STRUCTUREExciting stuff happening with Bitcoin today! The Bulls have just woken up after a nice nap and absolutely RAMMED their horns RIGHT UP THE BEARS ARSE!! And the bulls have the bears on their heels!
I would like to take a moment to express my condolences and prayers to those who have fled, those who are still in and those who have lost loved ones in Ukraine. I stand with Ukraine and uproar the resistance that Ukraine is making against the completely inexcusable actions of a premeditated, unprovoked, and unjustified invasion by a sadistic leader and has materialized through a series of flat out lies to his country's citizens; just to try and relive in the fallacy of the past. Stand Tall, Fly Straight, Ukraine is here to stay.
I addressed that at first because the biggest reason besides bitcoins chart patterns having this pattern already setup to make this pattern happen, but there needed to be a fundamental reason not just a technical reason for this pattern to happen. The sanctions that have been taken against Russia and Belarus by almost all of the countries of NATO that were set in place to essentially demolish the Russian Economy and freeze any assets it had and the ability to trade through SWIFT caused the stock markets to make a dive that was beyond massive (for a stock market anyhow.. in Crypto, well we have these sized pullbacks, +20% and still maintain a bull market) <---- Just as we have in the crypto markets. The run on the banks and ATM cash machines that has happened in Russia and the Ukraine and the fact that both countries have legalized cryptocurrencies in the last 2 weeks has helped fuel the massive $7,000 green candle we have seen on the bitcoin chart today..
Lets dive deeper though into the technicals.
ANALYSIS:
This green, Luke Sywalker Boner, of a candle HAS BROKEN A MULTI-RESISTANCE STRUCTURE!! . Take a look here:
As you can see that multi-resistance structure consisted of 4 different resistance points that were causing issues for bitcoin after breaking our completely manipulated 52% drop in price that stayed within a very thin falling channel (which ultimately is bullish). In a direct aspect look of things, you can see that this pump above this multi-resistance structure has formed a W-Bottom and W-Breakout.
If we zoom out some we can see an even more relevant patter that is has been formed which is the KEY TO WHY THE BITCOIN BULL RUN NEVER ACTUALLY ENDED!!! All of the MoonBoy Mikes and Average Joes calling the bitcoin price drop as the start of the bear market.
Here you see from our first bottom at wick low @ $28,640 that connects with the bottom that got the blast through resistance points to break us out of the first bottom @ $29,750. This potential trend line then was tested a third time and held it with candle body supports @ $35,220. This makes this line a confirmed trend line now. This also makes it an ascending trend line at that. The bottom at $35,220 also makes a MACRO HIGHER LOW!!!! READ THAT AGAIN... A MACRO HIGHER LOW... well now think about our tops so far.. we had a top at $64,850 and then we dropped, made bottom, and then we ran the price back up to $69,900 and then dropped and now have made a W-Bottom.
Well lets see what other pattern resembles price action that has made 2 Higher Highs, and also has made a confirmed trend of Higher lows..... Oh yes that is an ASCENDING CHANNEL!! THIS IS AN EXTREMELY BULLISH CONFIRMATION THAT BITCOIN HAS MADE!!
Now this channel is not a very steep channel in regards to its ascending angle, but that is all due to the price manipulation and also market makers hiding its structure as well for those not well versed in charts to see it. It is hidden by the fact that it DOES HAVE HIGHER HIGHS BEING MADE, but the SECOND HIGH DOES NOT CONTRIBUTE TO THE THE TREND LINE THAT MAKES THE TREND CHANNEL
As you can see here..
One last piece of BULLISH confirmation has come to play out with todays pump that confirmed a W-Bottom & W-Breakout that has made our local bottom. This local bottom has also been supported by 2 of the longest and oldest ascending trend lines of support that were that bottom of the overall bitcoin ascending trend channel that has been made since inception.
What does this local W-Bottom & W--Breakout confirm?? IT CONFIRMS AN ADAM & W-FORMATION MACRO DOUBLE BOTTOM! The MACRO W-BREAKOUT THAT HAS BEEN FORMED SINCE OUR $64.8k TOP WILL BE CONFIRMED FOR EACH FIB EXT LEVEL THAT IS ABOVE US AS RESISTANCE RIGHT NOW THAT IS BROKEN AND HELD AS SUPPORT.
The resistance that held down our $7,000 Pump Today was held by the Daily 100EMA and the .55 Fib Extension level.
If you looked closely and noticed the difference on the charts, of where the daily 200EMA is in relation to the .55 FIb Ext level, there is a reason for that. They are two difference charts. The chart above and the chart below is that the chart above is for the Bitstamp Exchange (exchange specific chart that holds the most data) and then the one i am mostly posting form is the ALL Time History Bitcoin Index chart (goes back even further than Bitstamps chart with candles). But the reason why there is a difference in the price placement of the FIB Extension levels is due to lowest point made in the bear market of 2015.
The low point of the Bitstamp chart came at $151 on 1/15/2015 shown below:
And on the ALL Time History Bitcoin Index chart the bottom came in at $159 on 8/18/2015 shown below:
The placement of each the second and third plot point of the Fib Extension are exactly the same. 2nd plot @ $19,815 and 3rd plot @ $3,215
The significance and the more relevant one comes with which chart has the most data to evaluate from. Since the ALL Time history Bitcoin index chart has the most data. the placement of the FIB levels and the Exponential Moving Averages are the more accurate.
PRICE PREDICTION
Seeing that the daily 200EMA is above the .55 FIb Ext level on the Index chart means that the strongest EMA of resistance is still above the .55 FIb ext, which means we will break that FIb level in order to test the Daily 200EMA, of which we will see a possible rejection but then the .55 FIb Ext level will hold as support because of the daily 13EMA, 21EMA, 55EMA, and the 100EMA all bringing up the rear and providing support at that fib level. Then off thebounce of the .55 FIb we will break the daily 200EMA, of which the next stop.. the .618 Fib Ext.
Usually this would be a challenge but given that we broke the .618 Fib Ext on our second top, and the ONLY REASON we came back below it was due to a complete manipulation of the price, that would make our next price target either the .706 Fib ext level at $94k or quite possibly the .786 Fib Ext Level at $138k. We could possibly see either of these price levels at the .618 fib level by the beginning of April 2022, at the .706 fib level by late May 2022 and the .786 fib level by August of 2022..
OF which we would then see another pullback for bitcoin to cool off before its macro 5 wave (for you elliot wave theory idiots out there).. The parabolic blow off top run to the Full 1 Fib Ext level would look to start in Late October to Early November 2022, and then would run us up to the price level of around $386k by February 2023.
THIS IS **IF** BITCOINS PRICE ACTION DECIDES TO GO ON AN ALL OUT TEAR THAT SMASHES THROUGH RESISTANCE LEVELS AS IT DID IN 2020 and 2021 going from the low of $3800 up to $69.9k
After doing some simulations, based of previous price action moves and extrapolations of candlestick patterns made from the first leg of the bull flag super cycle made so far, we could possibly see something that looks like this:
*** This simulated and extrapolated price action projection should not be taken as the only way the price action will go, future fundamental events & catalysts can and would deviate the price action from this extrapolated and simulated projection. Please understand that you should always be keeping an eye on the markets as they are very dynamic and always is an on-going and ever-changing situation. Please act in the nature that is best associated for your risk tolerance as an investor. Do not Trade what you cannot afford to lose to begin with. This projection is not financial advice and is only my opinion of the markets based on trend analysis and technical analysis patterns that I understand to mean specific things. Most people think I am crazy and call me crazy when I make price predictions such as these (but once it happens they usually are pretty quiet about me being crazy). For example, I saw weakness in the US stock market trend in early 2018 when we had the first pullback, then when Shocktober 2018 occured and we had a correction into bear market territory which created a double top for the year of 2018, I predicted a market crash to happen at the end of Q1 2020 based on the same trend analysis and technical analysis knowledge I use on the Bitcoin Chart. In October 2019 I had narrowed my prediction down to the crash happening on and was within 7 days of my exact date I chose for the crash to occur. I Predicted that the crash was going to start on Friday, February 28th 2020, but because this market crash turned into the COVID-19 CRASH, it started just 7 days earlier on February 21, 2020. Having that kind of skill in the charts to call a crash 25 months prior to it actually happening and then being within 1 weeks time of it actually happening. And the reason it happened before the prediction date was cause of a global pandemic that was going crazy... IS NOT JUST LUCK...
Here is the long standing chart Ive had since 2018 on the DJI. If you were to zoom in on the 2020 crash top, if COVID was not to have crashed the price, it was going to go back up and try for a local double top there too, yet didn't have the opportunity to do so.

BTC PRICE PREDICTION MARCH BTC/USDT Binance Exchange. If BTC couldn't hold the support level($38,300) Then we can except BTC to a price of($36,000).If BTC could hold the support($38,300) it will test the resistance at ($39,500) if it fails we can expect it to($36,000m).If conditions are good we can see BTC to pump above 41k possible to reach above 45k

LAST CHANCE FOR BITCOIN!Bitcoin is at a large level of support. Price is having a short term recovery with poor volume which indicates that this support level is weak. If this support was valid BTC would have bounced to 45k.
The MFI on the 2h chart is looking strong but could turn bearish very quickly.
BTC is trading below the 200SMA which is a bearish signal.
BTC is also trading below all of the EMA Ribbons. These EMA Ribbons were previously used as a strong level of support. BTC has held above the EMA Ribbons for a good period of time. BTC is looking to hold below these EMA Ribbons with a good amount of selling volume.
On the 2h chart we are also seeing a one-body candlestick formation which is bearish due to the fact that the latest candle did not have the ability to close or wick above the previous candle. This candlestick formation is bearish once spotted on a strong level of support.
BTC also doesn't have a large volume spike which would make this support valid. I would wait before going long on BTC. This support needs to be confirmed by a large amount of volume and a leg up in the price of BTC.
TD Sequential is also looking bearish because we have a green 4 that is about to close below a green number 3. This indicates that we have an invalid uptrend. BTC made an attempt to break the downtrend but is looking to fail.
BTC could bounce from here, or break the support and drop to around 29-35k.
*WARNING* This thread and analysis is not financial advise. I am not a financial advisor.
Thank you for reading.

Bitcoin - A possible path to a new ATHAfter a sharp downward move caused by the Fed’s announcement yesterday, we are left wondering if we have found a local bottom.
Too many unknown economic factors are at play to be able to make a good prediction, however I think cryptocurrencies may trend lower for a few more weeks. Consider DCA into top performers.
Strong support around 32K for BTC.
If BTC makes a similar recovery as it did following the last correction (May 2021) , we could see a return close to ATH by mid-end of May 2022. If this plays out, it may form a nice cup-and-handle pattern, but with strong support at the 69K level due to previous ATH, providing an opportunity to form a new ATH around 93K by September.
Let’s see how this plays out. I would feel very good about buying Bitcoin at 32K.

Shhht...it will all be over soon!Nothing last forever, not even bear markets.
I am coming back to my weekly chart for this because smaller timeframes are noisy and can mislead.
Technically we are going to hit the same area we have hit before going up with big volume back in July. Pretty confident that the 40-41k level will be the final tested level.

BITCOIN ready to go... 40% of Major trend reversal result in big swings.
60% in minor losses or profits.
It is all about context and momentum that
make markets move.
Want to get a picture of how the bars CAN develop to the right? Look to the bars on your left. This is called CONTEXT
Markets tend to have INERTIA --> That means that the price will do 80% of the time what is has been doing (on your left)
We are in a Trading range so the possibility of the price making a swing to the upside is more likely than price moving lower.
If we take a look at MOMENTUM. We can see a strong bulltrend from Support.. 3 white soldiers and 1 small pullback and price moves up to the upside.
What we see and what you want to is... In a trend like this consecutive bull bars. BIG consecutive bull bars.
For me the latest bars a trading ranges in a bull flag.
60 - 40 chance of price moving higher.
Maybe a little more, looking at the context..

My Perspective On BitcoinI Personally do think Long-Term is the move. As we see here is seems we are repeating the may move but in a shorter term.
Another way of seeing it, we could be testing the 100 Day Moving Average since we recently tested the 50 Day Moving Average from our last "Dip" back in September.
If we can bounce where we are now then I do see us flying somewhere around 72k around mid January or early February.
Remember this is just my perspective on the current situation in the market and highly advise you not to copy as this could take a turn for the worse at anytime when we least expect it to.
Stay safe, Use Stop Losses for your next couple of trades while we are down right now and Happy Trading/Happy New Years!
Twitter: @qoecs

Bitcoin will reach $49000Bitcoin will reach $49000
following my analysis 85% chance that it will hit $49000

Bitcoin Winter Rollercoaster ❄ Should we get Pumped up?!Hey! Last days on bitcoin chopping longs and shors.
It is pretty regular to have such behaviour before big movements. Price get the similar movements below down-trend lines (blue) I have highlighted it with black arrow-zigzag.
I think there is an opportunity for nice move after price trigger (51200 or 45300). I have explained my thoughts on the chart.
Anythihg can happen, so keep you eyes on the price action and trigger levels (use alarm feature on @Tradingview)
PS: personally I would like to see trending up, what about you?;)
Have a nice holidays!
Best regards
Artem Shevelev

Just doodling ideas with bitcoin price predictions to $100k-500kLooks like if you follow log chart channel up Btc has a probability to go to $529k
or if it follows the log chart then it goes to $148k
supports would be last peak of $19k and $13k
Of course there's also a bearish side but bullish looks too good to be true. Haha! Hope you enjoy :)
The bad:
Monthly MACD about to cross down so watch out
Oversold cross down last month November
Volume going down
The good:
idk
keep Hodl and dca strong! Thanks for looking

BTC headed downwards based on volatility.Based on the squeeze momentum indicator, it looks like we are headed downwards until around March 2022.

BTC Mini bear market ahead?!There is a chance that we enter a mini bear market for the next 3 months just like May-July 2021 and print an ugly/boring pattern. Hope not, but there is a possibility.
