Rising Wedge of Doom ?? BTC/USDT #Bitcoin #BTC $BTCHere we see our Bitcoin weekly chart from Binance . You see those black lines ? They are outlining what appears to be a Rising Wedge pattern . This pattern starts out a bit wider at it's base but then the trading range definitely narrows as it moves upwards . These Rising Wedge patterns generally break bearish at some point . The question is when ? How high do we go before we break bearish ? We already hit just about perfectly up to the 3.618 fib extension near 64500 . You see that red question mark ? That would be one of the next fib extension targets and it's 75000 area. My guess is we would retake the 65k area first - then move on to 68k - 70k - 72k - all of which are possible target areas . 75k might be our target after that but there's no way of knowing because Bitcoin can break bearish much sooner than that . It could also surprise us and blow right past those targets. But right now we appear to definitely be inside a large Rising Wedge pattern from at least the beginning of 2021 . Chances are it will break bearish at some point and go down .
Bitcoinpriceprediction

Bullish Triangle ? BTC/USDT #Bitcoin #BTC $BTCHere we see our Bitcoin 2 day chart from Binance . There does appear to be an ascending triangle forming here , inside those pink lines . This is generally a bullish indication in an uptrend . I would expect Bitcoin to break upwards from this structure - probably by the end of April .Though Bitcoin sometimes surprises us and does the opposite ! But we have seen consolidation happening on Bitcoin's chart near these 50k and 60k levels for weeks now . It should continue up ,in my opinion . I've said before I expect this to hit 72k at some point as that was a 3.618 fib from a previous chart which I will try and link below . That said we could also hit 65k and 68k first but I still expect 72k to happen at some point . End of year could obviously be much higher.


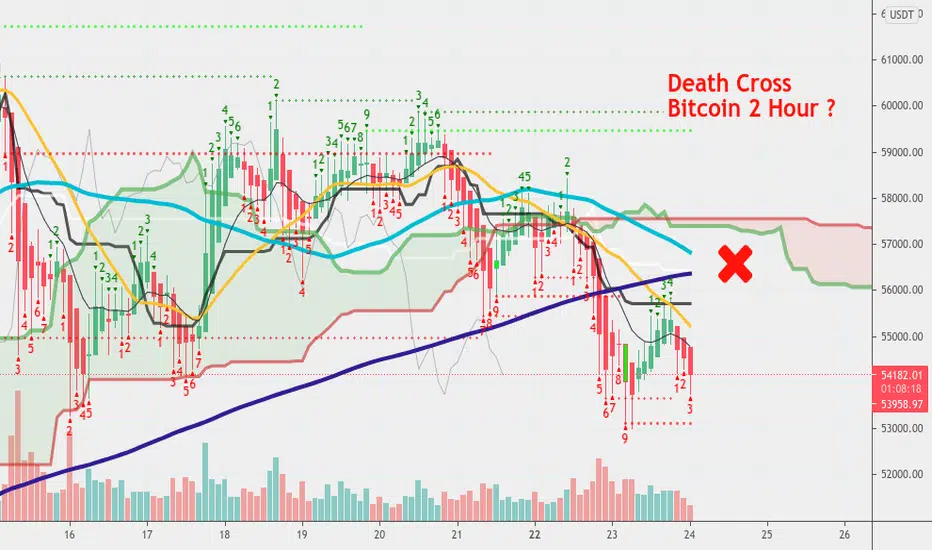
Hoist The Jolly Roger BTC/USDT #Bitcoin $BTC #BTC Here we see our Bitcoin 2 hour chart . Can you see that red X on the chart ? Well, X marks the spot where we may see a Death Cross happening
very soon . A Death Cross is when our light blue 50 MA crosses down and through our dark blue 200 MA . This should bring downward price movement. It's a very bearish event - though keep in mind this is the 2 hour chart . While it's hard to know how low this can go it wouldn't be impossible for Bitcoin to actually go sub 50k here . Please understand we are still long-term bullish for the rest of the year even if we see more pullback on Bitcoin. This will also be great for altcoins which could see a little altseason starting soon.
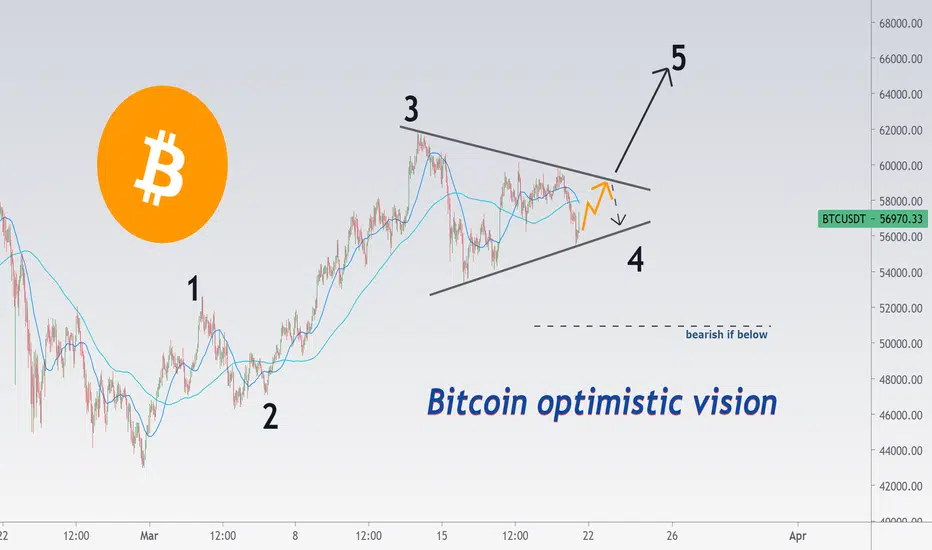
Bitcoin optimistic vision 21 March 2021 — BTC UPHello! Since last week bitcoin price fluctuations are choppy as hell. Slidin up and down like crazy, shaking weak hands out of market.
Personally I use level of 51K as first sign of bearish overtake. Untill this level is holding i continue to hold btc position.
If btc will continue to grow, it will mean alts vs. btc will take another dip (buy opportunity) and give good profits after few weeks.
Thanks for you attention, stay tuned to new updates
Best regards
Artem Shevelev
BTCUSD - $100,000 by mid summer
Followup to my previous confirmed analysis to make nice support on $45k in February, here's a nice and simple Fib trend showing us $100k per Bitcoin by mid-summer this year.

BTC: Future of BTC could be very bright[Fib levels all theory]I came across this idea of using chaos theory and converting them into Fib levels.
Looking at this idea, i decided to plot out "wild levels" where we use the 4.669, 8.77 as the "wild levels". I took this even further and added the 11.09 and 17.94 fib level to the chart.
What i found the most interesting is that the 17.94 fib level, represented the following bull run cycle top(slightly front ran by a few hundred dollars). What you can see is that drawing out these fib levels from cycle lows to cycle top, on the first bull run, we saw the 17.94 fib level came out to be $20,826.61 while the 2017 cycle topped out exactly at $19,666.
Using this idea that in the next bull cycle, we will hit the previous 17.94 fib level means we will reach roughly $350,226 in this existing cycle.
The next bull run if we hit near the middle $300,000 range, means we should see a cycle top of around $5,926,308.
THis means by roughly mid august, bitcoin is likely to reach it's cycle top, and we will be in free fall until around November 2022. From this point we will likely be trading in an upward trend before breaking the 2021 cycle top and moving towards the $5.9million price tag.
The outlook of bitcoin looks incredibly good.

BITCOIN FIBONACCI TIME PIVOTS ! DONT MISS IT!The downside coming then the big pamp or pump coming after. Here are two exceptional trades for everyone to use. Long live fibonacci time! Chart explained inside more.

Possible BTC falling to $45k? The same pattern is formingBTC/USD may form the same candles on 1D timeframe as the last time when fell from $42.000 to $30.000? I think it is a possible scenario. A possible sideway movement is likely on higher timeframe meaning the price could get back to $45.000 and up again. This should fit the forcasts predicting a new all time high above 80 or even 100k this year. What do you think? It is a viable scenario or the price will bump the near future?

INVERSE BTC CLEAR XABCD! DOWNSIDE POTENTIAL!Bitcoin has some downside big time if we can confirm this harmonic, as of now, not confirmed and i am still looking for 57000 target and if we break 57k we go to 62-63 and there is where we can DROP 15k back down, so play this smart! Dont trade against the ''IN YOUR FACE'' trend we have and you will be rewarded. If you havent been able to make a lot of profitable trades this year, you may need to understand that shorting btc right now is stupid unless you have 3-5 confluential levels from fibonacci levels to your D/W/M Support/Resistance Levels and having Volume or Market profile data in confluence with your levels even, HELL, I MIGHT EVEN NEED SOME ELLIOT WAVE SUPPORTING THE SHORT ENTRY COMBINED WITH EVERYTHING I ALREADY STATED! SO ITS DUMB SHORTING, UNLESS YOU HAVE THE DATA TO BACK IT UP. DONT TRADE COUNTER TREND IN A BULL MARKET. YOU ARE NOT THAT SMART. BELIEVE ME! GOODLUCK TRADERS and go make soime BITCOINS!!!

Bitcoin #ThrowbackMondayYesterday spot this beautiful fractal on Bitcoin price, decided to share with you. 👍👍

Bitcoin Medium Term Outlook (March and April 2021) - UpdateThe price has been beautifully sewing up and down the uptrend line. The coming moves have been forecasted using extrapolation data from the previous oscillations around the trend line. Based on the analysis I am expecting the price to retrace to 128 daily ma in mid to late April and hopefully get support and bounce of the moving average.

Where does BTC go from here?This chart has been drawn out by looking at the 2014 and 2017 tops and looking at the % difference between the 2017 LOWS comparing to the 2014 top.
Taking this difference, we can say from 2017 top we have a potential LOW for where we should be sitting at for a bear season low.
From there we can say the rally between 2014 and 2017 was 1400% which puts us roughly at $306,000. Calculating the down side in the 2017 bear season, it fell roughly 87%, if we are saying $306,000 is the top, then 85% retracement would put us roughly in the $42k BTC range.

The 3.5 Million Dollar Question BTC/USD #Bitcoin $BTC #CryptoHere we see our Bitcoin weekly long-term chart from Bitstamp . You can see where we are now , seemingly starting the Bullrun year of 2021 .Can you see that blue question mark on my chart ? That would be 4 years from now during the next Bullrun year of 2025 . And if we continued to follow this long-term channel up it would take us near 3.5 million dollars Bitcoin in December 2025 ! That's not guaranteed but this channel has been in play since the last two Bull cycles ( the 4 year cycles . ) And we're still in this channel . We haven't left it yet . That means it's a strong channel. It's crazy to think this is possible . But people thought it was crazy Bitcoin could see 100k this year , but we're very close to that. It looks like it will happen soon. End of year could see us over 250k Btc . It's sobering to think how this could change lives .But thanks for reading and have a great day .

Bitcoin (BTC/XBT) Daily Long&Short Trade Setups 2021/02/26Hi guys! I will be sharing the trades that I take in real time, follow to see how my trades work out!
If you like this post, please support me by clicking the like and follow buttons. Also feel free to share your thoughts and analysis in the comments below!
And don’t forget to check out my daily analysis on Bitcoin, Ethereum, and Altcoins!
Market Overview
Price Action: Bitcoin broke above the 200MAs, but unfortunately when it retested 200MAs as support, it failed to hold up, and price broke below the 200MAs once again, leading to a much larger selloff as price failed to rally to the upside. That opened the door for a test of the lows @ $45K, and perhaps even opening up the potential for a correction all the way down to $40K.
Patterns: N/A
Areas of Interest: The area(s) of interest for me are the lows @ $45K and the 200MAs @ $49.5K. Once price reaches one of these areas, I will monitor for entry confirmations. If the entry confirmations are aligned, I will take a trade and share the my trade in real time.
Trade Setups
Below are the potential trade setups that I would be interested in trading:
Long Trade Setup #1: False Breakdown
1. Price Action: Price breaks below the then rapidly climbs above $45K, forming a bear trap
2. Trade Entry Confirmations: A breakdown candlestick followed by a reclaiming candlestick, above average volume on both breakdown candle and reclaiming candle, MACD bottoming
Short Trade Setup #1: Retest and Continuation (200MAs)
1. Price Action: Price needs to move back up to the 200MAs, currently projected to be @ $49.5K by the time price reaches it, and bounce back down.
2. Trade Entry Confirmations: Bearish candlestick pattern, above average volume, MACD topping out
My Recent Trades
2021/ 02/012:I had a losing trade. I entered into a long @ $47,810, SL @ $46,647, and trade hit stop loss.
2021/ 02/04: I had a winning trade! I entered long @ $$36,819.0, SL @ $$36,528.0, price reached a high of $37,783.8, giving a risk reward ratio of 3.3:1.
2021/ 01 /31: I had a winning trade! I entered long @ $33654 SL @ $33292, price reached a high of $34220, giving a risk reward ratio of 1.6:1.
About Me
I started trading in 2008, first got introduced to bitcoin in 2009, and have been actively trading cryptocurrencies since 2016.
I have worked on Wall Street trading bonds, stocks, and options.
I have taken hundreds of live trades, each recorded with over 50 data points, all meticulously analyzed, using data analysis and modeling to optimize win probability and risk reward.
Why Follow Me
Daily analysis on the latest market movements and price zones for high probability trade setups.
Sharing of live trades that I take.
A great place to help each other, learn from each other, and grow together.
Trading education including a comprehensive cryptocurrency trading eBook, personal advice, and other educational materials
Constantly testing and adding new trading strategies and refining battle-tested ones.
DISCLAIMER: I am NOT a financial advisor and this post is NOT financial/investment/trading advice. I will not be responsible for any actions you take based on the analysis and comments that I provide. I am simply sharing what I am doing, and is not meant to be investment or trading advice. What you choose to do with the information that I provide is your own sole responsibility! The cryptocurrency market is extremely volatile, and you WILL lose all your money if you are inexperienced! DO NOT risk any money that you cannot afford to lose and always be cautious and manage your risk!
Please support me by liking and following, and sharing your ideas and analysis in the comments! Thanks!

Christmas Presents BTC/USD #Bitcoin $BTC #btcHello , here we see our Bitcoin weekly chart from Bitstamp with the long view ! All the way from 2012 to present market . And you can clearly see the channel we have been in with the black lines on top and bottom . During Bitcoin's last 2 Bullrun cycles it touched up to the top of that line at some point and there is no reason why it shouldn't do the same this time . Why ? Because this is a channel that has held for many years now - it's a long standing and strong indication of possible targets for Bitcoin price later this year - possibly in December 2021 . What are the possible targets ? Well if we touch up to that black line in early December where that pink X is we should actually be over $250000 per Bitcoin. A 250k or more Btc ! Not guaranteed obvioulsy , but it definitely would be a lovely Christmas present ! Have a great day everyone .

BTC Daily Long (still)We all know the rebound was coming, now it's time to reassess and move on. Still bullish on the Daily chart. I'm going to do some analysis on the 4hr and smaller to find myself another rebuy position.
Ichimoku Kinko Hyo Kihon Suchi Study possibility 1 & 2
Price closes no lower than the bottom edge of the box which is even with Kijun Sen
Potential ranging within the box prior to upward movement
Possibility 3 & 4
Price drop is supported successfully by Kumo without closing inside. No trades within the Kumo.
Potential ranging within the cloud if the candles close inside.
Capped the top at $60k as it's a milestone - reversal upward range? who knows, 70k?
Let's see what happens!
As always comments and ideas are greatly appreciated!
-Doc
This information is not trading advice, only my personal opinion on potential market movements, and is for educational purposes only.

Bitcoin Medium Term Outlook (Mid Feb to Mid April 2021)The price has been beautifully sewing up and down the uptrend line. The coming moves have been forecasted using extrapolation data from the previous three oscillations around the trend line. Based on the analysis I am expecting the price to retrace to 128 daily ma in early and hopefully get support and bounce of the moving average.

72k incoming levels ? BTC/USD #Bitcoin $BTC #btcHere we see our Bitcoin weekly chart from Bitstamp . I called 52k a couple weeks ago based on our fib extensions . 52k was near the 2.618 fib and sure enough it hit . I'll link that idea below. Can you see that white star on my chart ? That's sitting right next to our 3.618 fib extension . And this one now sits at 72220 area , that's our 3.618 fib . Above that is the 4.236 fib near 84500k . These would seem to be eventual targets above us but it's impossible to know how long this will take to get there. Keep in mind our Bitcoin Dominance chart could see downside first as alts may take a run . But let's see !

Bitcoin Plinko!These fib speed resistance arcs are probably not precise or correct, but I can't stop looking at it.
Tradingview skews it when I publish so see below.
I am mostly posting this so I can see how it works out over the next 2-3 months. I am fascinated with the geometry of markets.
How will we get to wear we are going?
Owhooooo!

Next Stop Bitcoin 52k ? BTC/USD #Bitcoin $BTCHere we see our weekly Bitcoin chart which earlier hit close to 45k which was a previous level I predicted in a recent chart of mine I'll link below . But if you see that black arrow on my chart it is pointing at the 2.618 fib near 52264 which seems like it could be our next stop before further moves up . This isn't necessarily a straight line up ! But seems we will break above 50k soon enough . The swings are big now that we are in the Bullrun year . Also notice the 3.618 fib extension above that which sits at 72k ! That's a target too though it could definitely take a bit longer to reach these targets . Everything is looking good though . Don't assume this is happening today though , it could take some time . I'm just noting that an obvious target above us is the 2.618 fib . We should eventually we go there.

Bitcoin - Where are we going? To the moon of course!What a year for Bitcoin folks... There are some milestones before Bitcoin hit 100K But I truly believe Bitcoin will hit 100k still in 2021. Let's talk about the next step that is the 69k range. After a sharp correction into the 38.2% of Fibonacci, now we have this next milestone for our beloved Bitcoin. It won't be easy, but I don't see many issues to reach that.
I was very conservative in my approach. If we consider a wider range we can easily go through 150k USD. Although, let's walk one step at a time.

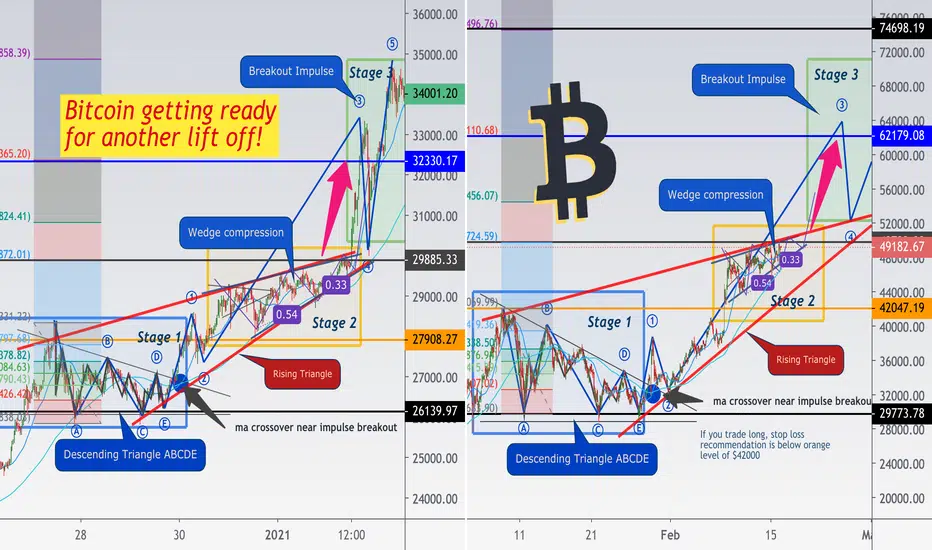
Bitcoin getting ready for another liftoff! $62K potentialHello! Here is my latest research on the price action. Found very close situation on the Bitcoin during late December 2020, you can see it on left screen. On the right screen we see current price action prior major breakout.
This comparison I marked in 3 stages, where
Stage 1 — Descending Triangle ABCDE
Stage 2 — Wedge Compression
Stage 3 — Breakout Impulse
In stage 1 we are watching for tricky correction in Descending Triangle with 5-zig-zag pattern (Elliott waves ABCDE)
Prior breakout from Stage 1 we can see Moving Averages Crossover and price start Impulse wave up.
In stage 2 we are watching for mostly bearish Wedge, price sloping up and selling pressure decreased so eventually price breakout to upside, crossing Level of resistance of Fibonacci 1.618 at $29885 on 02 January 2021.
Stage 3 is mainly impulsive wave 3 and 5 making sharp moves up and down and up again. In stage 3 you can see wave 4 retraced to level of resistance at 1.618 fib $29885 to retest the breakout.
This time seems like we are in the middle of Stage 2, almost finished Wedge compression. Looking forward breakout from resistance of 1.618 fib at $49724 and impulse leg up to $62100+ as stage3, and there I will expect major pullback to $49k.
Thanks for your attention, stay safe and use risk management.
Best regards
Artem Shevelev