BTC Whales Stir, Trump's Crypto Push, and the Path to $85,000
Bitcoin's recent price action has ignited a renewed sense of optimism within the crypto community. A confluence of factors, ranging from whale activity and political pronouncements to macroeconomic indicators and regulatory developments, is shaping the current market narrative.
Whale Activity: A Harbinger of Bullish Momentum?
The resurgence of Bitcoin whale activity is a significant indicator that has captured the attention of traders and analysts. Large-scale Bitcoin holders, often referred to as "whales," possess the capacity to significantly influence market dynamics.1 Their accumulation of Bitcoin can signal strong conviction and potentially trigger broader market rallies. The recent uptick in whale activity suggests a renewed interest in Bitcoin among these major players, potentially laying the foundation for a sustained upward trend. This can be viewed as the building of a strong base of long positions.
Political Winds: Trump's Crypto Pronouncements and Market Sentiment
Political discourse has increasingly intersected with the cryptocurrency market, with recent statements from a prominent political figure influencing market sentiment. Rhetoric emphasizing the United States as a "Bitcoin superpower" has undeniably contributed to bullish momentum. This political articulation of a crypto-friendly approach signals potential policy shifts and improved regulatory clarity, both crucial factors in attracting institutional investment. Market participants are interpreting this as a sign of acceptance, if not outright endorsement, of digital assets at the highest levels.
It is worth noting that consistent pronouncements regarding the US becoming the "crypto capital of the world," while driving short term volatility, need to be followed with legislative action for long term impact.
Macroeconomic Factors: Fed Policies and Inflationary Concerns
The Federal Reserve's monetary policy and the evolving narrative surrounding inflation play a pivotal role in shaping Bitcoin's trajectory. Recent indications from the Fed regarding continued rate cuts, despite persistent inflationary pressures, have boosted investor confidence. This stance, coupled with Powell's assessment of certain inflationary factors, such as tariffs, as "transitory," has provided much-needed relief to risk assets, including Bitcoin. This monetary policy creates a favorable environment for investment. The combination of Fed policy confirmation and rumors of "significant updates" to US crypto plans have driven Bitcoin to new two-week highs.
Technical Analysis: The $85,000 Threshold and Beyond
From a technical perspective, Bitcoin's ability to reclaim the $85,000 level is considered a crucial milestone. Surpassing this threshold would validate the current bullish momentum and potentially pave the way for further gains. Analysts are closely monitoring key support and resistance levels to gauge the strength of the ongoing rally. The return of significant volume combined with the price retaking old highs lends to an increasingly bullish sentiment.
BlackRock's prediction of a price shift ahead indicates a growing acceptance of Bitcoin as a mainstream asset, potentially aligning it with traditional Wall Street investments.2 These kinds of comments indicate an institutional bullish long-term perspective.
Regulatory Clarity: Ripple's Resolution and Its Impact on Bitcoin
The resolution of Ripple's legal battle with the SEC has sent ripples (pun intended) throughout the cryptocurrency market. This development has provided much-needed regulatory clarity, bolstering investor confidence and fostering a more favorable environment for digital assets. The jump in XRP's price after confirmation of the case coming to an end further exemplifies the markets sensitivity to regulatory action. This resolution will influence Bitcoin’s adoption rates, as investors now know the US regulatory stance may be moderating.
Options Market Sentiment: A Shift Towards Bullishness
The Bitcoin options market has exhibited a noticeable shift towards bullishness, particularly after Powell's "transitory inflation" remarks. This sentiment reflects increased optimism among traders and investors, potentially signaling a sustained uptrend. An increased amount of bullish options being written displays further faith in the rise of Bitcoin’s price.
Bitcoin's Volatility: Navigating the Uncertainty
Despite the positive developments, Bitcoin remains inherently volatile. Price swings, driven by a combination of market sentiment, news events, and technical factors, are to be expected. Investors should remain vigilant and exercise prudent risk management strategies. While large volume and long term political promises are strong positive indicators, there are still volatile short term swings to consider.
Looking Ahead: The Potential for a Sustained Rally
The convergence of positive catalysts, including whale activity, political support, macroeconomic factors, and regulatory clarity, paints a potentially bullish picture for Bitcoin. However, the cryptocurrency market is subject to rapid shifts, and unforeseen events can significantly impact price movements.
To conclude, the present environment is ripe for sustained Bitcoin price discovery. The political and macroeconomic climates are aligning, coupled with increased whale activity and regulatory clarity. While markets will remain volatile, the trend is looking increasingly bullish.
Bitcoinpriceprediction

Bitcoin Clears October 2024 FVG! What’s Next?BTC has successfully cleared the Fair Value Gap (FVG) from October 2024. The range has been tested, and we are now witnessing some sideways movement in lower time frames (LTF).
The $93.2K level remains the most critical resistance for now. Historically, Bitcoin has seen 29% to 32% corrections right before the final wave. It's also important to note that the 50EMA on the weekly chart has repeatedly acted as a strong support, preventing major breakdowns in the past.
I will be posting a detailed analysis on Bitcoin corrections this week. So far, we've already seen signs of this playing out. BTC must start reversing from here, or we could see one more push to the $70K range, forming a double or triple bottom before the final breakout.
This is not the time to be bearish, news cycles and geopolitical events can shift dramatically in the coming weeks or months. We've seen this pattern many times before, haven't we?
Stay prepared for what’s coming! I’ll also be sharing altcoin charts that could perform well in the upcoming months.
👉 If you found this analysis valuable, hit that Like button and make sure to follow me for more insights!
#PEACE

Bitcoin Market Cap Breakout Potential | Bullish SetupThis 1-hour chart for the Bitcoin market cap ( CRYPTOCAP:BTC ) suggests a potential bullish breakout.
🔹 Major Support: The price recently tested and respected a strong support zone, indicating buyers are stepping in.
🔹 Triangle Formation: A symmetrical triangle is forming, which typically leads to a breakout.
🔹 Weak High & ATH Target: If the breakout occurs, the market cap could push past previous highs, targeting the 1.88T level and beyond.
🔹 Bullish Scenario: A successful breakout above the triangle’s resistance may trigger an uptrend towards the weak high, followed by an attempt to reach new all-time highs (ATH).
💡 Key Levels to Watch:
Support: 1.65T
Breakout Confirmation: 1.66T+
Target: 1.88T
This setup suggests a bullish continuation, but a failed breakout could lead to a retest of support. Keep an eye on volume and momentum for confirmation.
What are your thoughts? Will BTC market cap break out soon? 🚀📈
#Bitcoin #BTC #Crypto #Trading #TechnicalAnalysis

Bitcoin Weekly SMA are finally into Sequential order -and now ?A nice simple post here.
As you can see, in Late January, the 5 main SMA ( Simple Moving Averages) finaly got into sequential order Under PA
This is a sign that PA is bullish.
As you can see, in September 202, this happened and PA began its rise after a sharp drop just before hand.
It is a bit different this time in that we have dropped AFTER that SMA order was made.
But it is still a Good sign
HOWEVER - what is important to note, is how PA has fallen below that 21 and we are currently hitting off the 50, searching for Support again.
I remain BULLISH and I am sure that within a few weeks, we shall move back over that 21.
From were the SMA went into order in 2020, it took about 6 months to reach the first ATH in 2021
PA is rising Much slower than in that cycle but If that repeats, we can see a New Real ATH around July / August
I would say that is too early to be honest and so I expect larter. As I said, PA is rising slower this time around.
But, anyway, Good News that the SMA have remained in order so far...
Something to look forward to

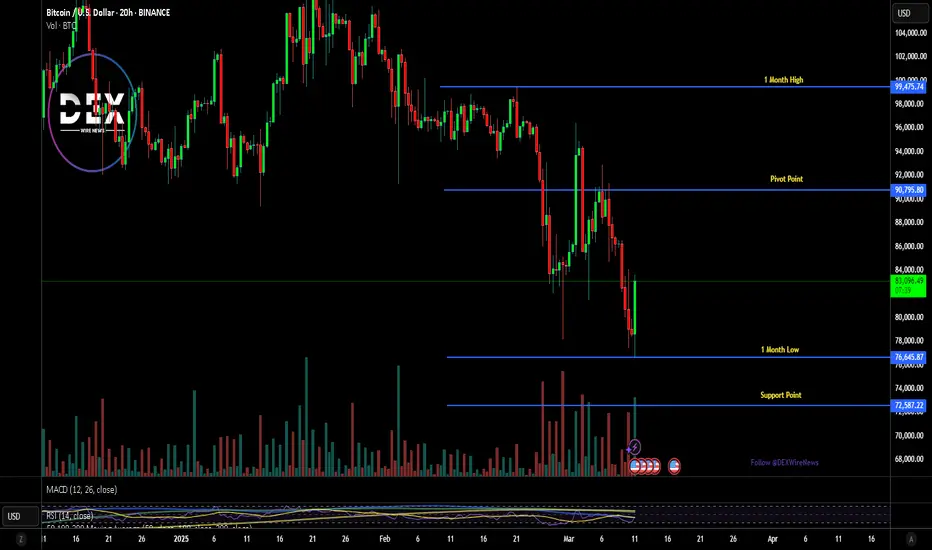
Breaking: Bitcoin Made a Comeback Surging 8%The world's first digital asset Bitcoin ( CRYPTOCAP:BTC ) shocked traders and investors alike as it surge 6% striking a comeback amidst the recent crypto bloodbath placing CRYPTOCAP:BTC in the FWB:83K zone with eyes set on the reclamation of the $100k Resistance.
Earlier on, we see Bitcoin retraced testing the $70k support point with many altcoins following suit. Should CRYPTOCAP:BTC break pass the $90k pivot point which is in lieu with the 38.2% Fibonacci point, a bullish campaign might evolved for CRYPTOCAP:BTC with odds set on the $120k zone.
Data from DefiLama shows industries and crypto projects are migrating to the Bitcoin blockchain network for scalability with about $5.414 Billion locked in Total Value Locked (TVL).
Bitcoin Price Live Data
The live Bitcoin price today is $83,341.47 USD with a 24-hour trading volume of $58,734,237,674 USD. Bitcoin is up 7.17% in the last 24 hours, with a live market cap of $1,653,114,998,100 USD. It has a circulating supply of 19,835,443 BTC coins and a max. supply of 21,000,000 BTC coins.
Bitcoin BTC - Bottom Or The Bear Market? [READ CAREFULLY!]Hello, Skyrexians!
Let's update our BINANCE:BTCUSDT idea. Last time we told you that this is the bottom when price was at $80k previous time. Yesterday we posted a mind at $78k that "Don't panic, this is the bottom". Today we have the update on this crypto to give you the thoughts what can really happen next.
Let's take a look at the daily timeframe. We have shown you already the 5 Elliott wave cycle with two red dots on our Bullish/Bearish Reversal Bar Indicator . After that correction has been started. Now it looks like that price has finished the ABC zigzag and ready for the reversal. VERY IMPORTANT: price shall form the bullish bar and green dot on indicator on the daily close. We are still in danger, but if it will happen, it's going to be the strong long signal inside the Fibonacci 0.5-0.61 zone. After that the next impulse is going to happen.
P.S. On 4h and lower time frames picture is beautiful!
Best regards,
Skyrexio Team
___________________________________________________________
Please, boost this article and subscribe our page if you like analysis!

Dollar Decline Fuels Bitcoin Bull Case, Macro Signal CautionThe intricate relationship between the U.S. dollar and Bitcoin continues to be a focal point of analysis within the cryptocurrency market. While a weakening dollar can indeed bolster Bitcoin's bull case, a confluence of other metrics necessitates a cautious outlook. The dynamic interplay between these factors creates a complex and volatile environment for Bitcoin.
The Dollar's Decline and Bitcoin's Ascent:
• A weakening U.S. dollar often strengthens the appeal of alternative assets, including Bitcoin. This is because Bitcoin, perceived by some as a hedge against inflation and the devaluation of fiat currencies, becomes relatively more attractive when the dollar's purchasing power diminishes.
• This inverse correlation stems from Bitcoin's nature as a decentralized, limited-supply asset, contrasting with the potentially inflationary nature of fiat currencies.1 When investors lose confidence in the dollar, they may turn to Bitcoin as a store of value.
"High-Stakes Game of Chicken" with Central Banks:
• The phrase "Bitcoin playing a high-stakes game of chicken" with central banks aptly captures the ongoing tension between decentralized cryptocurrencies and traditional financial institutions.
• Central banks wield significant influence over monetary policy, and their decisions can have a profound impact on the value of fiat currencies and, consequently, on the cryptocurrency market.2
• The potential for regulatory crackdowns or the introduction of central bank digital currencies (CBDCs) poses a considerable risk to Bitcoin's long-term prospects.
• Conversely, if central banks where to greatly devalue their currencies, it would greatly boost the Bitcoin bull case.
Concerning Metrics and Cautious Outlook:
• Despite the potential benefits of a weakening dollar, other metrics warrant a cautious outlook.
• Market volatility remains a significant concern. Bitcoin's price fluctuations can be extreme, making it a risky investment for those with low risk tolerance.
• Regulatory uncertainty continues to cast a shadow over the cryptocurrency market. Governments worldwide are grappling with the challenge of regulating cryptocurrencies, and any adverse regulatory developments could trigger a sharp sell-off.
• Also, the overall global economic climate, with the potential for recessions, and geopolitical instability, add layers of uncertainty to the market.
• Investor sentiment is also a huge factor. While there are times of great excitement, and "Fear of missing out"(FOMO), there are also times of great fear, that can cause large sell offs.
Key Considerations:
• Macroeconomic Factors: The broader economic environment, including inflation, interest rates, and economic growth, plays a crucial role in shaping Bitcoin's price trajectory.
• Regulatory Landscape: The evolving regulatory landscape remains a key factor that could greatly effect Bitcoin's price.
• Investor Sentiment: The psychological factors that drive investor behavior, such as fear and greed, can have a significant impact on Bitcoin's price.
• Technological Developments: Advancements in blockchain technology and the adoption of cryptocurrencies by mainstream institutions could provide a boost to Bitcoin's long-term prospects.
In essence, while the weakening U.S. dollar may provide a favorable tailwind for Bitcoin, investors must remain vigilant and consider the multitude of other factors that could influence its price. The "high-stakes game of chicken" with central banks underscores the inherent uncertainty of the cryptocurrency market, and a cautious outlook is warranted.

BTCUSDT Analysis – From Simple to Complex!BTCUSDT Analysis – From Simple to Complex! 🚀
“Let’s break it down step by step. At first glance, the first red line looks like an obvious resistance point. But here’s the deal—it’s too obvious. And in trading, when something is too obvious, it often doesn’t work as expected.”
Basic Structure:
📌 Red Line = Clear Resistance – Everyone sees it, but that also means it could be a trap.
Now, Let’s Get Deeper...
🔍 Volume Analysis Changes the Game:
Weekend Moves with Low Volume = High Manipulation Risk – Crypto loves to fake out retail traders in these conditions.
Look at the Black Line Inside the Blue Area – This is where things get interesting. This level could be the true battleground between buyers and sellers.
CDV & Volume Profile Will Guide Us – We need confirmation from buying and selling volumes before making any major moves.
Final Thoughts:
“At first, the chart looks simple, but once you add volume analysis, things get more complex. Don’t trade based on what looks obvious—trade based on what’s actually happening in the order flow. I’ll explain the next step in my following post!”
📉 Stay smart, stay ahead! 🔥
My approach is built on years of experience and a solid track record. I don’t claim to know it all, but I’m confident in my ability to spot high-probability setups.
If you would like to learn how to use the heatmap, cumulative volume delta and volume footprint techniques that I use below to determine very accurate demand regions, you can send me a private message. I help anyone who wants it completely free of charge.
I have a long list of my proven technique below:
AVAXUSDT Perfect Short Entry!
🎯 ZENUSDT.P: Patience & Profitability | %230 Reaction from the Sniper Entry
🐶 DOGEUSDT.P: Next Move
🎨 RENDERUSDT.P: Opportunity of the Month
💎 ETHUSDT.P: Where to Retrace
🟢 BNBUSDT.P: Potential Surge
📊 BTC Dominance: Reaction Zone
🌊 WAVESUSDT.P: Demand Zone Potential
🟣 UNIUSDT.P: Long-Term Trade
🔵 XRPUSDT.P: Entry Zones
🔗 LINKUSDT.P: Follow The River
📈 BTCUSDT.P: Two Key Demand Zones
🟩 POLUSDT: Bullish Momentum
🌟 PENDLEUSDT.P: Where Opportunity Meets Precision
🔥 BTCUSDT.P: Liquidation of Highly Leveraged Longs
🌊 SOLUSDT.P: SOL's Dip - Your Opportunity
🐸 1000PEPEUSDT.P: Prime Bounce Zone Unlocked
🚀 ETHUSDT.P: Set to Explode - Don't Miss This Game Changer
🤖 IQUSDT: Smart Plan
⚡️ PONDUSDT: A Trade Not Taken Is Better Than a Losing One
💼 STMXUSDT: 2 Buying Areas
🐢 TURBOUSDT: Buy Zones and Buyer Presence
🌍 ICPUSDT.P: Massive Upside Potential | Check the Trade Update For Seeing Results
🟠 IDEXUSDT: Spot Buy Area | %26 Profit if You Trade with MSB
📌 USUALUSDT: Buyers Are Active + %70 Profit in Total

My FINAL Bitcoin chart and Idea (forever)Everyone is too busy focusing on the wrong Technicals. Fear and Greed, RSI, MACD, Stock Markets, etc. All of these are good tools but we have to remember a few things:
1. Zoom out (Bitcoin follows the same 4-year cycle every time... this time is NOT different)
2. Keep it Simple (I'm tired of messy charts, only put what you need for the current timeframe)
3. Avoid Leverage (These areas are too risky and much too volatile... liquidity is getting grabbed at almost every level) Stay safe.
I expect Bitcoin to retrace to $57k and then bounce back up... clear skies ahead if we can break out of this pattern I have drawn up. (If not we keep ranging as follows until we break significantly above the previous ATH)
Peace out! It's been fun... I may return to crypto one day (if ykyk)

Insane Growth Is Just Beginning For Bitcoin BTCHello, Skyrexians!
Recently we made two analysis on BINANCE:BTCUSDT . In the first one we pointed out that $80k is going to be the reversal point, in the second that bullish reversal bar has been confirmed at $85k. Now we are seeing how it is playing out. This is just the beginning of a pump. Here is why.
On the daily time frame we can see the green dot on the Bullish/Bearish Reversal Bar Indicator which has appeared when price bounced form. 0.5 Fibonacci. For us this is the clear sign that wave 2 has been finished and now Bitcoin is printing wave 3. This wave has the most realistic target next to $180k at 1.61 Fibonacci extension, but the strong resistance can be met at $140k.
Best regards,
Skyrexio Team
___________________________________________________________
Please, boost this article and subscribe our page if you like analysis!

Bitcoin RSI Dips Below 30 Again!The above chart highlights Bitcoin's price action alongside the Relative Strength Index (RSI) on a daily timeframe. Historically, every time the RSI dropped below 30, indicating oversold conditions, Bitcoin experienced a price bounce shortly after. The chart marks these moments with blue circles and green arrows, showing clear upward reversals following each dip. Currently, Bitcoin's RSI has once again fallen below 30, with the price around $87,000 after a sharp 10% drop. If past patterns hold true, this could signal an upcoming bullish reversal.

Bitcoin BTC Is Ready To Take Off!Hello, Skyrexians!
Yesterday we pointed out that 0.5 Fibonacci has been reached at $80k and this dump will not continue. Today we have a great bounce above $85 and the great chart to be sure that our previous scenario is right.
Let's take a look at the daily time frame. As usual we have the 5 Elliott wave cycle which has been started at GETTEX:49K and finished at $110k. Then the current correction has been started. Yesterday this ABC zigzag has reached the 0.5 Fibonacci retracement and bounced back. The great thing is the green dot on the Bullish/Bearish Reversal Bar Indicator inside the target zone. This gives us 90% probability that price has found the bottom and ready for the next huge wave to the upside.
Best regards,
Skyrexio Team
___________________________________________________________
Please, boost this article and subscribe our page if you like analysis!

Bitcoin Upward WavesSince the previous Bitcoin Impulse wave analysis got very long, here the subsequent analyses for Bitcoin Upward waves will be presented. Anyway, continuing from the last analysis; the correction started when Bitcoin touched the major channel's upper line and the horizontal resistance area (The chart of previous analysis is provided for reference in blow). There are two possible areas for the current Bitcoin't correction wave. The first is the purple triangle, and the second is the orange one. The only difference between these two areas is that if the Bitcoin reaches the orange triangle, the major ascending channel will be invalidated, since Bitcoin has breached the channel's bottom. Let's see what happens.

BITCOIN WILL EXPECTED TO 125000!!!As you can see now bitcoin make 4th cycle of elliot wave, and today we're gonna wait for price hit to minor support, the minimum takeprofit will be at 98000.

Bitcoin Plummets: ETF Exodus, Liquidations, and Global Jitters
Bitcoin's recent plunge below the $90,000 threshold, a level unseen since November 2024, has sent ripples of concern through the cryptocurrency market. This sharp correction is attributed to a confluence of factors, including persistent ETF outflows, a surge in leveraged liquidations, and mounting geopolitical tensions, creating a volatile environment that has shaken investor confidence.
The most immediate catalyst for Bitcoin's decline has been the sustained outflows from US-listed Bitcoin ETFs. These exchange-traded funds, which had previously fueled Bitcoin's ascent by providing institutional investors with easy access to the cryptocurrency, have recently witnessed a reversal in sentiment. Investors, possibly reacting to broader market anxieties and profit-taking, have begun withdrawing funds, putting downward pressure on Bitcoin's price. This outflow signals a shift in institutional appetite, raising questions about the sustainability of the previous bullish momentum.
Adding fuel to the fire, the crypto market has experienced a significant wave of liquidations. Over $1.3 billion in leveraged positions were wiped out as Bitcoin's price plummeted. These liquidations, which occur when traders using borrowed funds are unable to meet margin requirements, exacerbate price volatility by triggering cascading sell orders. The sheer volume of liquidations underscores the high degree of leverage prevalent in the crypto market, highlighting the inherent risks associated with such trading strategies.
Furthermore, macroeconomic uncertainties are contributing to the risk-off sentiment permeating financial markets. The recent strengthening of the Japanese yen, often seen as a safe-haven asset, reflects investor concerns about global economic stability. Similarly, the dip in Nasdaq futures suggests a broader aversion to risk in traditional equity markets, which often spills over into the crypto space. The re-emergence of US-China trade tensions adds another layer of uncertainty, as any escalation could have far-reaching economic consequences, impacting investor sentiment and asset valuations.
The technical outlook for Bitcoin remains precarious. Analysts are closely monitoring the $85,000 support level, which, if breached, could trigger a further sell-off. The potential for over $1 billion in long liquidations below this level suggests that a significant drop is possible. Some analysts are even warning of a potential free fall to $81,000 if the $85,000 support fails to hold, indicating a severe test of market resilience.
Moreover, a more dire prediction posits that Bitcoin could potentially drop below $70,000, erasing gains made since the US election. This scenario, while alarming, highlights the vulnerability of Bitcoin to macroeconomic factors and investor sentiment. The prospect of a significant correction raises concerns about the stability of the crypto market and its ability to withstand external shocks.
The current market conditions serve as a stark reminder of the inherent volatility of cryptocurrencies. While Bitcoin has demonstrated remarkable resilience in the past, its price remains susceptible to a wide range of factors, including ETF flows, leveraged trading, and global economic conditions. Investors must remain vigilant and exercise caution in navigating this turbulent landscape.
The recent downturn underscores the importance of risk management in cryptocurrency trading. Leveraged positions, while offering the potential for amplified gains, also carry the risk of substantial losses. The high degree of leverage prevalent in the market can exacerbate price swings, leading to rapid liquidations and further downward pressure.
Furthermore, the growing correlation between traditional financial markets and the crypto space highlights the need for investors to consider broader macroeconomic factors. Changes in interest rates, inflation, and geopolitical tensions can all impact investor sentiment and asset valuations.
In conclusion, Bitcoin's recent tumble below $90,000 reflects a confluence of factors, including ETF outflows, leveraged liquidations, and global economic uncertainties. The market remains highly volatile, and further price swings are possible. Investors should exercise caution and prioritize risk management in navigating this challenging environment. The ability of Bitcoin to recover from this downturn will depend on a variety of factors, including the resumption of ETF inflows, a reduction in leveraged trading, and a stabilization of global economic conditions. The coming weeks will be critical in determining whether Bitcoin can regain its footing or succumb to further downward pressure.

Bitcoin's Volatility Lull: Is a Major Breakout Imminent?Bitcoin, the undisputed king of cryptocurrencies, finds itself in a peculiar state of limbo. While the broader financial world buzzes with geopolitical uncertainty and economic shifts, BTC's price action has settled into a remarkably narrow range, leading to a significant drop in implied volatility. This period of relative calm, however, is juxtaposed with significant undercurrents: a major exchange hack, strategic accumulation by corporate giants, and the ever-present debate over Bitcoin's next major price movement.
One of the most notable observations is the near-record low implied volatility. Implied volatility, a measure of the market's expectation of future price swings, has dwindled, suggesting traders are anticipating less dramatic price fluctuations. This quietude is unusual for Bitcoin, a notoriously volatile asset. Traditionally, such suppressed volatility often precedes a significant breakout, either upward or downward. The current stasis could be a coiled spring, ready to unleash a surge of price action when the right catalyst emerges.
Adding another layer of complexity is Bitcoin's rangebound trading. Despite the recent Bybit hack, which raised concerns about exchange security and potential market instability, Bitcoin has remained remarkably resilient within its established trading corridor. This resilience, however, has also bred a sense of unease among traders and analysts. The lack of a decisive break in either direction has left many wondering whether this consolidation is a period of accumulation or a sign of waning momentum.
The Bybit hack, while disruptive, appears to have had a limited impact on Bitcoin's overall price trajectory. This suggests that the market may be becoming more adept at absorbing such shocks, a sign of its growing maturity. Nevertheless, the incident serves as a stark reminder of the inherent risks associated with centralized exchanges and the importance of robust security measures.
Amidst this backdrop of low volatility and rangebound trading, the pronouncements of prominent traders and corporate players are adding fuel to the fire. A crucial narrative revolves around the $106,000 price level. According to some analysts, this threshold represents a critical juncture for Bitcoin. A successful reclaim of this level would, they argue, signal the beginning of a new phase of price discovery, potentially leading to substantial gains.
However, the path to $105,000 + is far from certain. Counterarguments suggest that a significant dip to $80,000 remains a distinct possibility. This perspective highlights the inherent uncertainty of the cryptocurrency market, where technical analysis and fundamental factors can often provide conflicting signals. The potential for a sharp correction underscores the importance of risk management and the need for traders to remain vigilant.
On the bullish side, MicroStrategy's Michael Saylor continues to make waves with his unwavering commitment to Bitcoin. The company's "21/21" plan, which involves ongoing Bitcoin accumulation, is progressing steadily following a recent $2 billion convertible note offering. Saylor's bullish stance and his company's strategic acquisitions have become a significant market force, providing a powerful vote of confidence in Bitcoin's long-term potential.
MicroStrategy's approach is not merely speculative; it is a calculated bet on Bitcoin's role as a store of value and a hedge against inflation. This strategy has resonated with other institutional investors, contributing to the growing acceptance of Bitcoin as a legitimate asset class. The company's continued accumulation efforts are likely to exert upward pressure on Bitcoin's price, particularly if demand from other sources increases.
The confluence of these factors – low implied volatility, rangebound trading, the $105,000+ debate, and MicroStrategy's aggressive accumulation – creates a fascinating and potentially explosive dynamic. The low volatility could be a temporary lull before a significant price movement, while the rangebound trading indicates a period of indecision that will eventually resolve itself.
The $105,000+ level represents a critical test for Bitcoin. A successful breach of this threshold could trigger a wave of buying, propelling the price to new highs. Conversely, a failure to reclaim this level could lead to a significant correction, potentially validating the bearish predictions of a dip to $80,000.
In the meantime, MicroStrategy's continued accumulation provides a strong foundation of support for Bitcoin's price. The company's strategic approach and its commitment to long-term holding suggest that it is not swayed by short-term price fluctuations.
In conclusion, Bitcoin's current state is a complex interplay of conflicting signals. The low implied volatility and rangebound trading create an atmosphere of uncertainty, while the $105,000+ debate and MicroStrategy's accumulation provide clear points of focus. The cryptocurrency market is poised for a potential breakout, and the direction of that breakout will likely be determined by the interplay of these factors. Whether Bitcoin will reclaim $105,000+ or dip to $80,000 remains to be seen, but one thing is certain: the next chapter in Bitcoin's story is about to unfold.

BTC/USDT - Liquidity Grab & Potential UPSIDE MOVEMarket Analysis:
Liquidity Sweep: BTC recently grabbed sell-side liquidity around $95,215 - $95,141, triggering stop losses and gathering institutional orders.
Reversal Signs: After tapping into this liquidity, a bullish reaction has started, with price now moving towards the buy-side liquidity range.
Potential Upside Move: If BTC maintains support above $95,600, we can expect a push towards the $97,000 - $97,600 range.
Trade Setup:
✅ Entry: $95,800 - $96,000 (After price confirmation)
🎯 Target 1: $97,050
🎯 Target 2: $97,600
🚀 Extended Target: $98,800 (If momentum continues)
❌ Stop-Loss: Below $95,100 (Below liquidity grab zone)
Trade Rationale:
📌 Liquidity Grab: Market makers swept stop losses, indicating potential reversal.
📌 Market Structure: Bullish recovery from key support zone.
📌 Risk-Reward Ratio: ~1:3 (low risk, high reward setup).
🔔 Waiting for confirmation before entry! A strong bullish candle close above $96,000 can confirm entry. 🚀
📢 Let me know your thoughts! Are you bullish or bearish on BTC? 📈👇

Can Bitcoin Survive the Inflation Storm?Bitcoin, the world's most prominent cryptocurrency, has experienced a turbulent period, recently dipping below the $95,000 mark.1 This price correction comes amidst growing concerns about rising inflation in the United States, as reflected in the latest Consumer Price Index (CPI) data. The CPI, a key indicator of inflation, surpassed market expectations, reigniting fears of persistent price pressures and their potential impact on risk assets like Bitcoin.2
Inflation's Shadow Over Bitcoin
The unexpectedly high CPI reading has sent ripples through financial markets, with investors becoming increasingly wary of the Federal Reserve's response to inflation. The Fed's primary tool for combating inflation is raising interest rates, a move that can make borrowing more expensive and potentially slow down economic growth. This prospect often leads investors to reduce their exposure to riskier assets, including cryptocurrencies like Bitcoin.
The connection between inflation and Bitcoin is complex. While some argue that Bitcoin can serve as a hedge against inflation due to its limited supply, others believe that it is still too volatile to be considered a safe haven asset. The recent price drop suggests that market sentiment is currently leaning towards the latter view, with investors reacting to the inflation news by selling off their Bitcoin holdings.
Market Dynamics and Technical Levels
Bitcoin's price movements are influenced by a multitude of factors, including macroeconomic trends, regulatory developments, and market sentiment. In addition to inflation concerns, the recent price drop could also be attributed to normal market corrections, profit-taking by traders, and technical factors.
Analyzing Bitcoin's price chart reveals key support and resistance levels that traders are closely monitoring. The $95,000 level appears to be a crucial support zone, and a sustained break below this level could lead to further price declines. On the upside, the $101,000 mark is a significant resistance level, and a decisive move above this level could signal a potential recovery for Bitcoin.
The Fed's Dilemma and Potential Scenarios
The latest CPI data presents a challenge for the Federal Reserve, which is tasked with balancing the goals of controlling inflation and maintaining economic growth. While the higher-than-expected inflation reading might suggest the need for more aggressive interest rate hikes, the Fed also needs to be mindful of the potential impact on economic activity.
Despite calls for lower interest rates, the Fed is widely expected to continue its path of gradual rate increases in the coming months. The central bank has repeatedly emphasized its commitment to bringing inflation under control, and a strong labor market provides further support for its policy stance.
Looking ahead, several scenarios could play out for Bitcoin. If inflation remains elevated, the Fed might need to take more aggressive action, potentially leading to further price declines for Bitcoin. On the other hand, if inflation starts to subside, the Fed could adopt a more dovish stance, which could provide some relief for Bitcoin and other risk assets.
Bitcoin's Long-Term Outlook
Despite the recent price volatility, the long-term outlook for Bitcoin remains positive for many market participants. The cryptocurrency's underlying technology, blockchain, continues to attract interest from various industries, and the adoption of Bitcoin by institutional investors is steadily increasing.3
Furthermore, some argue that Bitcoin's decentralized nature and limited supply make it an attractive alternative to traditional currencies, especially in times of economic uncertainty. While Bitcoin's price can be volatile in the short term, its long-term potential continues to draw investors seeking exposure to the digital asset space.
Navigating the Uncertainty
The current market environment is characterized by uncertainty, with inflation concerns and macroeconomic factors weighing on investor sentiment. Bitcoin, like other risk assets, is susceptible to these broader market trends. However, it is essential to remember that Bitcoin is a nascent asset class, and its price volatility is to be expected.
Investors considering Bitcoin should carefully assess their risk tolerance and conduct thorough research before making any investment decisions. While Bitcoin's long-term potential remains intriguing, it is crucial to be aware of the inherent risks associated with investing in cryptocurrencies.

BITCOIN CRASH BEST TRADE IDEA🔻 BTC/USDT Short Setup - 30M Analysis 🔻
Bitcoin has rejected a key resistance zone around $97,400-$97,550, showing signs of a bearish move. Price has failed to break above this supply area, and now a potential sell-off towards the sell-side liquidity range is in play.
🔹 Entry: Around $97,400 (Retest of resistance)
🔹 Stop Loss: $97,550 (Above supply zone)
🔹 Target: $94,725-$94,711 (Liquidity sweep level)
📉 Analysis Breakdown:
✅ Price is reacting to a well-defined supply zone.
✅ Bearish momentum increasing after liquidity grab.
✅ Confluence with 50 EMA rejecting price.
✅ High probability of price reaching liquidity range.
Watching this trade closely—let me know your thoughts! 📊🔥
#Bitcoin #BTCUSDT #CryptoTrading #PriceAction #TradingView #CryptoSignals 🚀

BTC weekly zones
🚀 Bullish Breakthrough for Bitcoin on Weekly Time Frame! 🚀
Just in from @RSI_Trading_Concepts on @TradingView - the Bitcoin weekly chart is a beacon of bullish sentiment! 📈 The analysis highlights how the #BTC bulls are not just defending but thriving at the Overbought (OB) zone low on the weekly time frame, showcasing their strength and determination. 💪
🔹 Key Insights:
Following a significant breakout in late 2023, Bitcoin has been on a steady upward trajectory.
The bulls have impressively defended the OB Low at $53,841 on the weekly chart, indicating strong support within this zone.
This defense of the OB Low, especially in an overbought RSI context, suggests that the market sentiment remains overwhelmingly positive, with momentum favoring further gains.
🔹 What This Tells Us:
This isn't just a defense; it's a statement from the Bulls. Holding strong at this critical level, particularly after RSI has indicated overbought conditions, is a powerful sign that the current trend might continue. The market is showing us that despite being in overbought territory, the appetite for Bitcoin is still voracious.
Don't overlook this signal! The resilience at this key level on the weekly chart could propel Bitcoin to new heights. Keep your eyes on this zone and prepare for what might be an exhilarating journey upwards. 🚀💹 #Bitcoin #Bullish #Crypto #RSI #TradingView

The Wait Is Almost Over – Alt Season Is Near
The moment we've all been waiting for is just around the corner. Now is the time to apply cycle indicators and accumulate high-potential coins.
I was much less active in January due to the 3-day cycle failures on most altcoins. The last 60-day cycle of the weekly trend didn’t offer great buying opportunities. But now, it's time to start aiming for those 100%-200% gains with relatively lower risk. (Premium members are already scouting top coins in our chat!)
🔸 Not Everything Is Straightforward Yet
Just because some alts have dipped **60-70%** over the last two months doesn’t mean they’ll immediately pump. You still need to **buy in the “green” zone** on cycle indicators—otherwise, you risk getting rekt.
🔹 Bitcoin Outlook
BTC is slowly approaching its **60-day cycle low** toward the end of the month. The **3-day cycle topped above 80**, increasing the chances of BTC heading toward the **90s area** before finding support.
😱 More blood on the charts?
Possibly. Right now, there are two types of traders:
1️⃣ Those who believe the top is in.
2️⃣ Those who think February will be extremely bullish.
I believe once both groups are confused, the upside will resume—likely in March, after the 3-day cycle resets and Bitcoin takes another leg down to shake out traders.
📉 Watching the 2-Week & 3-Day Cycles
When the 2-week cycle trends downward, we usually don’t perform well. Sure, we could reverse before the cycle fully resets, but ideally, we want the 3-day cycle to drop to around 20 before rebounding.
If the 3-day cycle continues to fall (which is likely unless we move up soon), February could see more bearish action before a stronger recovery.
Stay sharp & follow the cycles. 🚀

BTC / USDT: Gearing up for a breakout above trendline resistanceBitcoin (BTC/USDT): Gearing Up for a Breakout Above Trendline Resistance
Bitcoin is setting up for a major move 📈 as it approaches a critical trendline resistance zone 📊. The price has been consolidating tightly, forming the perfect setup for a potential breakout 💥. If BTC successfully clears this resistance, we could see a strong bullish trend unfold 🚀. Keep a close eye 👀 and wait for confirmation before taking action.
Key Insights:
1️⃣ Trendline Resistance: Bitcoin is nearing a long-standing trendline that has repeatedly acted as a barrier. A decisive break above this level could mark the start of a significant upward move.
2️⃣ Volume Surge: Watch for a notable increase in trading volume during the breakout to confirm strong buying pressure 🔥.
3️⃣ Bullish Signals: Indicators like RSI and MACD are showing strength ⚡, further supporting the potential for a bullish breakout.
Steps to Confirm the Breakout:
✅ Look for a clear 4H or daily candle closing above the trendline 📍.
✅ A noticeable spike in volume during the breakout can signal strong buying activity 📊.
✅ A retest of the broken resistance as a new support zone adds credibility to the move.
⚠️ Be cautious of fake breakouts, such as sharp reversals or wicks above the trendline.
Risk Management Strategies:
🔒 Use stop-loss orders to protect your capital.
🎯 Ensure position sizing aligns with your overall trading strategy.
This analysis is for educational purposes only and not financial advice. Always conduct your own research (DYOR) 🔍 before making investment decisions.

Bitcoin Price Projection: $94,700- Both daily and hourly charts indicate a possible downtrend.
- A 1 HR FVG sits between 98,754 and 98,916, which could act as resistance.
- Multiple bearish FVGs sit above the HR FVG, so I see a good amount of resistance in the near term.
- A big liquidity zone is under the last Lowest Low (96,256.75), which has yet to be swept.
- If 96,256.75 finds no support, we could be headed as low as 94,709.43. At that price point, a huge liquidity zone is filled and a small 1hr FVG is hit.
