Major BTC Bulltrap? Another leg downwards! BTCUSD Index Analysis OF Very Probable reversal and new downtrend continuation
Reasoning goes by the points I've made below
DOUBLE-TOP that happened at May 20th and June 24th AT 71940 BITSTAMP:BTCUSD
Further major and strong Order Block (4H OB) at 67700-68400 BITSTAMP:BTCUSD level
This recent move, that has been happening since July 19th, has sweeped old Liqudity area that previously formed mid-trend and formed DOUBLE TOP that happened at June 14th & 17th
Additionally, June 20th Liqudity Run, that formed a Lower Timeframe Breaker Block, which was recently used as support for last liqudity area, just got swept (at the time of writing 20:52 utc +3).
All of above coinsides with 0.236 Fibonaci retracement of last major downtrend that started at June 24th and ended on July 5th.
Exuberant market sentiment about recent market uptrend and additionally too many optimistic mainstream media news regarding $BTCUSD.
For last few confirmation would like to see
66300 Level - Break and Close of LTF Breaker block area
62400 Level - Another imporant level, if we break and close below, then it will only confirm all of the above.
53500 Level - future level that I watch, when we get closer to it I will do another analysis.
Bitcoinpriceprediction

#BTC/USDT Road to $150k!#BTC : Block out the noise.
We're far from finished! Each dip presents a new opportunity.
You FOMO when the market's green, but turn sceptical when it's red. That strategy won't cut it.
Bitcoin Monthly Analysis Update
Chart Overview:
- Channel Analysis: Bitcoin is in a long-term ascending channel, showing a bullish trend with strong support and resistance.
- Historical Patterns:
- 2016-2018: 60 bars (420 days),
- 2020-2021: 34 bars (238 days),
- Current Position: Trading at $66,993.6 nearing upper channel resistance with a target of $115k to $150k.
Key Levels:
- Support:
- $51,682.
- $43,285. (High Liquidity Untested Territory)
- Resistance:
- $66,993.6
- $73,000
Future Projections:
- High Liquidity Untested Territory: Retest around $43,210.7 could be a strong buy.
- Bullish Scenario: Breaking current resistance targets $115,000 - $150,000.
- Bearish Scenario: Failure to break $70k resistance may lead to correction towards support levels in the high liquidity zone, GETTEX:48K to $60k. (Will update as the time goes and more candles are printed), less likely scenario but possible. Am I scared or selling? NO! I am holding BTC and Alts.
Market Sentiment: Volume increase during last bull run suggests bullish sentiment, but traders should be ready for volatility.
Conclusion: Bitcoin remains bullish within the ascending channel. Monitor key levels to capitalize on market movements.
DYOR, NFA 🚀
#Crypto
What do you think?

Bitcoin Daily Chart Bitcoin is currently experiencing a pullback after a bullish run lasting nine days. The next strong support zone is between $61,379 and $60,298. I anticipate Bitcoin will fall to this point of interest (POI), where we should see a reaction. There are multiple confluences suggesting a long setup, one of which is Bitcoin trading above the 200-day EMA, an important indicator of strength.

BITCOIN 4h On the 4-hour chart, as you can see, Bitcoin's price faced some demand after ranging and minor fluctuations around the $53,700 level. Following the break above the $60,000 channel, it managed to grow by almost 20% to the $65,000 range.
Currently, it is trading around $64,400. My expectation for Bitcoin is that it could grow to the 66,700–67,500-dollar range. If we see weakness in the candles and confirmation of resistance around the crucial 67,500-dollar level, we might witness consolidation and a correction. To better understand the ongoing trend, we should observe how the price reacts to these key levels. If it encounters demand and manages to break through the significant 67,500-dollar mark, the next target could be around 69,500 dollars.
Remember, this is just my personal analysis, not financial advice. Do your own research and make informed decisions. Happy trading!✌😎
If you have any questions or need further clarification, feel free to ask. I’m here to help!✌
If you found my analysis helpful, please show your support by liking and commenting. Thank you!🙌

#BTC/USDT Hit our Target $63k What's Next? Since the last BTC update, the price has followed our expected path perfectly. Currently, BTC is trading right around the critical resistance level of $63k, a level I've highlighted since it reached $53k. This is the moment of decision.
Following the news of an assassination attempt on Trump, the market experienced a relief rally. However, it's still uncertain whether we are out of the woods yet.
The best strategy now is to start positioning into altcoins while holding BTC. Over the past 3-4 weeks, I've posted insights on 40 altcoins. Feel free to review those, as I'll be sharing 30 more promising altcoins starting today, so make sure to follow me.
Returning to the chart, if BTC breaks above the $63k level, we could see it trading around $70k+ in the short term.
The mid-dotted line, which previously acted as support, has now turned into resistance. A breakout above this level could be very bullish for the market since the same level aligns with Multiple EMAs.
We are almost there; patience is key.
The most reasonable move now is to wait for a breakout above $63k. A break and close above this level would signal a strong opportunity to go long on both altcoins and BTC.
I will keep this chart updated and inform you of any significant changes, whether the breakout occurs or not.
So, follow me and share these charts with others. Don't forget to hit the like button. Please share your views, questions, or altcoin requests if you have any.
Thank you.
PEACE

BTC Long - Take Profit Targets (Short Term/Scalp)🚀 CRYPTOCAP:BTC Update: Soaring High! 🚀
My positions are crushing it! 🤑 Time to start locking in some gains. 😎
Scaling out in these zones:
#BTC: $59.5K - $63.5K 🎯
Already de-risked 25% as we hit the lower end of my targets. Smart money secures profits along the way! 😉
Remember, this is NOT financial advice. Do your own research and trade responsibly! 🧠
Thank you
If you’ve found this useful and are interested in learning more, please consider freely supporting my content: 🙏
🔗 Follow me: @endeavor_quest
❤️ Like and Repost

BTCUSDT - prepare to go upI told everything in the video
if you like the idea, please "Like" it. This is the best "Thanks!" for the author 😊 P.S. Always do your own analysis before a trade. Put a stop loss. Fix profits in installments. Withdraw profits in fiat and please yourself and your friends.

#BTC/USDT Broke the support, Next move explained!Welcome to this Idea on Bitcoin.
As speculated in my previous update, the price was unable to break the 100 EMA, resulting in a rejection and subsequent decline. Now, $56,452 appears to be the next significant level to monitor. The 200 SMA on the daily chart is also crucial, with the price currently trading around this level. Let's observe if this support holds.
It's important that funds currently in meme coins shift to stronger assets, as they are siphoning liquidity from the market.
Patience is key here. I've posted over 30 altcoin charts in the last 8 days, and prices are gradually moving towards accumulation levels. If this cycle mirrors previous ones, the current market depression will soon end. We just need to stay vigilant and look for opportunities.
**BONUS:** Use the 245 EMA to plot market bottoms on lower time frames (LTF) in the daily chart. It's very useful—try some backtesting.
If you like my content, please hit the like button and share your views in the comments section. Thank you.
#PEACE

Bitcoin Halving: A Historical Look at Price and ScarcityThe Bitcoin halving cycle, a programmed event that roughly cuts the block reward for miners in half every four years, has become a focal point for investors and enthusiasts alike. Historically, these halvings have been followed by significant price increases for Bitcoin, leading many to believe they are a reliable indicator of future bull runs. However, the relationship between halvings and price is more nuanced than a simple cause-and-effect scenario.
The core principle behind the price impact lies in scarcity. By reducing the rate at which new Bitcoins are created, halvings limit the overall supply. In a market driven by supply and demand, a decrease in supply can theoretically lead to an increase in price, as long as demand remains steady or increases. This anticipation of scarcity often fuels a price rise in the months leading up to the halving event. Investors see the limited supply as a bullish signal, prompting them to buy Bitcoin in hopes of future appreciation.
However, the price doesn't always experience an immediate surge after the halving. The newly minted Bitcoins are a significant reward for miners, who contribute computing power to validate transactions on the Bitcoin network. The halving essentially cuts their income in half, which can lead to a temporary decline in mining activity, impacting the network's hashrate (total computing power). This initial drop in hashrate can cause a period of price consolidation, where the price trades sideways as the market adjusts to the new supply dynamics.
The recovery from this consolidation phase is often described as "weak miners dying and hashrate recovering." Less efficient miners, who can no longer operate profitably with the reduced rewards, are forced to shut down their operations. This reduces the overall hashrate and makes the network more efficient as only the most powerful miners remain. As the hashrate recovers, typically within a few weeks or months, the price can experience a significant breakout, fueled by both the scarcity effect and renewed investor confidence.
Looking at historical data, this pattern seems to hold true. Following the 2012 halving, the price of Bitcoin rose from around $11 to a peak of $1,100 in November 2013. Similarly, the 2016 halving was followed by a rise from $650 to nearly $20,000 by December 2017. The 2020 halving coincided with a bull run that saw Bitcoin reach an all-time high of over $69,000 in 2021. However, it's important to remember that these are just a few data points, and the cryptocurrency market is notoriously volatile. External factors such as economic conditions, regulatory changes, and broader market sentiment can also significantly impact Bitcoin's price.
The most recent halving, which occurred in April 2024, presents an interesting case study. While the price did experience some pre-halving anticipation, it hasn't yet reached a new all-time high. Additionally, the hashrate recovery has been slower than in previous cycles, taking over 60 days compared to the 24 days observed in 2017. This could be due to a number of factors, including the ongoing global economic uncertainty and the increasing energy costs associated with Bitcoin mining.
Only time will tell how the 2024 halving will ultimately impact the price of Bitcoin. However, by understanding the historical trends and the underlying economic principles at play, investors can make more informed decisions about their Bitcoin holdings. The halving cycle serves as a reminder that scarcity can be a powerful driver of price, but it's just one piece of the complex puzzle that shapes Bitcoin's value.

Bitcoin; historical analysisIn this post, Bitcoin's past behavior, including impulse and correction waves, is analyzed to forecast what could happen in the future. So, let's jump to the main point.
The first Bitcoin move (including the upward and correction waves) lasted much shorter due to initial acceptance. If we do not take into account Bitcoin's first move, the next three major moves, impulse, and correction, have behaved almost very similarly to each other in terms of duration. Especially, the two previous waves; third and fourth. Both waves lasted for 205 weeks, in which, the upward wave lasted for 152 weeks and correction waves lasted for 53 weeks. So, if the same behavior is to be repeated in the future, the two horizontal lines (green and red) are possible endpoint targets for Bitcoin's fifth move. Also, some Fib time analysis were done to adjust these two lines.
Another important point is how much each correction wave has lowered the price. The first one: 93.8%, the second and third ones: 83%, and the fourth one: 77.5%. It can be concluded that Bitcoin's correction waves are getting smaller, in terms of value. So, the next correction wave, the fifth one, could either be equal to 77.5% or less. Of course, this issue is far into the future. But it is worth considering.
Moreover, it seems a classic 5-wave impulse wave is unfolding, and currently the final wave 5 is in play. In addition to this, it seems that the angle of each major upward wave of Bitcoin is decreasing at each stage. Based on these assumptions and Fib extension analysis, the yellow rectangle can be a suitable area for the end of the current bullish wave. Let's see what happens.
P.S. See related links below for step-by-step Bitcoin analysis.

DXY: an indicator to forecast Bitcoin’s directionJust like USDT Dominance, US Dollar Index (DXY) has a somewhat inverse correlation with Bitcoin's direction. If we look at the DXY historically, whenever the DXY was in a downtrend or sideways movement, Bitcoin was in an uptrend. Also, whenever the DXY was in an uptrend, Bitcoin was in a downtrend. Simply put, if the DXY goes up, that means the U.S. dollar is gaining strength or value when compared to other assets and currencies. So, people/traders tend to hold the U.S. dollar instead of, say, Bitcoin. And when DXY goes down, that means the U.S. dollar is depreciating in value, so people/traders tend to hold other assets like Bitcoin or Gold.

[LONG] Reputable news sites say BTC is 7 days away from going up**Technical Analysis: Bitcoin (BTC) Daily Chart**
**Current Market Situation:**
Bitcoin (BTC) is currently trading at a critical support level, with the daily chart indicating a high likelihood of a reversal in the near term. The Relative Strength Index (RSI) is hovering around 30, signaling that the cryptocurrency is approaching oversold territory.
**Oversold Conditions:**
The RSI, a popular technical indicator, measures the speed and change of price movements. A reading below 30 typically indicates that the asset is oversold, suggesting a potential rebound. With BTC's RSI hovering around this level, it's likely that the selling pressure will soon subside, paving the way for a potential rally.
**Support Level:**
The last lowest support level was $59,000. This level has been tested on multiple occasions, and a bounce from this $63,100 could propel the cryptocurrency higher.
**Bullish Sentiment:**
Reputable news websites are reporting that a BTC price surge is imminent, with some sources suggesting that the cryptocurrency is just 7 days away from a significant upward move. This bullish sentiment, combined with the oversold conditions on the daily chart, creates a compelling argument for buying BTC at current levels.
**Buying Opportunity:**
Given the confluence of oversold conditions, support at $63,100, and bullish sentiment, now is an attractive time to consider buying BTC. The cryptocurrency's price is likely to rebound from this level, and with the next potential low already established at $59,000, the risk-reward ratio is skewed in favor of buyers.
**Conclusion:**
In conclusion, the technical analysis suggests that BTC is on the cusp of a potential reversal, with oversold conditions and a robust support level at $59,000. The bullish sentiment and imminent price surge reported by reputable news sources further reinforce the case for buying BTC at current levels. With the stars aligning in favor of a potential rally, now may be an opportune time to enter the market.

BTC Bitcoin Technical Rebound SoonIf you haven`t sold BTC on this top:
Then you need to know that Bitcoin is currently trading at $64,200, approaching the oversold territory on the RSI Relative Strength Index.
Historically, when Bitcoin enters the oversold area on the RSI, it often experiences a technical rebound.
The RSI is a momentum oscillator that measures the speed and change of price movements, with values ranging from 0 to 100. An RSI below 30 is typically considered oversold, indicating that the asset may be undervalued and due for a rebound as buyers step in to take advantage of lower prices.

Bitcoin — Levels to Watch And Why 52k Is Possible!Had so many requests about Bitcoin. That's why I wanted to share the thoughts I already discussed in today's live feed earlier in the morning.
From my POV, Bitcoin's setup is pretty obvious: CRYPTOCAP:BTC traded in a bull flag and broke out ~1 month ago. However, up to now, the outbreak has led to a pump. Conversely, BTC has started to trade in a downtrend. Nevertheless, it has respected the upper boundary of the bull flag up to now.
If Bitcoin continues on this path, it will reach the major support area of ~62k in a few days.
And that's when it gets interesting: Either both support lines hold, and BTC starts a fresh pump — or it is about to get hairy.
Here's why: If BTC breaks below the support at 62k, there's actually no additional support above 52k. Therefore, we might see a decline to the lower 50,000 levels.

BITCOIN is on the verge of a deep fall. What can save the growthBitcoin was unable to continue its growth trend, which began in May through the range of $72000-74000. Buyers were not even able to update the previous local high and were immediately hit back:
Buyers were unable to hold the local range of $68000 to continue the upward wave from May. And the worst part is that bitcoin's decline is happening on small volumes:
The last chance to save the growth trend is the range of 64500-65500 . Right now, the BTC price is approaching a large number of buyer stop orders.
If the BTC price aggressively rebounds from this range and the daily candle closes above $68100, we expect BTC to continue to grow to $72000 and update local highs.
For now, we don't believe in this scenario, as the USDT dominance chart indicates that things may be just beginning:
The chart shows that a market drop of another 20-30% is highly likely. Therefore, in this case, we will consider short positions on bitcoin from the 68100 range.
Why there? Here is an hourly timeframe that shows that from this range, buyers began to slow down the price drop with limit orders:
If we assume that small traders opened short positions in this range, it is quite easy to pick them out.
The target for such a trade is $60,000. This target stems from our previous forecast and will be confirmed when the 64500-65500 range is broken down:
But what about other cryptocurrencies?
Write your thoughts in the comments!

Bitcoin Log Channels CRITICALIn the long term, Bitcoin is in a logarithmic channel. The levels of this channel indicate how cheap and how expensive Bitcoin is. The aqua-colored channel represents the exceptionally cheap region that Bitcoin has never entered in history. The yellow channel has always represented times in history when Bitcoin has been cheap. Therefore, if the 62k level is broken right now, Bitcoin will enter the cheap channel. If this happens, it will give Bitcoin one last buying opportunity before the next bull. The red area is the area that is usually seen in the bull market and where Bitcoin is relatively expensive. It is recommended to hold, not buy, in this area. The blue area is where Bitcoin peaks. It is usually advisable to sell within the blue channel.

USDT.D Logarithmic Trend Compared to Bitcoin TrendIn the long term, USDT dominance is in an uptrend. Within this trend, it often rises slowly, suppressing Bitcoin and altcoins, sometimes sideways, sometimes causing price declines. Then, with the sudden drops that follow, it puts Bitcoin and altcoins into a very sharp bull season. Right now, USDT is in an uptrend. I think that Bitcoin will enter a sideways channel as long as USDT remains in an uptrend. After this channel, a drop in USDT will put Bitcoin back into the bull season.

BitcoinSeems we completed this correction phase with the Weekly oversold at the bottom. Looking for the cloud recovery to hold as we impulse higher.
Prevailingnine 5/25/23

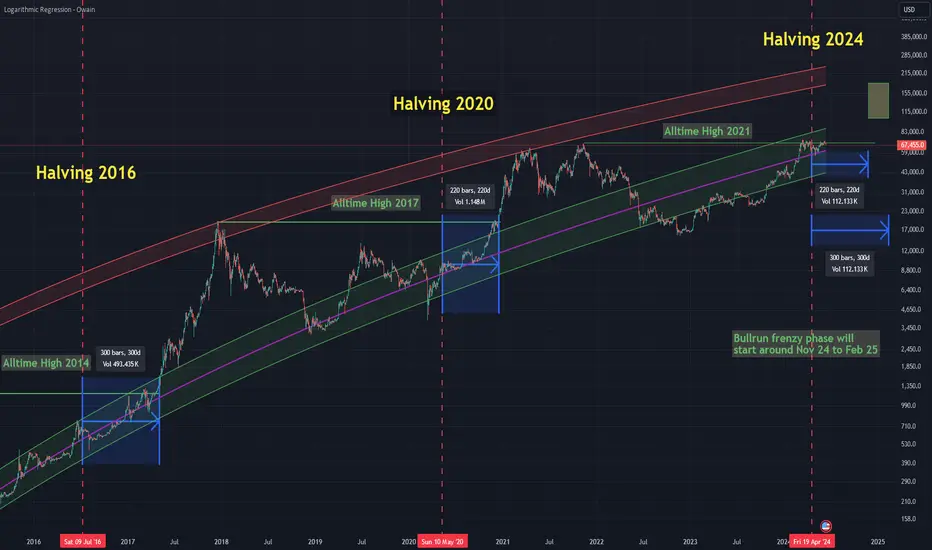
Bitcoin not due yet to go into full degen bull market modeIf history repeats itself - and so far history has repeated itself for Bitcoin every 4 years, we have not seen the true face of the Bitcoin bull market yet.
Let's have a closer look at where and when things could really go ballistic to the upside by analysing its so-called logarithmic regression:
You will see 3 different areas of importance on this chart:
1. A purple line showing the current "fair" price of Bitcoin according to the regression
2. A green channel marking the price area where Bitcoin should spend most of its time
3. A red channel marking the projected blow off tops for each bull run
The pattern we usually see is that after a top somewhere within the red channel Bitcoin eventually falls back to the green channel (and sometimes below it) to then settle roughly around the purple line at the time of the halvings.
What do these findings tell us about the current state of the bull market?
Let's look at the price behaviour after the halving of 2016 and 2020.... It took Bitcoin around 300 days after the 2016 halving and 220 days after the 2020 halving to finally breach the green channel to the upside and go into, what I call, full degen frenzy bull market mode. This is the area between the green and red channel, where prices go ballistic and influencers on social media will talk about the how everything will be different this time and how everything is only going up from now on.
As you can see Bitcoin currently is still quite far away from leaving the green channel to the upside. In fact if it would go into full frenzy bull market mode right now we would need to see prices well above 90,000 USD. If history repeats itself again and we can expect the price to leave the green channel to the north sometime 220 to 300 days after the halving. That would be sometime between November 2024 and February 2025 - the top of the green channel will then be around 100,000 USD.
Price will then probably rise rather quickly to the red channel again where it will eventually top out and, once again, enter a bear market. Top prices should be somewhere between 200,000 USD and 300,000 USD in 2025. It is then time to get out of the market and go into hibernation once again to come back once the lower green band of the logarithmic regression is reached.
The good news is....with prices currently around 67,500 USD there is still plenty of money to earn even until reaching the phase where the price of Bitcoin will really go ballistic. The bad news is... most people will be left behind and will probably fomo into Bitcoin (or the worse alternative: Altcoins) at prices between 150,000 USD and 200,000 USD.
This, of course, is just my own opinion and no financial advise!
A Bitcoin Compression patternBitcoin appears to be compressing near all-time highs in what looks like an ascending triangle. Previously, Bitcoin would pierce the ascending triangle to the downside and the result would be the liquidation of all of the leverage in the system, then the price of Bitcoin would proceed to chop around more before eventually moving higher. Essentially, the ascending triangle pattern would be extended by double the amount of time, give or take. I have found this example in many uptrends in crypto and specifically in Bitcoin.
While this scenario could certainly play out again, I lean more toward a sooner breakout before this type of scenario happens. Why? Quite simply - ETFs and big money have entered the market. A lot of these players are accumulating bitcoin for the long term in spot. The brokers will have a new fear to face besides waiting to liquidate people, what if they can't? It will force them to cover and the price could start driving higher sooner. This fact alone could lead Bitcoin to not follow its "usual" path of a breakdown first and an extension of its compression pattern and instead break to the upside and continue its journey further north.
For now, we wait and see what happens.
Cheers,
TCD

Bitcoin Breaches $69,000: Bullish Breakout?Bitcoin Breaches $69,000: A Bullish Breakout or a Fleeting Glimpse?
Bitcoin (BTC) bulls were ecstatic as the world's leading cryptocurrency climbed above $69,000 during early Asian trading on June 3rd. This move marked a significant milestone, breaking a resistance level that has held firm for the past 12 weeks. However, the crucial question remains: is this a decisive breakout or a temporary blip within a prolonged trading range?
The recent surge follows a period of relative stability for Bitcoin. After reaching a new all-time high near $69,000 in early March, the price retreated and consolidated within a range of roughly $60,000 to $67,000. This consolidation phase, while frustrating for some investors hoping for immediate gains, can be a healthy sign for the long-term health of the market.
Several factors are fueling the current optimism surrounding Bitcoin:
• Institutional Adoption: The continued influx of institutional investors into the cryptocurrency space is a major driver of growth. Large investment firms, hedge funds, and even traditional banks are increasingly recognizing Bitcoin's potential as a valuable asset class. This institutional interest provides much-needed stability and legitimacy to the market.
• Positive On-Chain Metrics: Analysis of on-chain data, which tracks the movement of Bitcoin on the blockchain, suggests positive signs for future price movements. Metrics like active addresses and exchange outflows indicate that investors are accumulating Bitcoin and holding onto their assets, which can reduce sell-off pressure and contribute to price appreciation.
However, there are also reasons for caution:
• Resistance at $69,000: The $69,000 level represents a significant point of resistance. Previous attempts to break above this level have been met with selling pressure, pushing the price back down. Successfully flipping this resistance into support will be a crucial step for a sustained bullish run.
• Macroeconomic Concerns: The broader macroeconomic environment remains a source of uncertainty. Rising interest rates, a potential global recession, and ongoing geopolitical tensions could all dampen investor sentiment and negatively impact the cryptocurrency market.
• Regulation: Regulatory scrutiny surrounding cryptocurrency remains a potential hurdle. Government intervention could stifle innovation and limit market growth, although clear regulations could also bring more stability and attract hesitant investors.
So, will Bitcoin's climb above $69,000 be a lasting victory? Experts are divided.
Some analysts believe this is a breakout signal, paving the way for a continued price increase towards new all-time highs. They point to the confluence of positive on-chain metrics, institutional adoption, and increasing scarcity of Bitcoin due to its capped supply.
Others remain cautious. They highlight the strong resistance at $69,000 and the potential for a pullback if bulls fail to maintain momentum. Additionally, they emphasize the unpredictable nature of the cryptocurrency market and the influence of external factors like global economic conditions and regulations.
Ultimately, the future direction of Bitcoin remains uncertain. However, the recent surge above $69,000 signifies a renewed sense of optimism in the market. Whether this translates to a sustained bull run or a temporary blip within a trading range will depend on various factors, including the ability of bulls to overcome resistance levels and the overall health of the global economy.
In the coming weeks, investors should closely monitor key metrics such as trading volume, order book depth, and news surrounding regulations and institutional adoption. These factors will provide valuable insights into the strength of the current uptrend and the potential trajectory of Bitcoin in the near future.

BTC ready for the pump??As I marked out you can see a descending channel followed by a bullish pendent that's breaking out. I've also marked out key levels that price bounces from. As of today price has reacted of the range of 67500 (Each level being marked 2500 apart). I believe we can be seeing prices reaching 82500 pretty soon! Hope everyone is having a successful trading day so far. BTC to the Moon. good luck everyone

#Bitcoin could hit $156,000 by May 27 2025! Here's Why!!BTC is trading at %68500 as we speak.
These green boxes represent the price action after #BTC halvings. We've never seen a red year after a halving.
Bitcoin halvings are significant events, here are the percentages of Bitcoin's price increase one year after each halving event to date:
1. First Halving (November 28, 2012)
- Price at Halving: ~$12.35
- Price 1 Year Later: ~$1,037
- Percentage Increase: ~8,296%
2. Second Halving (July 9, 2016)
- Price at Halving: ~$650
- Price 1 Year Later: ~$2,520
- Percentage Increase: ~288%
3. Third Halving (May 11, 2020)
- Price at Halving: ~$8,800
- Price 1 Year Later: ~$56,000
- Percentage Increase: ~536%
4. Fourth Halving (April 19, 2024)
- Price at Halving:~ $65,415
- Expected Price (1 Year Later): $115,000 - $156,000
- Percentage Increase:~ 127% at $156,000!
This return is decent as compared to the previous rallies.
Looking at the bigger picture is crucial if you want to see significant changes in your portfolio.
If you like this content, consider bookmarking it and sharing your views in the comment section.
Thank you!
#Bitcoin
