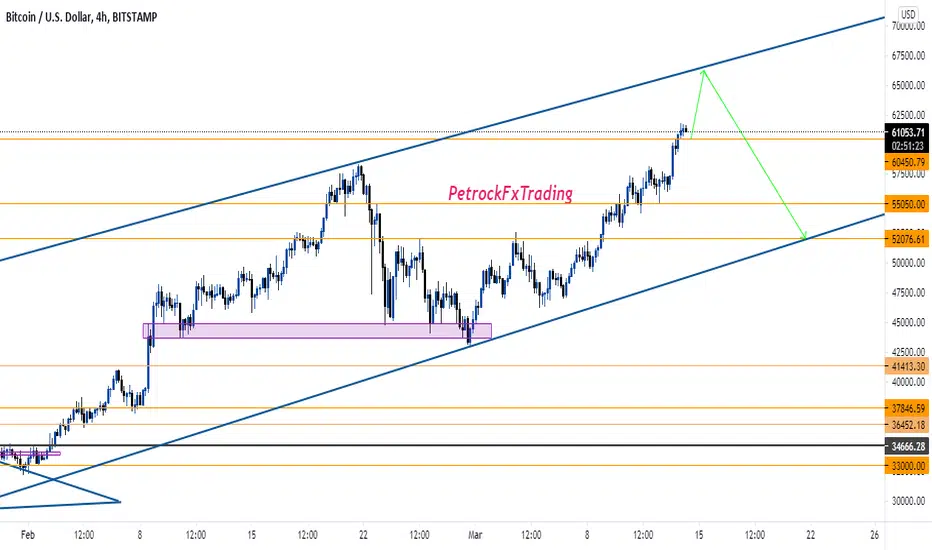
BITCOIN NEEDS TO MAKE A DECISION RELATIVLY SOONI have outlined to potential situation son the graph here.
1) you can see we have been held up by this lower uptraining zone of support for a few months now. It looks like we are currently finding support at it yet again.
2) Im very cautious of this green uptrending zone as we have tested it many many times over the past few months. The more you test support/resistance the higher the likelihood you will break it.
3) If we break bearish from this uptrending zone our next stop will likely be in the range of 28-32k, down where the lower green box is.
4) We have rejected from the 200 daily moving average back into support.
5) as of right now we are technically in an uptrend on bitcoin, setting higher highs and lows, however the volatility isn't enough for the price action to make a decision. The pattern bitcoin is forming on the daily is typically a bearish continuation pattern in most markets but as we have seen in the past bitcoin will sometimes break bullish out of bearish patterns like this, reasons unbeknown to me.
6) If we do break the red zone of resistance above us, as well as the previous high we just set, we could very well see a move to the 52k region.
7) This is not financial advice and always do your own research before entering the market.
Bitcoinpump

BTCUSD LongHey traders, we are monitoring BITCOIN for a buying opportunity around 46k zone, once we will receive any bullish confirmation the trade will be executed.
Trade safe, Joe.

USDT is flowing into BitcoinAI thinks USDT.D topped out.
It means that the markets accumulated too much USD.
Probably, whales will spend it on Bitcoin.

BTC Full update see this charts then comment
support :--
44k : 20% buying
40k: 30% buying
37.5k : 20% buying
36%: 30%
Target :--
TP1 : 50.7k
TP2 : 53k to 55k

bitcoin pump or dump ?Bitcoin is pinning down and attacking $ 76,000.
We will see this scenario next week at the latest.

btc forming cup and candle patternas we know btc breaked the small time high . so pushing for 60k . but this bull run will break the all time high . cup and candle is strong pattern .
so those who follow me will know , we are already bullish from 42k .

BTC Cup and Handle!just now
After breaking nicely out of a falling wedge and hitting my 49.2K target which I called at 47K , BTC has just formed and broken out of a cup and handle , with a technical breakout target of 52K. One thing to keep in mind here is that the volume is weak, but it has been growing for the last 12 hours. If there is a lack of sustained volume , then BTC could roll over under 48K and possibly below

#BTC chart updatehey guys, bulls killed all the local resistance finally only one is there lets see what happens. if bulls break this resistance then $43644 is next important resistance for bitcoin.

BTC back to the game!Hello ladies and gentleman, today we going to check BTC and what's going to do as its next move
40k is a big wall and we couldn't break it so as you see we back to 36-37k level. If break 40k then we jump to 44k level and if back to 34k and go below then we go to 31-30k
there are other alts that shine when BTC lagging in these levels and we cover them one by one.
can BTC back to 50k again this month?
have a great day

💥BTC BREAKOUT - TO RISE TO $36K, $38K & $40K😲Please support this idea with a LIKE👍 if you find it useful🥳
I expect a pump to $36,000 $38,000 and $40,000.
We have two buy confirmations on this chart.
First, descending triangle breakout and pullback has occurred. A pump is expected to follow.
Secondly, we have a double bottom (W pattern). If you look closely, we'll see the neckline within $36,000 - $36,700.
Therefore I expect a rise to $36,000 at the neckline. And if price break the neckline upward, we move to the second resistance at $38,000 and after a pull back, we go long to $40,000.
What do you think?
Share your opinion in the comment section✍️
Happy Trading💰🥳🤗

💥BITCOIN LAST DUMP BEFORE IT PUMPS😳Please support this idea with a LIKE👍 if you find it useful🥳
I expect a fall to $27,800 before rising again.
As indicated on this chart, we have a falling wedge pattern that price is stylishly following.
From my previous idea here,
I said a breakout from the 2nd triangle determines the next move. And I also made mention that if price breaks the 2nd triangle downward, it would fall to the 2nd triangle at $27,700 which is exactly what is manifesting on the chart.
Back to today's idea.
We can all see price approaching the lower trendine at $27,800 to make it the 3rd support. Thereafter, a reversal should follow and price will start soaring higher.
What do you think?
Share your opinion in the comment section✍️
Happy Trading💰🥳🤗

💥BITCOIN CONSOLIDATION HOLDS - NEXT?🤔I expect Bitcoin to pump to $40k, then $58k or dip to $20k.
We have our supply (resistance) zone also where our right shoulder lies at $40,500 - $41,500 and our demand (support) zone which is also the head and shoulder neckline at $29,000 - $30,000.
Fortunately, price bounced back upward at the demand zone with a bullish pin bar currently in view. And we have price heading to the upper trendine first, then the supply zone at $40,000 before $58,000.
Here is our Fate:
If price continue in this upmove, we go long to $38,000.
BUT
If price reverse, $20,000 may be the next new target which means the H & S Pattern will complete and this idea I published earlier which we all don't want will now complete. Check it out here and tap the play button👇
What do you think?
Share your opinion in the comment section✍️
Please support this idea with a LIKE👍 if you find it useful🥳
Follow me to receive more updates on this pair🤙
Comment any coin you need my analysis or forecast on📈📉
Happy Trading💰🥳🤗
Thank you for your support!💓

BEAR SEASON ALMOST OVER, BTC NEXT MOVEAs we can all see, we have 3 credible support trendline with the green arrow, the present daily candle has tested it and has not broken it.
Therefore if price does not break this support trendline, I expect Bitcoin price to long to $40,000, pull back then continue to rise.
If price breaks the supply (resistance) zone at $40,500 to $41,500, then we are off the bear season for good and we joyfully ride to $58,000.
What do you think?
Share your opinion in the comment section✍️
Please support this idea with a LIKE👍 if you find it useful🥳
Follow me to receive more updates on this pair🤙
Comment any coin you need my analysis or forecast on📈📉
Happy Trading💰🥳🤗
Thank you for your support!💓

💥HISTORY TO REPEAT ITSELF, BITCOIN TO PUMP TO $46,000Just as it happened on 8th February, 2021, Bitcoin price was not impressive until the information that Elon invested $1.5 billion broke out and pumped Bitcoin price from $39,200 to $47,000 that same day.
We also have that same scenario again. Price has broken out of the descending triangle and it's moving in an upward direction.
But price is currently testing a support trendline just like it happened on 8th February.
Therefore, we are in a delicate spot where I expect an information to pump Bitcoin price from $39,000 to $46000 anytime from now.
So watch out🔥 for Bitcoin news, Elon tweet or any other information on Bitcoin.
What do you think?
Share your opinion in the comment section✍️
Please support this idea with a LIKE👍 if you find it useful🥳
Follow me to receive more updates on this pair🤙
Comment any coin you need my analysis or forecast on📈📉
Happy Trading💰🥳🤗
Thank you for your support!💓

💥 BITCOIN LIKELY MOVE- TO PUMP TO $40K, $42K AND $43KWith respect to my previous post on BTCUSD, price broke it earlier than expected. We had a breakout from $37,000 yesterday and a pull back followed.
Right now, I expect a bullish movement to $40,000, $42,000 and $43,000.
What do you think?
Share your opinion in the comment section✍️
Please support this idea with a LIKE👍 if you find it useful🥳
Follow me to receive more updates on this pair🤙
Happy Trading💰🥳🤗
Trading Involves High Risk⚠️
Not Financial Advice💸
Use Proper Risk Management💹
Thank you for your support!💓

💥HISTORY TO REPEAT ITSELF, BTC TO RISE AGAIN 20th-22nd JUNEAs we can all see on this chart, this is replica of what happened early this year (January, 2021).
On 8th January, price found itself in a tight triangular zone and eventually left the zone 21 days after with a breakout and a retest which led us to $57,500.
History repeated itself again and price got into the same tight triangular zone on 19th May 2021 and it's still dwelling within the zone.
Therefore, I expect an upward breakout from the triangle and a pull back to confirm a good buy to $57,500 just as I happened on 29th January.
Therefore I expect Bitcoin to regain it's full rising strength within 20th-22nd June.
This idea is invalid if price breaks the support zone within $28,800-$30,000 downward to $26,000.
What do you think?
Share your opinion in the comment section✍️
Please support this idea with a LIKE👍 if you find it useful🥳
Follow me to receive more updates on this pair🤙
Happy Trading💰🥳🤗
Trading Involves High Risk⚠️
Not Financial Advice💸
Use Proper Risk Management💹
Thank you for your support!💓
NB: If you would like to have one-on-one interaction with me about analysis of coins or currency, DM me.

BTCUSDT . Important situation for BitcoinWe're about to see a new record by the king of currencies.
if daily candle closed upside the 59k resistance ,we should expect pumping price to a new ATH
63k to 68k
in first senario.
But in other one, if it doesn't break the resistance,
probably bitcoin is going to fall into 40k channel near 44k
Please stay sharp this week specially next 48 hours.
Keep in profit.
support me if you can
TW8XLT5fxpGMsohQyDRAMYVG9x3b58Avcn (trc-20)

BTCUSD - What to expect - Long to $60,000 or Short to $49,000As we can see, the market is in a downtrend. Price has been moving within the upper and the lower trendline. Price is currently at the resistance level.
Therefore, I expect a trendline upward breakout to $60,000. But if does not break the resistance line, I expect a pullback to $48,000.
The yellow lines are the major support and resistance level price may encounter when moving within it.
What do you think?
Share your opinion in the comment section✍️
Please support this idea with a LIKE👍 if you find it useful🥳
Also, kindly cheer me with coins if you like my work.
Follow me to receive more updates on this pair🤙
Happy Trading💰🥳🤗
Thank you for your support!💓
NB: If you have any question for me or you would like to learn forex trading, improve on your technical analysis skills, DM me.

BTCUSD LIKELY MOVE - PUMP TO $66,000, THEN DIP TO $52,000As we can see on this chart, price is moving within the trendines. Therefore, I expect price to go long to the possible resistance level at $66,000 and if it doesn't break it upward, I expect it to dip to $52,000.
The yellow lines are the major support and resistance levels.
What do you think?
Share your opinion in the comment section✍️
Please support this idea with a LIKE👍 if you find it useful🥳
Also, kindly cheer me with coins if you like my work.
Follow me to receive more updates on this pair🤙
Happy Trading💰🥳🤗
Trading Involves High Risk⚠️
Not Financial Advice💸
Use Proper Risk Management💹
Thank you for your support!💓
NB: If you have any question for me or you would like to learn forex trading, improve on your technical analysis skills, DM me.
Weird BreakoutLets see where that takes us, either to new highs either back to 35k or bottom of the range...

BTCUSD | New ATH coming in parabolic patternBitcoin and the aggregated crypto market are seeing growth as the stock market rallies. This comes shortly after Pfizer announced that their vaccine for the rapidly spreading virus has 90% effectiveness.
This is great news for the stock market in terms of reducing global uncertainty and boosting the economy, but it is bad news for safe haven assets like gold – which have nosedived.
Bitcoin is still steady in $15 000 - $16 000 region. Nevertheless, one of analysts believes a move past $16 000 is just a very beginning. You can see his Bitcoin price action forecast till the end of the November with a possible monthly displacement till December 2020.
He found Bitcoin price action will confirm parabolic pattern in case of finishing 3rd consolidation base on November 15th at the area above $15 700. This scenario can lead the price to a new ATH around $23 600 level in case of burst which occurs after parabolic pattern completion. You can see risk management and target levels for the analysis at the chart
Will Bitcoin reach a new ATH in the following months? It will be a miracle and a disaster at the same time. Last time Bitcoin grew enormously in parabolic pattern we had 2 years of depression at the cryptocurrency market. Anyway we cannot affect the market so let's just prepare a bag of pop corn and see how the situation develops!
DISCLAIMER
Do Your Own Research. The content is intended to be used and must be used for informational purposes only. It is very important to do your own analysis before making any investment based on your own personal circumstances.

BITCOIN NEW MOON CALLS SLIGHT PUMP AS ALWAYS!!!MOON ANALYSIS HAS NETTED MY ACCOUNT OVER A HALF MILLION DOLLARS IN THE PAST YEAR, LEARN YOUR SEASONS AND YOUR MOON/PLANET PHASES, I THOUGHT IT WAS HOCUS POCUS UNTIL THE PROOF KEPT PROVING TO ME I WAS THE MORON FOR NOT BELIEVING IN THIS TYPE OF ANALYSIS!

BTCUSD | Decisive moment - break resistance or further fall?Market players expected Bitcoin's price rise to the June's local high of $10 425 until yesterdays dump. From the early morning sellers increased pressure and from $9 800 the price went down until Fibonacci 23.6% retracement level where 4H EMA 55 was broken down which resulted in a sharp decrease to 38.2% Fibonacci retracement level of $9 016.
If prior price action was not pumped this level usually acts as a reversal point. The scenario of local support withstand was confirmed and BTCUSD bounced upward. Currently it consolidates to try breaking the resistance which should happen today. However there is no pressure and momentum power. Current price action seems like a "Dead cat bounce pattern", thus the decline may continue.
In the case resistance of $9 554 hold we risk to have another sharp decrease which could be stopped only when Bitcoin hits strong support level of $8 600. Which is drawn with a yellow line at the chart. As it can be seen this level was confirmed 5 times and should withstand again
Be safe and good luck in trades!
Best regards,
SkyRock Signals
