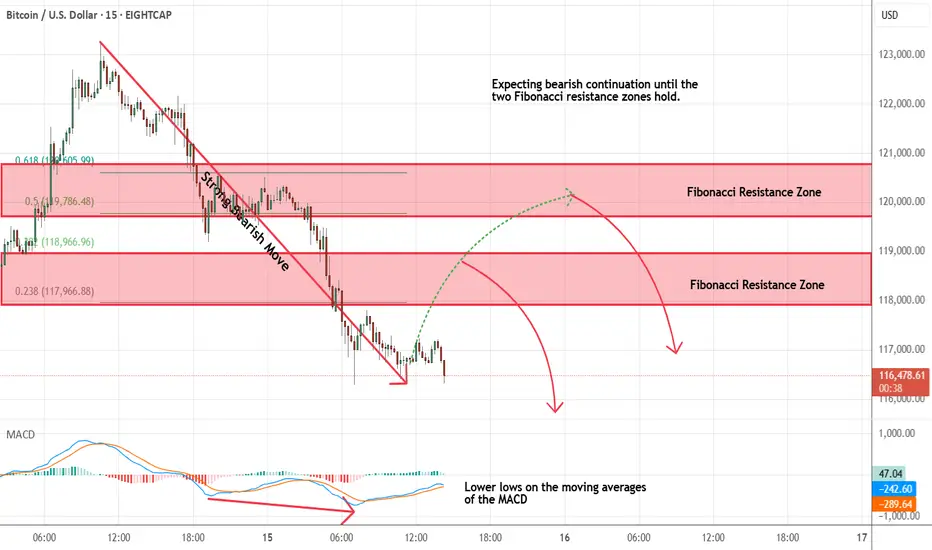
Bitcoin - Looking To Sell Pullbacks In The Short TermM15 - Strong bearish move.
Lower lows on the moving averages of the MACD.
No opposite signs.
Currently it looks like a pullback is happening.
Expecting bearish continuation until the two Fibonacci resistance zones hold.
If you enjoy this idea, don’t forget to LIKE 👍, FOLLOW ✅, SHARE 🙌, and COMMENT ✍! Drop your thoughts and charts below to keep the discussion going. Your support helps keep this content free and reach more people! 🚀
--------------------------------------------------------------------------------------------------------------------
Bitcoinsetup
BTCUSD Double Tap Into OB Before Massive Sell-Off! 2,000+ PipsHere’s why this could be one of the cleanest bearish setups of the week based on institutional flow and price action:
🚨 Step 1: Liquidity Engineering in Full Effect
We’ve got multiple areas where price was engineered to grab liquidity — clearly visible with those highlighted zones. Bitcoin pumped into a Strong High, tagging liquidity above a key trendline while respecting an internal parallel channel.
This move was not random. It was a textbook liquidity sweep.
🔁 Step 2: Order Block + 70.5% Fib Confluence
After the sweep, price retraced precisely into a bearish Order Block that overlaps perfectly with the 70.5% Fibonacci level — a hidden gem Smart Money loves to use for optimal entries. It’s the sniper zone.
This is where the first rejection came in, marking the start of bearish intent.
⚠️ Step 3: Break of Structure + Weak Low Exposed
As price dropped, it broke back under a weak low, confirming shift in market structure. This is your Change of Character (ChoCh) — the moment sellers regain control.
We’re now seeing retracement candles struggling to push above the OB/Fib zone. Rejection here confirms the setup.
🎯 Target Zones Breakdown:
✅ TP1 - Weak low around 110,200
✅ TP2 - -27% Extension (~109,500)
✅ TP3 - -62% Fib extension (109,268)
🚀 Extended Target - Possible sweep of Sell Side Liquidity all the way to 108,000–107,500
This is a potential 2000+ pip move if the full extension plays out.
🧠 Market Psychology in Play:
Institutions love to trap traders long after major breakouts. That last pump into the high? It wasn’t retail demand — it was liquidity generation. Now that they’ve swept the highs, they're driving price down to rebalance and mitigate.
Every highlighted zone on this chart? It’s a Smart Money footprint.
📌 Entry Game Plan:
Watch how price behaves around the current OB zone (111,250–111,618).
If price rejects and flips back under the midpoint (111,116), that’s your trigger.
Enter with tight SL above 111,750 and aim for TP1, TP2, and trail the rest to TP3 or lower.
📈 Risk Management Reminder:
Set your SL above structure.
Don’t overleverage — this is a clean setup, but patience is 🔑.
Let price come to you, not the other way around.
✍️ Final Thoughts:
This BTCUSD setup screams Smart Money — we’ve got:
Liquidity grabs ✅
Clean OB + Fib confluence ✅
ChoCh + structural rejection ✅
Strong R:R with multiple targets ✅
This might be the move to catch before the weekend liquidity sweep.
💬 Comment "BTC MOVE" if you’re watching this with me!
🔁 Tag your trading fam who needs to see this breakdown!

BTCUSD ChoCh + FVG Rejection = Drop Incoming🧠 Smart Money Concepts | BTCUSD 1H Breakdown
Here’s a crystal-clear Smart Money setup on Bitcoin that screams bearish intent. The wedge was a trap, the ChoCh confirmed the flip, and now price is reaching back into a Fair Value Gap that’s likely to reject hard.
Let’s dissect the setup:
🧱 1. Structure: Rising Wedge + ChoCh
Bitcoin climbed with a grinding structure inside a rising wedge — classic liquidity trap.
Smart Money lured in longs, then snapped structure (ChoCh) at ~102,700 — that’s your reversal confirmation.
📉 2. Fair Value Gap (FVG) Rejection Zone
After the ChoCh, price retraced into a juicy FVG zone around 103,219 – 103,913 —
right below a Strong High at 105,900. Inducement bait for breakout traders.
That’s premium pricing in a bearish environment = high-probability short.
🎯 3. Liquidity Target: Weak Low + Sell Side Sweep
Price is eyeing the Weak Low at 99,114, and below that sits the real magnet:
Sell Side Liquidity at ~98,800. That’s your ultimate draw.
📐 4. Trade Idea (R:R Approx. 3.5:1)
📍 Entry Zone: 103,200–103,900 (FVG zone)
❌ SL: Above Strong High @ 106,000
✅ TP1: Weak Low at 99,114
🏁 TP2: Sell Side Liquidity @ ~98,800
🧩 Confluences Checklist:
✅ Rising Wedge Trap
✅ ChoCh Confirmed
✅ FVG in Premium Zone
✅ Bearish Order Flow
✅ Weak Low + Sell Side as Target
⚠️ Caution:
Don’t short blindly. Wait for reaction in the FVG zone — ideally a rejection wick or lower timeframe BOS.
If price closes above the Strong High — setup is invalidated.
📊 Summary:
This BTCUSD setup is dripping with manipulation. Smart Money engineered a wedge, flipped structure, and is now likely to distribute before the next leg down.
Stay sharp. Trade with the big players, not against them.
💬 Type “🚨 BTC Short Alert” in the comments if you caught this setup too.
📉 Follow @ChartNinjas88 for more SMC alpha and sniper setups.
👀 Tag a fellow trader who thinks wedges always break upward 😂

"BTCUSD Smart Money Setup: Fair Value Gap + Weak Highs🚨 Bitcoin (BTCUSD) Smart Money Play Unfolding!
Let’s break down what’s happening on this 15-minute BTCUSD chart and why we could be gearing up for a powerful bullish reversal:
📍 Liquidity Sweep + Market Structure Shift
Price aggressively pushed into a weak low, grabbing liquidity from late sellers and stop orders. Smart Money behavior detected as price forms a potential Change of Character (ChoCH) at a discount zone.
This shift signals a transition from bearish pressure to potential bullish intent.
📍 Fair Value Gap (FVG) as Re-entry Zone
We’ve marked a clean Fair Value Gap (pink box) just below current price action, aligning with the 78–79% retracement zone. Smart Money loves these inefficiencies — they act as magnets for price to rebalance before strong directional moves.
🟣 This FVG is your 1st key zone for entries. If price respects this, we could see an explosive move toward the buy-side liquidity.
📍 Confluence: Fibonacci + Imbalance
Notice how this FVG perfectly aligns with the Fibonacci Golden Zone (70.50–79.00%). This adds extra confluence that this area could act as a powerful springboard for long positions.
📍 Buy-Side Liquidity & Weak Highs Targeted
Above current price lies a Buy Side Liquidity pool and a marked Weak High, signaling that Smart Money may be targeting these inefficiencies next.
🎯 These are the obvious targets if price reacts from the FVG:
First TP at 104,680
Second TP at 104,887
Optional continuation beyond if price grabs liquidity and breaks structure
📊 Risk-to-Reward (R:R) Play
Entry near FVG with stop just below the Strong Low offers an attractive R:R setup. Targeting the weak high gives a multi-R potential.
🟢 High probability setup if price shows bullish reaction (engulfing, BOS) in the FVG zone.
🧠 Smart Money Logic:
Manipulation ✅
Imbalance/FVG ✅
Liquidity Grab ✅
Structure Shift ✅
Clean Targeting of Buy Side Liquidity ✅
This is a textbook SMC long setup in development.
⚡ Game Plan:
Wait for confirmation in the FVG zone (e.g., bullish engulfing or BOS on lower TF).
Set longs with tight stop below 103,535 (Strong Low).
Secure partials at first TP and trail for extended target.
🚨 Risk Management Reminder:
Stick to your trading plan.
Let price come to you.
Never risk more than you can afford to lose.
✍️ In summary:
BTC is sitting at a beautiful discount level with a clear inefficiency to fill. If Smart Money reacts here, we’re looking at a smooth climb into higher liquidity zones. This could be the cleanest setup of the day — if you know how to play it right.
💬 Comment “BTC READY” if you’re planning to enter this setup!
👥 Tag a crypto buddy who needs to see this!

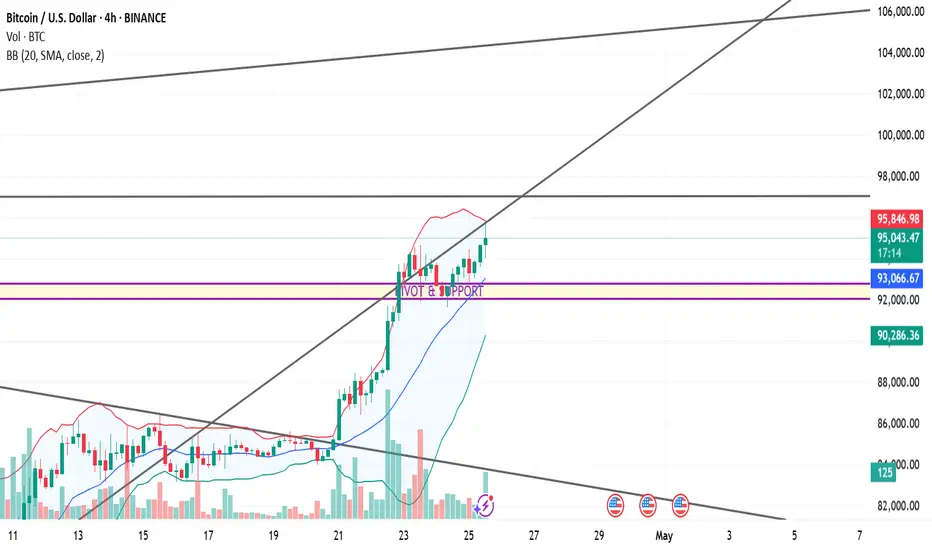
Bitcoin Technicals & FundamentalsBitcoin/US Dollar (BTC/USD)
Price Action Observations:
Trend: Strong bullish trend — price is above the middle Bollinger Band and riding the upper band.
Current Price: ~$95,410 (as of the chart time).
Immediate resistance near the upper Bollinger Band (~$95,921).
A major horizontal resistance is at around $98,000 (thick black line).
Local pivot/support zone marked around $92,400 – $93,100 (purple horizontal lines).
20-SMA (middle BB) acts as dynamic support (~$93,085).
Stronger support around $90,200 (lower BB).
Volume increasing on the bullish candles after the breakout around the 21st-22nd April.
Higher volume on green candles suggests genuine buying interest — not just a low-volume rally.
Bollinger Bands: Bands are expanding — classic signal for a volatile move.
Price is walking the upper band → continuation pattern as long as price doesn't break below the 20-SMA.
Trendlines: Ascending trendline beneath the current price → confirming higher lows.
There is a larger upper channel line sloping upwards targeting ~$105,000–$106,000.
Bias: Strong Bullish
Above 92,400–93,100 pivot zone = bullish structure maintained.
Immediate target: $98,000
Stretch target: $100,000 - $105,000 (upper channel resistance)
Invalidation: If price closes below ~$92,000 (break below pivot + mid-BB).
Fundamental Analysis (as of April 25, 2025):
If US Dollar (DXY) is weakening, it favors Bitcoin.
Fed policies — if there’s talk of rate cuts or holding rates steady, Bitcoin rallies.
Halving hype: Bitcoin halving happened earlier in 2024. Historically, it leads to a delayed but strong rally about 12-18 months later — we are now entering that "parabolic" zone.
ETF Inflows: BTC ETFs launched earlier have been drawing huge institutional interest.
Supply Shock: Fewer Bitcoins available on exchanges post-halving = price pressure upwards.
Global uncertainty (recession fears, wars, bank failures) = safe-haven demand for BTC.
Bitcoin being seen as "digital gold" strengthens its position.
My Final View:
Bitcoin remains in a strong bullish structure technically and fundamentally.
As long as it holds above ~$92,000–$93,000 zone, expect moves toward $98,000–$100,000+. A deeper retrace to $90,200 could still maintain the bull trend, but below that would signal weakness.
#BTCUSDT shows signs of reversal📉 SHORT BYBIT:BTCUSDT.P from $82,125.0
🛡 Stop loss: $82,976.0
🕒 Timeframe: 4H
✅ Overview:
➡️ The BYBIT:BTCUSDT.P chart shows a rising wedge — a typical bearish pattern.
➡️ Price hit the upper wedge boundary and started to decline, breaking support.
➡️ A second top (Top 2) has formed on weakening volume, signaling a possible reversal.
➡️ The POC at $82,490.8 has been broken — price is holding below it, strengthening the bearish case.
🎯 TP Targets:
💎 TP 1: $81,430.0
💎 TP 2: $80,887.0
💎 TP 3: $80,485.0
📢 Additional scenario notes:
📢 Entry activates upon breakdown and consolidation below $82,125.
📢 Watch for increased volume at key TP levels for confirmation.
📢 A move above $82,976.0 invalidates the setup — stop placed just above key resistance and wedge top.
🚀 BYBIT:BTCUSDT.P shows signs of reversal — a corrective move to the downside is expected.

XLMUSDT - JUST ANOTHER IDEA OKAY!Crypto trends been down for awhile after all those uptrend euphoria failed badly..
The more you see those influencers on youtube hyping some coins, of course it crashed at some points, after all that is what those big power institutes wanted to suck all the money inflow, and especially they killed off people who wanna get rich quick who went for high leverage trades.. even with just 2X you will get liquidized with 50% drop for altcoins..
So enough said, if another crash is expected, probably it s going to be the bottom,.. so we can expect great recovery.. I am not an expert, but as XLM being down beautifully as it seems like a flag pattern, so we can expect rebound for XLM some where @0.191.. and expecting higher-high at bigger time frame..
How high? for now no body knows..
So, trade wisely and don't forget your stoploss..
Have a nice day & Happy trading guys!~

BTC/USD "Bitcoin vs US Dollar" Crypto Market Heist Plan🌟Hi! Hola! Ola! Bonjour! Hallo!🌟
Dear Money Makers & Robbers, 🤑💰🐱👤
Based on 🔥Thief Trading style technical and fundamental analysis🔥, here is our master plan to heist the BTC/USD "Bitcoin vs US Dollar" Crypto market. Please adhere to the strategy I've outlined in the chart, which emphasizes long entry and short entry. 🏆💸Be wealthy and safe trade.💪🏆🎉
Entry 📈 :
"The loot's within reach! Wait for the breakout, then grab your share - whether you're a Bullish thief or a Bearish bandit!"
Buy entry above 101,000
Sell Entry below 93,000
Stop Loss 🛑:
Thief SL placed at 96,000 (swing Trade) for Bullish Trade
Thief SL placed at 99,000 (swing Trade) for Bearish Trade
Using the 3H period, the recent / nearest low or high level.
SL is based on your risk of the trade, lot size and how many multiple orders you have to take.
Target 🎯:
-Bullish Robbers TP 112,000 (or) Escape Before the Target
-Bearish Robbers TP 84,000 (or) Escape Before the Target
📰🗞️Fundamental, Macro, COT, Sentimental Outlook:
BTC/USD "Bitcoin vs US Dollar" Crypto market is currently experiencing a Neutral trend (there is a higher chance for Bullish)., driven by several key factors.
🔱 Fundamental Analysis
Bitcoin's price has been holding above $104,000 after bouncing off its 50-day Exponential Moving Average earlier this week. A K33 Research explains how Nvidia's big drop in stock valuation this week, driven by DeepSeek, affected Bitcoin's price
🔱 Macro Economics
The US Federal Reserve's decision to stimulate the economy by printing money could draw more investors to borrow, triggering the start of another rally in stocks and crypto markets. Additionally, Brazil and other South American countries are expected to implement crypto-friendly regulations, making them a safe haven for the growth of the crypto industries
🔱 COT Report
The latest COT report shows that non-commercials (speculators) are net long, indicating a bullish sentiment. However, commercials (hedgers) are net short, indicating a bearish sentiment.
🔱 Sentimental Market
Retail traders are net long 60% of their positions, indicating a bullish sentiment. Institutional traders are also net long, indicating a bullish sentiment
🔱 Market Sentiment:
Long Positions: 78% of client accounts are long on this market
Short Positions: 22% of client accounts are short on this market
🔱 Positioning
Institutional traders are holding long positions in BTC/USD, with an average position size of $1.2 million. Retail traders are also holding long positions, with an average position size of $12,000.
🔱 Overall Outlook
BTC/USD is expected to trend bullish in the short term, driven by the bullish sentiment among retail and institutional traders. However, the pair may experience a short-term correction due to the bearish sentiment among commercials.
⚠️Trading Alert : News Releases and Position Management 📰 🗞️ 🚫🚏
As a reminder, news releases can have a significant impact on market prices and volatility. To minimize potential losses and protect your running positions,
we recommend the following:
Avoid taking new trades during news releases
Use trailing stop-loss orders to protect your running positions and lock in profits
📌Please note that this is a general analysis and not personalized investment advice. It's essential to consider your own risk tolerance and market analysis before making any investment decisions.
📌Keep in mind that these factors can change rapidly, and it's essential to stay up-to-date with market developments and adjust your analysis accordingly.
💖Supporting our robbery plan will enable us to effortlessly make and steal money 💰💵 Tell your friends, Colleagues and family to follow, like, and share. Boost the strength of our robbery team. Every day in this market make money with ease by using the Thief Trading Style.🏆💪🤝❤️🎉🚀
I'll see you soon with another heist plan, so stay tuned 🤑🐱👤🤗🤩

BTCUSD / Bitcoin Trade IdeaAfter reaching the target I'm looking to new setup. Currently I'm looking to position myself in short till we reach point A.
A) I want to see rejection of that level with bullish closure of higher timeframes = Long
B) I'll trail short a bit more in this case and look to long in point B with same criteria.
BUT I'll be more conservative and not have big expectations to reach higher prices labeled on chart (red line on top). That level is likely for scenario A in my perspective for now as I don't want to hold a position too long on those levels.

BTCUSD / Bitcoin Trade IdeaBitcoin looking decent for a bit more push to the upside. Here's my thoughts and plan.
I like this momentum so ideal scenario A) is we have a minor pullback ideally into $65.000 area and push from there. M15 - H1 candle showing strong bullish intention is a must here.
Scenario B) is something I will be more cautious based on HTF narrative. Will look for buy as a scalp and if BTC rejects from this level I'll consider taking a trade for higher prices.
There is also C scenario that I consider to short this pullback but this might be quick so I won't cover it in this idea but I'm looking for this intra day setup as well.

Bitcoin - Looking To Sell Pullbacks In The Short TermH1 - Bearish trend pattern
Currently it looks like a pullback is happening.
Until the two strong resistance zones hold I expect the price to move lower further after
pullbacks.

Bitcoin 4hr Setup Bitcoin is currently experiencing a pullback, having dropped 2,000 pips over the past seven days. Several key factors are converging around the $60,000 level, making it a critical area of interest. These factors include the psychological round number of $60,000, previous market structure, the 0.5 Fibonacci retracement level, and the presence of both an upward and a downward trend line intersecting near this price. Additionally, there's a notable rejection point in this vicinity. Given these confluences, I anticipate a reaction around this level, potentially leading to further downward movement.
Bitcoin Daily Chart
Bitcoin is showing several confluences on the daily chart around the $60,000 level. After a 1,000-pip rally without any significant pullback, a retracement seems likely, as the price may need to dip before resuming its upward momentum. This time, I anticipate that Bitcoin might close below the 200-day moving average during the pullback. However, once it completes this downward move, I expect the price to eventually close above the 200-day moving average and begin a climb toward the top of the current channel.

Bitcoin Daily Chart Bitcoin is currently experiencing a pullback after a bullish run lasting nine days. The next strong support zone is between $61,379 and $60,298. I anticipate Bitcoin will fall to this point of interest (POI), where we should see a reaction. There are multiple confluences suggesting a long setup, one of which is Bitcoin trading above the 200-day EMA, an important indicator of strength.

Retesting the top the 7th time.COINBASE:BTCUSD
Currently on the way to touch and retest the too resistance the 7ths time. Once breakout, the next target will be $70,000. If fail to breakout it will likely travell back down to the support.

BTC 2024 BULL RUN SPECULATIONI am expecting something like this to play out (ceteris paribus). Pure speculation however the data is based on previous cycles. Expected blow off top between $140 - $160k with a potential bear market bottom in late 2025 at between approx. $30 - $40k. Further accumulated between the range then ready for a next cycle in 2027-28

BTC Chart Idea - Swing Long SetupBTC creating a huge bullish pennant on daily timeframe. Already touched support and resistance 3 times. If it breaks $72K, the swing TP should be $102K.
Entry - Once it breaks $72K on daily timeframe and confirm
TP - $102K
SL - Daily candle close below $70K

BTC Update - 10.02.2024 / Long confirmed4 hour chart:
The market over the weekend is not happy with the moves, let's look at the bitcoin chart and targets for the next couple weeks.
After price got an upside exit from accumulation, which I wrote about in the previous breakdown, got an impulsive move up coming into accumulation from above and the bts zone, leaving liquidity at the top to deliver price behind the local and key high.
I don't see the point of shorting against such an aggressive move, so I am looking at a couple POIs to consider futures long positions.
1. 4 hour imbalance + ind (I am considering a nascent long on ltf, after which I will consider).
2. 4 hour breaker imbalance (I will look for confirmation on higher timeframes, because if we mitigrate this zone of buyer interest, the structure on ltf was broken to short).
In any case, I advise you to put a small % of your deposit in positions on the weekend, as the chances of manipulation are extremely high!
Not financial advice, always think with your head! ❗

Bitcoin Weekly TFBitcoin has maintained a bullish trend for 84 consecutive days, displaying an 80% increase. Anticipate a response in the range of 46650 - 47350, followed by an expected pullback of approximately 30%. Various indicators, including the descending trendline, ascending trendline, reversal point, overbought conditions on RSI, and structural considerations, suggest that this correction may occur during any session by the end of next week.

BTC a quick lookBTC / USDT
Bitcoin is in the range between 28k - 25k in boring period ( 2 months)
4H TF Chart analysis:
Price dropped after making deviation above the range high and now is approaching very important demand zone
Between 26400-26000, BTC have high chance to bounce
But if it fails to bounce then ready for bears to take us at least below 25k in short term
In long term :
bulls must save 25k in high time frame (weekly) otherwise we will see significant drop in next months (if happen i believe it will be the final drop)
More detailed analysis on long term in next update..don’t forget to support us by your likes(rockets) and comments
Best of wishes

BITCOIN GREEN LIGHTFranklin Templeton, a global asset manager with $15 trillion under management, receives SEC approval for its spot Bitcoin ETF application.
The SEC postpones decisions on ether exchange-traded fund applications from VanEck and ARK, with a final verdict expected by late May 2024.
In a significant move, the U.S. Securities and Exchange Commission (SEC) has given its nod to the spot Bitcoin ETF application from Franklin Templeton, a leading global asset manager overseeing $15 trillion. This acknowledgment is a pivotal moment in the crypto industry, especially given Franklin Templeton’s immense influence in the asset management domain.

BTCUSDT - 17/09/2023The weekend for BTC is essentially a trap. People get bored, they get into trades, place their stop losses at the recent high/low and eventually get stopped out, most of the times on both sides, long and short.
A variant of the TR Pocket Fib consists of drawing it from the Saturday's high to its low, referring to UTC+0 timezone and after that I will then look at current market conditions to determine which entries are most likely to happen.
This Sunday I believe we can actually get a trade from all 4 levels or 2 at least because I think it's most probable for us to come to one of the lower levels to get liquidity and then go to the higher ones, possibly 27000 which has a Single Print or to 27190 which is a TPO POC. However, when and if we go to one of those higher levels, it is also very probable to come down to 23568 which has another Single Print right on top of a super ancient Breaker Block. This trap move usually happens around Sunday 16 to 19pm UTC+0.
So I think the most probable move would be to reach a lower level of the TR Pocket, bounce from there and then reject from 27000 (Single print), 27190 (TPO POC) or 27392 (Liquidation level).
However, if we go to one of the levels above first, it would then be probably best to cancel the longs since we have a considerable liquidity curve to grab and also a big vector to recover below us.
How I personally trade this is to enter on each of the levels, take TP1 at the 0.5 of the TR Pocket Fib, move the stop to breakeven and then try to let the rest ride because this can be the trade that lasts for 3 or 4 days until we get the Mid-Week-Reversal.
Also, although my bias is for more downside, we have to consider we are in a macro daily range, ever since we SFP'd 24778 (MEXC Value) so any of these long entries might be what takes BTC up if we are to do a full range rotation eventually.

Btc - bullish tossed upwardif you like the idea, please "Like" it. This is the best "Thanks!" for the author 😊 P.S. Always do your own analysis before a trade. Put a stop loss. Fix profits in installments. Withdraw profits in fiat and please yourself and your friends.

Bitcoin Could Go Higher After A Liq Grab Bitcoin made a higher high and a higher low in the past days, showing bullish sign.with this rising wedge at hand we have to see if its valid or not.
Thanks for watching
