Is BTC Set up for a fall today? (17/04/2025)BTC has been ranging since last Friday and therefore the price action has been very tight but one candle has given us a clue about the possible next direction.
This has been highlighted by the red arrow. This 2H candle is a bearish engulfing candle, which as a single candle is bearish.
Since that candle was printed, the price has currently retraced into that candles range but has failed to break over it.
I am speculating that this is a failed high.
The blue arrow points to a wick on a subsequent 2H candle which signifies bullish exhaustion and a rejection of that 85000 price level.
The Green lines represent the High and Low price of the most recent 7H candle.
The Orange lines represents the High and Low price of yesterday's Daily candle.
The Red line represents the High and Low price of last week's candle.
There is a purple target beside a 2h FVG that I believe that market could be targeting alongside last weeks low.
Bitcoinshort

BITCOIN Supply Demand Short ALERT1) See picture for full analysis...
Higher Timframe:
-Price inside supply
-Trend = downtrend
-Stochastic RSI overbought
Lower Timeframe:
-Need break to break support + break upward trend-line + quality supply created.
- IF price does the following then possible pullback for short OR look for scalp/day-trade shorts
to the downside with 1TF setups.
#supplyanddemand #supportandresistance

Bitcoin BEARISH - BTC Strong Resistance On Weekly TFBitcoin has reached strong resistance on the weekly TF. The resistance line goes the whole way back to 2017. So it's very reliable. A strong move downwards is very likely!
Based on previous times this line was tested, Bitcoin could fall 50% or more. However, the 74000-75000 level looks like a good support level. This would be about a 30% drop which is still very significant.
I expect profit taking very soon and short sellers to come in. There could possibly even be global headline news to cause this drop.
Be very careful in buying near the tops. Trade with your brain and not emotions. This is only an idea and anything can happen, but it's a weekly chart and seems very reliable.

USDT Dominance Good for Bitcoin price actionHello everyone!
I want share my price analysis at USDT Dominance.
The reason i am making Bitcoin price action analysis at USDT Dominance is here chart is more clear and gives me better view of what is happening at market.
After Trump inauguration day most of retail traders excepted bullish bitcoin, but we saw strong sellers, that means bitcoin will find new strong buyer and it will reach new high then, but i think the new high will be maybe 2026 or 2027. if we will look at USDTD we will see the price action is still uptrend, but not too strong it tested well support after 1D double bottom and went higher.
my price prediction will be it will test 6.75 were it will get huge reaction, but the price will come back second time and we need to wait for that moment, if we will get same price reaction, it will be start of bullish bitcoin, at the moment i think bitcoin will be at 55000 or 60000, but if USDTD will brake 6.75 then we need to wait Bitcoin at 40000-45000.
We will see what will happen that's only my opinion it will happen.
Always make your own research

BITCOIN Outlook: Watch for a Drop Toward $85100COINBASE:BTCUSD has reached a key resistance level, an area that has been a key point of interest where sellers have regained control, leading to notable reversals in the past. Given this, there is potential for a bearish reaction if price action confirms rejection, such as a bearish engulfing candle, long upper wicks or increased selling volume.
If the resistance level holds, I anticipate a downward move toward 85,100$, which represents a logical target based on previous price behavior and market structure.
However, if the price breaks above this zone and sustains above it, the bearish outlook may be invalidated, leading to further upside.
Just my take on support and resistance zones, not financial advice. Always confirm your setups and trade with solid risk management.

Bitcoin Part1: bearish Trade Short termBitcoin Macro Index' bear signal puts $110K BTC price return in doubt
Fact is: Bitcoin and ether drop amid grim inflation outlook, tariff uncertainty midterm to long term, as long the white house continues its policy.And PRES: trump cannot prevent it.
A positive change of the white house policy, and improving its relationshipsto other nations,instead putting them with tariffs, will be a boosting positive cataylst also for crypto,specially Bitcoin. Bitcoin has lost in trust of new investors ,specially since 21st of January 2025.
Also participating of Pres. trump in crypto summits had no positive significant signals ,specilly not for Bitcoin.Instead Bitcoin lost now more than 34% since Nov. 2025.
Also many crypto fans are very disappointed about developement of their crypto performances.
Promise gave,Promise ,,NOT,,kept!
It wIll be a very volatile time ahead.
Therefor I prepare for both scenarios:Bullish/Bearish short term.
This is part 1:bEARISH STRATEGY:
Below 78k...bearish momentum will gain more on momentum.

BTC ~ MACRO Bounce ZoneBTC has been holding the 80K zone well, but from the macro perspective the bearish cycle should be starting soon.
This is due to simple logic (after such a dramatic ATH) as well as the Wyckoff Method.
Unless we can reclaim 90K, it's likely that this will be the third touch on the parabolic curve - which is usually when the bearish cycle starts.
Previously, BTC retraced and bounced one Fib higher than the price at the start of the bullish cycle. This puts us roughly at 28k, as well as at the neckline of the previous resistance zone before the new ATH:
______________
BINANCE:BTCUSDT

Bitcoin ($BTC) - Hoping for a Short-Term RolloverBitcoin bounced from the daily demand (76874.75-74306.67) that was highlighted in my "Bitcoin Uptrend Continuation" post from 5 days ago (see related post below). However, the rubber will now meet the road as BITSTAMP:BTCUSD could break higher or continue lower from current price. The in-play 1D sell zone, which is admittedly doesn't have great structure, is 86267.86-92920.42. Ideally, short-term CRYPTOCAP:BTC momentum, per the RSI, would be weaker than it is, but momentum is still soft per the daily oscillator. I'm not looking to short BTC blindly, but rather am stalking it via LTFs and will execute a confirmation short if evidence of the near-term uptrend (established 3/10) violation/termination materializes. If the intermediate-term downtrend continues, T2 = sub-$70K.
Anyway, just an idea. For those looking for longer-term buying opportunities, a near-term selloff should be viewed as a positive. Futures open in ~5 hours and can always be used to hedge longs if we get a breakdown.
Thanks for reading. Thoughts/feedback appreciated!
Jon
@JHartCharts

BTCUSDT - Forecast for Today!My general opinion is that we will go back and forth in the intermediate zones until interest rate decision is announced and I'm bearish for now due to CDV. I have indicated the possible manipulations in these intermediate zones in the drawings on the chart.
Starting from the 4-hour point of control zone(indicated in the chart), I will start looking for short trends downwards and as usual, I will enter with confirmations in the low time frame.
I have a long list of my proven technique below:
🤖 IQUSDT: Smart Plan
🟠 IDEXUSDT: Spot Buy Area | %26 Profit if You Trade with MSB
📌 USUALUSDT: Buyers Are Active + %70 Profit in Total
🌟 FORTHUSDT: Sniper Entry +%26 Reaction
🐳 QKCUSDT: Sniper Entry +%57 Reaction

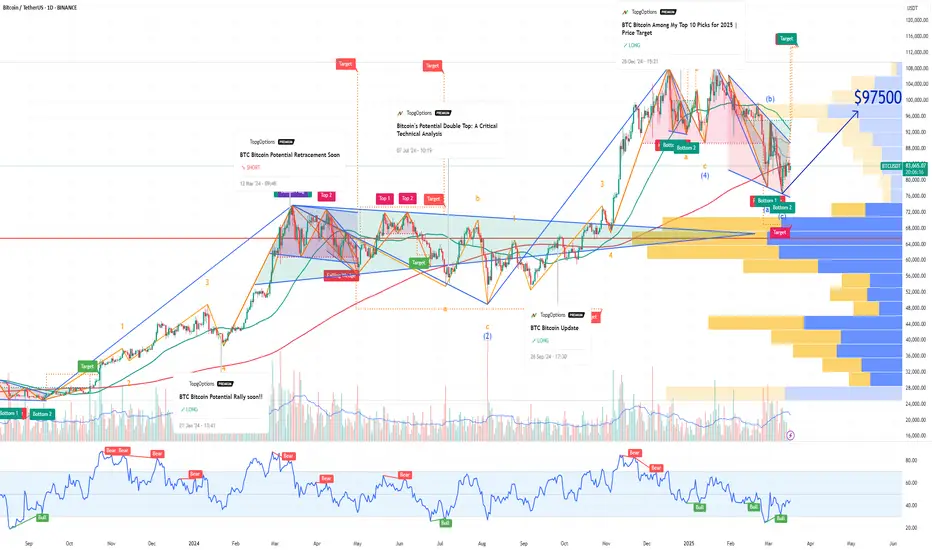
BTC Bitcoin Technical Rebound Despite Whale Short Position !If you haven`t sold this recent top on BTC:
Now Bitcoin (BTC) has recently pulled back, but signs are emerging that a technical rebound could be imminent.
A large crypto investor, or whale, has reportedly opened a 40x leveraged short position for over 4,442 BTC (valued at over $368 million), effectively betting on a near-term price drop. However, this appears to be more of a short-term, low-volume trade rather than a sustained bearish position.
Given the high leverage involved, the whale will likely seek to close the position soon with a modest profit rather than holding it as a long-term directional bet. Weekend trading volumes tend to be lower, which could contribute to short-term price weakness — but once the position is closed, buying pressure could return, fueling a recovery.
From a technical perspective, Bitcoin is currently near key support levels, with momentum indicators like the RSI signaling oversold conditions. Historically, similar setups have led to sharp rebounds as short covering and renewed bullish sentiment drive prices higher.
My price target for Bitcoin is $97,500 by the end of the year, which would represent a recovery of approximately 15-20% from current levels. If the whale closes the short position and broader market sentiment stabilizes, Bitcoin could quickly regain upward momentum toward this target.
BTC FOR SCALPERS AND DAY TRADERS *9400 POINTS **Guys pls like, share and follow my ideas
Entry price ,stoploss and Target already marked in the chart itself FYI.
Thank You All
ZIGZAG STRATEGY SIGNAL
GREEN ARROW INDICATES BUY
RED ARROW INDICATES SELL
STOP LOSS DONT RISK MORE THAN 2%
OF YOUR CAPITAL
BUY TARGET POINT 2900
SELL TARGET POINT 6500

BTCUSD, Are we going to face 35% Correction ?! (Local View)BTCUSD, Are we going to face 35% Correction ?! (Local View)
Let's take a look at local movements on INDEX:BTCUSD .
Since last post Bitcoin moved in our favor, reached 38,500$.
We have a strong bounce here, which is heading towards upper 40s as long as daily close was above big red candle.
There is a probability, that Bitcoin is going to draw lower high which can be anywhere from 38.2 to 61.8 (Golden Pocket) Fib. In confluence we have several magnets at this range.
Possible stop losses around 43,500$
Fair Value Gap around 44,500$. Possible liquidations Across top 3 exchanges (Binance, OKX, Bybit) totaling around 4.0 Bln. USD. (This number covers last 30 Days Data)
Hence we should take into consideration, that huge amount of liquidity is sitting down in the previous reaccumulation zone. (Suggesting to check out Liquidity Heatmap . Putting link because I am not able to add screenshot.)
- - - - - - - - -
Next I want to mention one weird thread I bumped into on Twitter.
It’s about HTX (ex Huobi), which is owned by Justin Sun. They turned off their proof-of-reserves system, what hints about their insolvency. Onchain analysis say that they have problems with ETH holdings.
Also this is not connected to only HTX, things are being wrong with TUSD and stUSDT (Stacked USDT receipt on TRON Network).
For further details about this event please read thread from adamscochran on twitter . Hence there was around 600 Mln. USDT transfer to JustlandDao yesterday.
In the end, I want to mention, that there is no 100% accurate analysis.
We are dealing with probabilities, just with analysis we are shifting probabilities to our favor.
Best Wishes.

Bitcoin major downside still to $47,987 - But 200MA holding!Bitcoin has been very unstable this year, probably due to the new Administration.
MIGHT be due to the influx of regulations or government transactions.
MIGHT be due to Demand and Supply changes.
MIGHT be due to the volatility between countries.
Regulatory Worries 🏛:
Fears about stricter rules and crackdowns are making investors jittery.
Profit-Taking 💰:
Some holders are cashing out their gains, which puts downward pressure on prices.
Market Volatility 🎢:
Wild swings in crypto and broader markets are unsettling buyers and sellers.
Tech Troubles & Security Concerns 🔒:
Hiccups with blockchain tech and news of hacks can trigger sell-offs.
Crypto Market Slump 📉:
A broader downturn in the crypto space is dragging Bitcoin's value down.
TECHNICALS:
M Formation as I showed last time and this is the update.
Price<20 but >200MA - This is a CONCERN for the analysis because the 200MA is the Mother of all Moving Averages that Millions of crypto traders and enthusiasts look at.
Target $47,987
Disclosure: I am part of Trade Nation's Influencer program and receive a monthly fee for using their TradingView charts in my analysis.

Bitcoin - The Path to a Quarter of a Million Bitcoin - What Happened After the End of the Bear Market
15,460 USD—this value marked the ultimate low of the bear market in hindsight. My previous forecast for a bottom formation was exceeded by approximately 15%. This was not due to a lack of expertise but rather because I rarely publish ideas. Looking back, the levels around 18,000 USD were an excellent opportunity for long-term entry and position accumulation. Since then, Bitcoin has surged by an impressive 350% (as of today).
Market Development After the Bear Market
Today, I will not delve into Bitcoin’s fundamental situation. First, because it has reached a level of complexity that is difficult to fully grasp, and second, because fundamentals are almost irrelevant to my technical analysis and forecasts.
The current price action suggests that we are nearing the completion of Wave 1, which serves as the launchpad for the larger Wave 3. It is important to note that the previous all-time high of 109,358.01 USD may be surpassed if the 161.8% Fibonacci retracement level is slightly above it. This means that, despite an initial sell-off, Bitcoin could still reach a maximum of 115,438.15 USD before a major correction begins.
However, if the previous all-time high already marked the end of Wave 1, then the price should retrace towards the 78.6% or even the 88.7% Fibonacci levels. Yes, this results in a broad range, but the goal is not to place a short trade—only to time a long trade effectively.
One thing is crystal clear: The next correction is imminent—or has already begun.
Outlook: Where Is the Next Profitable Long-Term Entry?
The art of investing lies in playing the long game and timing the market for optimal long positions. While dollar-cost averaging (DCA) is a solid strategy, it is particularly beneficial to invest larger tranches with careful planning.
Since my strategy is to hold Bitcoin for decades, I am looking for the next major buying opportunity.
Based on current market trends, I see two overlapping target zones for the upcoming correction:
🔹 Potential correction range: 35,774.30 - 58,928.75 USD
🔹 Key Fibonacci retracement level (61.8%) of Wave 1: 51,502.15 USD
I expect Bitcoin to correct at least to 51,502.15 USD. However, based on previous corrections and price structures, a deeper retracement is highly likely.
💡 My personal target zone for accumulating larger positions:
👉 35,774.30 - 51,502.15 USD
🚨 Bitcoin must not drop below 34,944.64 USD.
After the Correction: The Next Major Bullish Wave
Once the correction (Wave 2) finds its bottom between 34,944.64 - 51,502.15 USD, the market will be set for the explosive third wave of the larger Wave 3.
📈 Minimum price target for Wave 3: 160,000+ USD
📈 Further upside potential: Beyond 250,000 USD
Key Takeaway: Investing in Bitcoin is an investment in your future.
👉 Think long-term and minimize your risk.
Summary
1. Bear Market Recap
✅ Bear market bottom: 15,460 USD
✅ Forecast missed by ~15%
✅ 18,000 USD was a great long-term entry
✅ +350% price increase since then
2. Current Market Situation & Forecast
✅ Bitcoin is near the completion of Wave 1
✅ Possible breakout beyond all-time high (109,358.01 USD) to 115,438.15 USD
✅ A major correction is imminent—or has already begun
3. Ideal Long-Term Entry Points
✅ Target accumulation zone: 35,774.30 - 51,502.15 USD
✅ Expected correction at least to: 51,502.15 USD
✅ Absolute lower limit: 34,944.64 USD (must not be breached)
4. Long-Term Outlook
✅ Wave 3 to start after correction (Wave 2)
✅ Minimum target: 160,000 USD
✅ Potential long-term target: 250,000+ USD
✅ Investment strategy: Hold long-term & minimize risk

Bitcoin bearish move to 81/80K ?There is a potential incoming bearish move on the 4 hour chart
Stop loss: 87500
Take profit : Around 81k

BITCOIN MAIN SHORT AREA – BE CAREFUL!🚨 BITCOIN MAIN SHORT AREA – BE CAREFUL! 🚨
“This isn’t just any level—this is the main short zone. Smart traders don’t rush; we wait for clear confirmations and strike with precision!”
🔥 Key Game Plan:
15M Downside Breakouts Required – We’re watching for clear market structure shifts before entering.
CDV Must Confirm – No CDV support for the short? No trade. We need sellers stepping in with conviction.
Stop Loss at $99,500 – Risk management is key. No guessing, no emotions.
Sniper Entry? $98,000 is a Solid Level – If we get there with confirmation, it could be an elite short.
💡 Final Thoughts:
“Patience is what separates pros from amateurs. If we get the breakdown + CDV confirmation, this trade could be beautiful. If not, we step aside and wait for the next A+ setup.”
📉 Stay sharp, execute with confidence! 🔥
Let me tell you, this is something special. These insights, these setups—they’re not just good; they’re game-changers. I've spent years refining my approach, and the results speak for themselves. People are always asking, "How do you spot these opportunities?" It’s simple: experience, clarity, and a focus on high-probability moves.
Want to know how I use heatmaps, cumulative volume delta, and volume footprint techniques to find demand zones with precision? I’m happy to share—just send me a message. No cost, no catch. I believe in helping people make smarter decisions.
Here are some of my recent analyses. Each one highlights key opportunities:
🚀 RENDERUSDT: Strategic Support Zones at the Blue Boxes +%45 Reaction
🎯 PUNDIXUSDT: Huge Opportunity | 250% Volume Spike - %60 Reaction Sniper Entry
🌐 CryptoMarkets TOTAL2: Support Zone
🚀 GMTUSDT: %35 FAST REJECTION FROM THE RED BOX
🎯 DEXEUSDT %180 Reaction with %9 Stop
🐶 DOGEUSDT.P: Next Move
💎 ETHUSDT.P: Where to Retrace
🟢 BNBUSDT.P: Potential Surge
📊 BTC Dominance: Reaction Zone
🌊 WAVESUSDT.P: Demand Zone Potential
🟣 UNIUSDT.P: Long-Term Trade
🔵 XRPUSDT.P: Entry Zones
🔗 LINKUSDT.P: Follow The River
📈 BTCUSDT.P: Two Key Demand Zones
🟩 POLUSDT: Bullish Momentum
🌟 PENDLEUSDT.P: Where Opportunity Meets Precision
🔥 BTCUSDT.P: Liquidation of Highly Leveraged Longs
🌊 SOLUSDT.P: SOL's Dip - Your Opportunity
🐸 1000PEPEUSDT.P: Prime Bounce Zone Unlocked
🚀 ETHUSDT.P: Set to Explode - Don't Miss This Game Changer
🤖 IQUSDT: Smart Plan
⚡️ PONDUSDT: A Trade Not Taken Is Better Than a Losing One
💼 STMXUSDT: 2 Buying Areas
🐢 TURBOUSDT: Buy Zones and Buyer Presence
🌍 ICPUSDT.P: Massive Upside Potential | Check the Trade Update For Seeing Results
🟠 IDEXUSDT: Spot Buy Area | %26 Profit if You Trade with MSB
📌 USUALUSDT: Buyers Are Active + %70 Profit in Total
🌟 FORTHUSDT: Sniper Entry +%26 Reaction
🐳 QKCUSDT: Sniper Entry +%57 Reaction
📊 BTC.D: Retest of Key Area Highly Likely
This list? It’s just a small piece of what I’ve been working on. There’s so much more. Go check my profile, see the results for yourself. My goal is simple: provide value and help you win. If you’ve got questions, I’ve got answers. Let’s get to work!

Bitcoin / TetherUS
Hello and greetings to dear companions!
This is an updated analysis of Bitcoin. Based on the discussions we've had and the previous analysis we conducted for the entire crypto market, we have observed that Bitcoin has reached the bottom of its daily channel after a severe decline! Now, we expect Bitcoin to reach the $105,000 range, similar to our previous analysis, and then either retrace or rise, which we can support with confirmation.
Our previous scenario remains intact, and our target range is still valid, as we have excellent daily liquidity. In terms of price analysis, $102,500 is the level that convinces buyers that Bitcoin is bullish, leading them to enter buy positions. Sellers, upon seeing this decline, are looking to exit, and we will likely see market consolidation around this level until we determine the winner of this confrontation.
I will elaborate on the analysis. Our current scenario is primarily based on ideal selling conditions.
In the specified range, we will exit the market and wait for the market to make its decision.
Based on this analysis, if our trend line breaks, we will swiftly take action to sell, as this serves as a very strong confirmation of the fake rally, and we will likely see further declines!
We are preparing to observe the market reaction at the price of $73,000 with confirmation and act to capture an excellent swing.
Key Points
Resistance (Daily): 102500
Support (Daily): 69388
Ideal Time to Sell with Confirmation: 105250 & 109588
Wishing you all success!
Fereydoon Bahrami
A retail trader in the Wall Street Trading Center (Forex)
Risk Disclosure:
Trading in the cryptocurrency market is risky due to high price volatility. This analysis is solely my personal opinion and should not be considered financial advice. Please do your own research. You are responsible for any profits or losses resulting from this analysis.

Watch out belowYeah, these charts are turning ugly for Bitcoin, which is down more than 10% from its high.
There will be a bounce somewhere on the way down. Use it as a chance to get out.

short 107900 with tp at 100500 sound legit target it will go here easily and i think much more or bit more
but for no risk i take this legit target after the rally he just done its amazing
i not make stop loss in this scenario coz if he go to 110 000 i will had 1 lot and keep my target
if he go 115 000 same...no leverage if u have small balance then apply your RR

BTCUSD - Bitcoin short after a pullback to the Center-LineJust a quick short term analysis:
Price opened and closed below the Center-Line.
This is a bad, very bad sign. My trades are to the South from now on.
I expect a pullback to the Center-Line.
A nice short opportunity, down to the red CL.
Further targets would be the white 1/4 line and the L-MLH.

$BTC Bearish Trend next 6-8 monthsPosting what I see, as I always do, based on technicals. Sure, fundamentals are all bullish but we have all seen bullish fundamentals like ETF's become top signals. I will say $TRUMP coin was a massive top signal; add to that Michael Saylor on the cover of Forbes, and there are plenty of other things imho, but technicals are all I care about.

BTCUSD - Weekly chart updates and anticipated movementsSince everyone is aware of Bitcoin's previous movements in 2017 and 2021, everyone is assuming that it will now be worth 280K. However, Bitcoin is currently in a rally or range between 100,000 and 110,000, and this rally will continue until 2026, after which there will be a nice pullback to 73,000–74,000.
This move makes sense because BTC does not even touch these levels again after breaking the cup and handle pattern, thus it should give this level again in order to continue the trend.
I'm leaving for the time being because we should always be cautious since this rally has the potential to be a good dump.
We all know that once a higher high is broken, a retracement is necessary to continue the trend. This was not the case for all stocks worldwide following the US elections.

Bitcoin - Weekly updated chart and expected movesAs we all know about bitcoin past moves in 2017 and 2021 every thinking about same move according to that move bitcoin would be 280K now but bitcoin is doing rally/Range between 100,000-110,000 this rally continue till 2026, then we see a good move of retracement till 73,000-74,000.
This move is logical understandable because after breaking of cup and handle pattern BTC does not even touch these levels again so for continuation of trend BTC should give this level once again.
I am out for now because this rally can give a good dump so we should be careful about this every time.
As we all know that once a higher high breaks than for continuation of trend a retracement is compulsory this for all kind of stocks in the world which we did not seen after USA elections.
