WAIT BITCOIN DON'T FALLL!!!!!!Folks,
How you doing today??
As I am taking a more in depth look in the 4 hour bitcoin/usdt chart I see a Elliot Wave being completed..
And as we approaching resistance again we see prices tend to reject breaking out resistance (when writing).
IF price tend to reject breaking out we will form a double top and that means high probability of a decline in price..
See the support levels where you can expect price to bounce back at.
What do you think ?
Like the content and feel free to comment...
Follow me for more content like this to come!
Bitcoinshort

BTC has negative divergence !Despite Golden cross is imminent and BTC made daily close above MA200 but BTCUSD pair has negative RSI divergence at 1D time frame.
A correction coud come soon. Be careful !

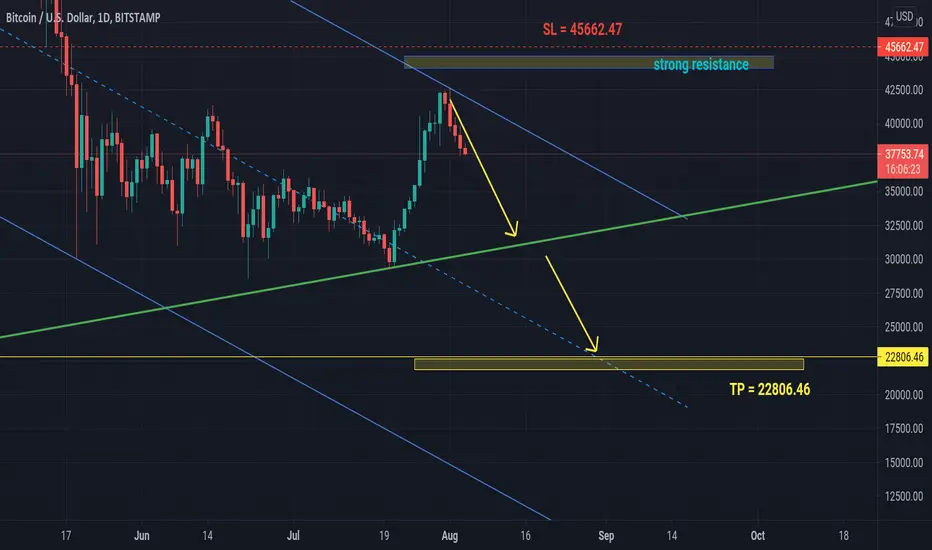
Bitcoin is ready to fall.Hello! In my previous ideas, I noted that the next wave of decline will start either from the upper line of the downtrend channel or from the strong resistance I indicated on the chart. And now nothing has changed, the idea remains valid. The price has reached the horizontal resistance line. Therefore, I expect a move down from the current price to my old target of 22806.
Information provided is only educational and should not be used to take action in the market

Bitcoin Short Setup & IdeaBitcoin lingered a lot in this price zone, I don't think it's a logical situation to linger so long.
I think at the level of $ 41300, investors sold their goods and there are no new buyers for Bitcoin at these levels.
Earlier than that, the $41000 and $42500 range was a sell zone for bitcoin. I prepared a short setup because, thought it could not exceed the 41000 dollar levels.
Please manage your risk.

BITCOIN: 40K Rejected for now?BTCUSDT has a pretty bearish scenario overhead with the weekly support in the thick grey lines and the Ichimoku cloud.
Volume is also not looking pretty good as it continues a downtrend since mid April, with a substantial loss since the january levels (marked with the horizontal line).
Based on all this, we will probably experience a drop towards mid or even lower levels of this range 29K to 42K, considering how many times support has been hit, it could also breakdown.
I advise caution to all traders.
RISK MANAGEMENT IS KEY AS ALWAYS.

Bitcoin moving according my ideaHello! Bitcoin price is moving according to my previous idea. As I pointed out earlier, Bitcoin is facing a new wave of decline. The price reversed reaching the upper line of the descending channel. Currently, we can expect movement to the trend line and only then to my main target 22806.
Information provided is only educational and should not be used to take action in the market
Strong Downtrend Line Hit.Super strong trendline hit. Ties in with my bearish crab thesis. (See on my profile).
Bitcoin looking good to go way lower.

BTC.D Rising Wedge TargetRight now we see Bitcoin's Dominance ratio form a bearish rising wedge pattern that sees a target of the original swing low around 41.20.
This could see a good push for prices in alt coins and a stall of BTCs price action.

[Detailed BTC Analysis] Sentiments changes but Technical don't!From the past 2 months, Bitcoin has been moving in the Bearish trend and the market sentiments were also bearish since then.
When BTC closed below 50 Week EMA, Elon Musk, Jack and others announced the Bitcoin Conference out of nowhere which created a pre-event FOMO in the market and started turning the market green although technical where bearish in zoomed out view.
Last Sunday, there was fake news about Amazon that they're accepting Bitcoin. This boosted the Bullish momentum of Bitcoin but I, as an analyst, am not still bullish.
Below are the REASONS WHY I AM NOT BULLISH ON BITCOIN :
BTC Divergence:
Since the fake Amazon news pump, Bitcoin's price action is not corelating with Relative Strength Index (RSI). We are watching higher highs and lows in BTC Price while lower highs and lows in RSI that clearly indicates that the the Bulls are getting tried and we might see price drop very soon.
Declining Volume:
Although we have seen the volume injection in Bitcoin on Amazon news but since then, it's constantly declining which again depicts something is fishy.
Pattern:
With Bearish Divergence, we usually see a bearish-biased seemingly upward facing pattern. In Technical Analysis, we call it Rising Wedge Pattern. This is exactly what BTC is moving in.
There is a wide bullish channel in which BTC is moving but with declining momentum, BTC is also forming a smaller, slightly tilted bullish pattern. If we see both channels in common grounds, a rising wedge can easily be seen.
EMA & MA
EMA moves more closely with the price action that's why it is more used to do technical analysis in short-term but Moving Average (MA) is used for analyzing long-term trend.
BTC's 200 Day Moving Average is around $44700 so, I think BTC can go to this level and know that this level is HARD!
In 4hour timeframe, 21,50,100 & 200 EMA are acting as potential support levels. If BTC closes below 21EMA in 4h, it will move down to the next.
Cloud Resistance & Support
In daily timeframe, BTC is facing huge resistance from the the cloud while, in 4h timeframe, $33000 is the strong cloud support.
If you have any queries, comment section is for you.
Muneeb.

BTC/USD Re-distribution lower low??As seen on chart, I do not trade BTC however have analysed it since 60K.
Possible lower low.

BTC (BITCOIN) Weekly Scoutwe've been moving in this channel since 2017 and everytime we break trendlines, We retest it and continue to fall further.. now the scenario looks similar and positions should be kept active with utmost care. Will History Repeat? Will we see 12k BTC To buy Alts at cheap rates?
P.S : I Personally want 12k btc so i can buy alts there to see 40-50x Profits :D

BTC (BITCOIN) Shortdetails in chart... Bored to type jorryyyy :)
*** WAIT FOR DAILY CANDLE TO CLOSE. SAFE PLAYERS WAIT FOR 2 DAILY CANDLE CLOSES IN RED AND ENGULFING

Bitcoin expects a new wave of declineHello! Bitcoin has reached the upper border of the descending channel. Further downward movement will continue to new lows. This is confirmed by technical indicators, including CCI and MACD. Therefore, my old goal remains the same (22806). However, it is possible to stop at the trend line (marked in green).
Information provided is only educational and should not be used to take action in the market

BTC Correction 📉Why IS Bitcoin Going Doing?
1. Top of Bollinger Bands
2. Bearing Divergence
3. Hit major resistance at around $41,000
4. RSI overbought
Expected correction to either:
a). $35,118
or
b). $33, 744
Disclaimer: Information contained herein is not an offer or solicitation to buy, hold, or sell any cryptocurrency.

WATCH OUT BITCOIN WILL FALL!!Goodmorning Folks,
Unfortunately Bitcoin has a high probability of losing some gains in the coming hours/days. I hope I am wrong..
What we see at the 4 hour chart of BTC/USDT is that Bitcoin has rejected resistance 4 times now in the last day or so.. That is not good..
The last 2 candles forming are high wave candles with small bodies that implies indecision in the markets.. We lost direction about which way to go.
The positive side here is that we have made a Golden Cross in the moving averages.. A golden cross is a cross in moving averages whereby the shorter moving average crosses above the long term moving average.
In the chart is it 50 day MA crossing the 200 day MA.
I expect price to fall back to the 1st support area.. To make at least a higher low preceding the earlier decline in price and then to rally back up again and try to fight resistance again.
Other possible scenario is that we fall back to the 2nd support line to retest the earlier decline of 26th of July (4 hour chart).
For now it can go either way but my feeling says when combining the technicals with the candlesticks it will fall back in price and will retest support areas to gain momentum back and retest the resistance.
SO fasten your seatbelts.

BTC 15m Chart Parabola Breaking DownLooks like we just broke the parabola and had a retest which actually created a bearish divergence. If you look at the BTC market cap index chart, it looks like we also have a bearish divergence on the 1hr also breaking a bigger parabola. Could see a big move down very soon. I linked the other idea below.
Key levels we could have temporary bounces on are circled.

BITCOIN: VERY SMALL SHORTBTCUSDT has been on a WILD RIDE lately
We have formed a triangle after the recent uptrend, I think we are having a false breakout right now and we are gonna close below this triangle.
I'm mostly counting on massive selling pressure from the people that have been underwater for a while (those that bought at above 30K on the previous run.
Then some more consolidation before we can move in any direction with some conviction.
This is a SHORT TERM SHORT, meaning I don't plan to hold this for much longer, just catch most of the move down...
ALWAYS PRACTICE RISK MANAGEMENT, RISK MANAGEMENT IS THE MOST IMPORTANT SKILL A TRADER CAN HAVE

BTCUSD (NEUTRAL)we all know short squeezes happen in a bear market... We all know what happen when everyone turn greedy... So look at my chart. Everything is given within it.. Thanks

The bitcoin will continue fallingHi everyone! As I spoke in the previous idea, the bitcoin will srednesrochno continue the falling. I indicated in the last idea on the need of short-term correction which in my opinion comes to an end. On the chart it is visible that the price continues to move in a downside channel. After correction from the trend line, the price most likely will continue the movement down to the following support at the level of 22806. Also strong resistance where I placed stop loss on this idea is level 45662.
Information provided is only educational and should not be used to take action in the market.

30K is holds Bitcoin, but until when??The channel is working very well. I missed the touch of the upper channel, but if the price comes back there, I plan to open a short. My target is 30k.Stop, breakout upper channel.

BTC/USD Today's Movements !!!Bitcoin apparently respected possible support near a bearish channel bottom zone.
To think about buying moves, and to be more optimistic, we cannot miss the yellow line, which is between U$ 31,000 and U$ 31,500
In case we lose this important zone, we will spend a few more days in this lateral movement.
Or resume the bearish movement.
I believed that we would start a sharper downward movement, but with the call together with Elon today, prices were stronger than I expected
in your opinion we will make a move like the one plotted in bullish green or bearish red, leave your opinion in the comments.
I hope to be able to contribute to the reading of friends and if you have any suggestions below in the comments, we are here to always learn. I'm not the owner of the truth, this is just content based on my rationale.
If you want to talk to me, send a message inbox, or click on the footer of this post!
Disclaimer: The above comments reflect solely my opinion, this is not a buy or sell recommendation. Just a series of published studies, so that together with the community, we can discuss operational tactics and techniques.
CLICK DOWN HERE!

The B word conference is not enough to pump BTCElon Musk, Cathy Wood, Jack Dorsey, are all very notable names, however, they still do not have the capabilities of pulling BTC out of a bear market on video conference alone. A crash is necessary and inevitable, what you see is temporary, and this pump is only going to be short-lived.

#Bitcoin in the futureWe think this scenario is likely and will happen soon
To find a special place, bitcoin needs to build strong levels for itself at every stage
Support us with likes and comments
This is an analysis for another 6 months
Your own risk
@bitcoinnews @BitcoinNewss #bitcoin @Bitcoininvest
#bitcoininvestment
