🚧Bitcoin Needs Correction🚧✅ Bitcoin moved as I expected in the previous post .
💡Currently, Bitcoin has reacted well to the 🔴 Resistance zone($65,650-$64,200) 🔴.
🌊According to the theory of Elliott waves , it seems that Bitcoin has succeeded in completing 5 impulse waves and now we have to wait for corrective waves .
💡Also, we can see Regular Divergence(RD-) between two Consecutive Peaks .
📈According to Classical Technical Analysis , Bitcoin can also form the Head and Shoulders Pattern .
🔔I expect Bitcoin to fall after breaking the Uptrend line , at least to the first 🎯 Target 🎯 I specified on the chart.
❗️⚠️Note⚠️❗️: If Bitcoin can break the 🔴 Resistance zone($65,650-$64,200) 🔴, the scenario will be changed.
❗️⚠️Note⚠️❗️: An important point you should always remember is capital management and lack of greed.
Bitcoin Analyze ( BTCUSDT ), 1-hour time frame ⏰.
Do not forget to put Stop loss for your positions (For every position you want to open).
Please follow your strategy; this is just my Idea, and I will gladly see your ideas in this post.
Please do not forget the ✅' like '✅ button 🙏😊 & Share it with your friends; thanks, and Trade safe.
Bitcoinsignal

Bitcoin is Ready to ⚔️Attack⚔️ the Resistance zone🎉Hi guys, I hope that you have a great weekend .
💡Bitcoin failed to break the 🟢 Heavy Support zone($61,100-$58,700) 🟢 and 100_SMA(Daily) and created a 🐻 Bear Trap 🐻, one of the reasons for which was the release of the US employment rate .
🏃♂️ Bitcoin currently seems to have succeeded in breaking the upper line of the descending channe l and is moving in the 🔴 Resistance zone($65,650-$64,200) 🔴.
🔔I expect Bitcoin to rise at least to the upper 🔴 Resistance zone($65,650-$64,200) 🔴 and possibly to the 50_SMA(Daily) .
❗️⚠️Note⚠️❗️: An important point you should always remember is capital management and lack of greed.
Bitcoin Analyze ( BTCUSDT ), 1-hour time frame ⏰.
Do not forget to put Stop loss for your positions (For every position you want to open).
Please follow your strategy; this is just my Idea, and I will gladly see your ideas in this post.
Please do not forget the ✅' like '✅ button 🙏😊 & Share it with your friends; thanks, and Trade safe.

🚨Bitcoin is Ready to Go Down again🚨✅ Bitcoin finally managed to break the 🟢 Heavy Support zone($61,100-$58,700) 🟢 and the lower line of the Descending Channel and 100_SMA(Daily) .
🏃♂️Bitcoin is currently pulling back into the 🟢 Heavy Support zone($61,100-$58,700) 🟢 and moving near the 🟡 Potential Reversal Zone(PRZ) 🟡.
😱The Fear and Greed Index entered the " Fear zone " again after more than 4 months .
🔔I expect Bitcoin to start going down again and at least to the 🟢 Support zone($57,050-$56,550) 🟢.
❗️⚠️Note⚠️❗️: An important point you should always remember is capital management and lack of greed.
Bitcoin Analyze ( BTCUSDT ), 15-minute time frame ⏰.
Do not forget to put Stop loss for your positions (For every position you want to open).
Please follow your strategy; this is just my Idea, and I will gladly see your ideas in this post.
Please do not forget the ✅' like '✅ button 🙏😊 & Share it with your friends; thanks, and Trade safe.

Bitcoin is Ready to ⚔️Attack⚔️ to Heavy Support zone🏃♂️ Bitcoin is moving near Support lines .
🌊According to the theory of Elliott waves , Bitcoin seems to have completed microwave 3 of the main wave 3 and is currently completing microwave 4 of the main wave 3 .
🔔I expect Bitcoin to start Going down from the 🔴 Resistance zone($62,940-$62,540) 🔴 and attack the 🟢 Heavy Support zone($61,100-$58,700) 🟢.
❗️⚠️Note⚠️❗️ : The lines of possible waves are hypothetical , and waves can be formed in other ways .
❗️⚠️Note⚠️❗️: An important point you should always remember is capital management and lack of greed.
Bitcoin Analyze ( BTCUSDT ), 15-minute time frame ⏰.
Do not forget to put Stop loss for your positions (For every position you want to open).
Please follow your strategy; this is just my Idea, and I will gladly see your ideas in this post.
Please do not forget the ✅' like '✅ button 🙏😊 & Share it with your friends; thanks, and Trade safe.

⚠️Bitcoin Analysis (Mix of Patterns)⚠️👋Hi, everyone. First of all, I apologize for the chart being busy, but I think all the lines and zones are needed to better understand it.
🏃♂️Bitcoin is moving in two descending channels : a ⚫️Black Descending Channel⚫️ and a 🟣Purple Descending Channel🟣 . Also, it is currently moving in the 🔴 Resistance zone($66,050-$64,520) 🔴and near the Upper line of the descending channel and 50_SMA(Daily) and Time Reversal Zone(TRZ) .
📈If we want to look at the chart from the point of view of the Classical and Harmonic patterns , Bitcoin has succeeded in breaking the lower line of the Symmetrical Triangle Pattern , and it seems that a Bearish 5-0 Harmonic Pattern is forming near the upper line of the 🟣descending channel🟣.
💡Before concluding, let's take a look at the Market Cap USDT Dominance% (USDT.D%) chart.
💡 USDT.D% broke the 🔴 Resistance zone(4.72%-4.53%) 🔴 as I expected and is currently pulling back to this zone, the pullback structure seems to be forming with the Falling Wedge Pattern , I expect USDT.D% to rising again and this It will cause another decline in the cryptocurrency market .👇
🔔I expect Bitcoin to start falling again based on the above explanation.
❗️⚠️Note⚠️❗️: An important point you should always remember is capital management and lack of greed.
Bitcoin Analyze ( BTCUSDT ), 4-hour time frame ⏰.
Do not forget to put Stop loss for your positions (For every position you want to open).
Please follow your strategy; this is just my Idea, and I will gladly see your ideas in this post.
Please do not forget the ✅' like '✅ button 🙏😊 & Share it with your friends; thanks, and Trade safe.

🗺️Bitcoin Roadmap🗺️⏰(15_minute time frame)⏰🏃♂️ Bitcoin is moving near Potential Reversal Zone and Support lines .
🌊According to the theory of Elliott waves , Bitcoin seems to have succeeded in completing wave 5 .
💡Also, we can see Regular Divergence(RD+) between two Consecutive Valleys .
🔔 I expect Bitcoin to reach at least the 🎯Target🎯 I specified on the chart.
❗️⚠️Note⚠️❗️: An important point you should always remember is capital management and lack of greed.
Bitcoin Analyze ( BTCUSDT ), 15-minute time frame ⏰.
Do not forget to put Stop loss for your positions (For every position you want to open).
Please follow your strategy; this is just my Idea, and I will gladly see your ideas in this post.
Please do not forget the ✅' like '✅ button 🙏😊 & Share it with your friends; thanks, and Trade safe.

🚀Bitcoin Is Ready to Go Up Again🚀🎉Hi guys, I hope that you have a great weekend .
🏃♂️Bitcoin is moving near the 🟢 Support zone($63,370-$62,790) 🟢. Also, Bitcoin managed to break the Resistance lines and is currently completing the pullback .
🌊According to Elliott's wave theory , Bitcoin seems to have completed wave 3 and is currently completing wave 4 .
🔔I expect Bitcoin to rise to at least the Potential Reversal Zone and upper Resistance line .
❗️⚠️Note⚠️❗️: An important point you should always remember is capital management and lack of greed.
Bitcoin Analyze ( BTCUSDT ), 15-minute time frame ⏰.
Do not forget to put Stop loss for your positions (For every position you want to open).
Please follow your strategy; this is just my Idea, and I will gladly see your ideas in this post.
Please do not forget the ✅' like '✅ button 🙏😊 & Share it with your friends; thanks, and Trade safe.

🗺️Bitcoin Roadmap🗺️⏰(15-minute time frame)⏰🏃♂️Bitcoin is moving in the 🔴 Resistance zone($65,700-$64,500) 🔴.
🌊According to the theory of Elliott waves , Bitcoin seems to be completing the main wave 4 in the 15-minute time frame .
🔔I expect Bitcoin to Drop again and break the 🟢 Support zone($63,370-$62,790) 🟢.
❗️⚠️Note⚠️❗️: An important point you should always remember is capital management and lack of greed.
Bitcoin Analyze ( BTCUSDT ), 15-minute time frame ⏰.
Do not forget to put Stop loss for your positions (For every position you want to open).
Please follow your strategy; this is just my Idea, and I will gladly see your ideas in this post.
Please do not forget the ✅' like '✅ button 🙏😊 & Share it with your friends; thanks, and Trade safe.

Bitcoin is Ready to Attack to Resistance zone⚔️💡Bitcoin started to rise after the Spot Bitcoin And Ethereum ETFs were Approved In Hong Kong but failed to break the 🔴 Resistance zone($66,100-$64,500) 🔴and created a Bull Trap .
🌊According to the theory of Elliott waves , Bitcoin seems to have completed 5 downtrend waves in the 15-minute time frame .
💡Also, we can see Regular Divergence(RD+) between two Consecutive Valleys .
📈From the point of view of Classical Technical Analysis , there is also a possibility of forming the Inverse Head and Shoulders pattern .
🔔I expect Bitcoin to Attack the 🔴 Resistance zone($66,100-$64,500) 🔴once again.
❗️⚠️Note⚠️❗️: We must note that there is a possibility of Israel's response to Iran's attacks and the cryptocurrency market may experience another fall.
❗️⚠️Note⚠️❗️: An important point you should always remember is capital management and lack of greed.
Bitcoin Analyze ( BTCUSDT ), 15-minute time frame ⏰.
Do not forget to put Stop loss for your positions (For every position you want to open).
Please follow your strategy; this is just my Idea, and I will gladly see your ideas in this post.
Please do not forget the ✅' like '✅ button 🙏😊 & Share it with your friends; thanks, and Trade safe.

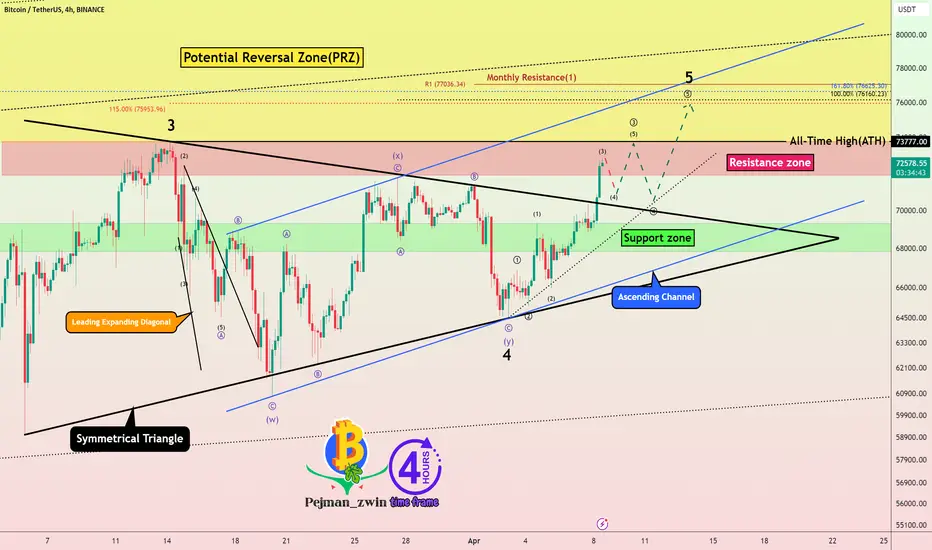
🗺️Bitcoin Roadmap🗺️⏰(4_hour time frame)⏰✅Bitcoin broke the upper line of the classic Symmetrical Triangle Pattern a few hours ago.
🌊Regarding Elliott's wave theory , Bitcoin seems to have completed wave 4 with a Double Three Correction(WXY) in a symmetrical triangle.
🌊Currently, Bitcoin is completing microwave wave 3 of main wave 5 , which can complete around an All-Time High($73,777) ( or even a little higher ).
🔔I expect Bitcoin to start rising again to complete the main wave 5 after the pullback to the upper line of the symmetrical triangle and at least rise to the upper line of the Ascending Channel .
❗️⚠️Note⚠️❗️: If Bitcoin can break the 🟢Support zone($69,300-$67,800)🟢, the scenario will change and we have to wait for Bitcoin to fall further.
❗️⚠️Note⚠️❗️: An important point you should always remember is capital management and lack of greed.
Bitcoin Analyze ( BTCUSDT ), 4-hour time frame ⏰.
Do not forget to put Stop loss for your positions (For every position you want to open).
Please follow your strategy; this is just my Idea, and I will gladly see your ideas in this post.
Please do not forget the ✅' like '✅ button 🙏😊 & Share it with your friends; thanks, and Trade safe.
⚠️Bitcoin is Ready to Go Down again by Wedge Pattern⚠️🏃♂️ Bitcoin is moving near the 🔴 Resistance zone($69,000-$67,800) 🔴.
🌊According to Elliott's wave theory , Bitcoin seems to be completing wave 4 .
📈The Classic Ascending Broadening Wedge Pattern is also visible in the chart.
🔔I expect Bitcoin to fall to at least near the Support line after breaking the lower line of the Ascending Broadening Wedge Pattern .
❗️⚠️Note⚠️❗️: If Bitcoin can break the 🔴 Resistance zone($69,000-$67,800) 🔴, the scenario can be bullish, and Bitcoin will go to a new All-Time High(ATH).
❗️⚠️Note⚠️❗️: An important point you should always remember is capital management and lack of greed.
Bitcoin Analyze ( BTCUSDT ), 1-hour time frame ⏰.
Do not forget to put Stop loss for your positions (For every position you want to open).
Please follow your strategy; this is just my Idea, and I will gladly see your ideas in this post.
Please do not forget the ✅' like '✅ button 🙏😊 & Share it with your friends; thanks, and Trade safe.

🚨Bitcoin Analysis🚨✅As I shared with you in previous posts, Bitcoin attacked the 🟢 Support zone($69,000-$67,800) 🟢 two times.
🏃♂️Bitcoin is moving in the 🟢 Support zone($69,000-$67,800) 🟢 and near the Support line .
🔔Based on Market Cap USDT Dominance% (USDT.D%) conditions, I expect Bitcoin to rise to $70,200 at most and then attack the Support line . The Rising Wedge Pattern is still Valid .
💡Bitcoin also seems to be completing a pullback to the lower line of the symmetrical triangle .
❗️⚠️Note⚠️❗️ : If Bitcoin can break the Resistance lines , we can expect a new All-Time High(ATH) for Bitcoin.
❗️⚠️Note⚠️❗️: An important point you should always remember is capital management and lack of greed.
Bitcoin Analyze ( BTCUSDT ), 4-hour time frame ⏰.
Do not forget to put Stop loss for your positions (For every position you want to open).
Please follow your strategy; this is just my Idea, and I will gladly see your ideas in this post.
Please do not forget the ✅' like '✅ button 🙏😊 & Share it with your friends; thanks, and Trade safe.

🚨Bitcoin Is Ready to Fall🚨🏃♂️Bitcoin is moving in 🟡 Potential Reversal Zone(PRZ)($66,120-$65,350) 🟡 and Resistance line .
🌊According to the Elliott wave theory , Bitcoin seems to be able to complete the Zigzag Correction(ABC/5-3-5) in PRZs (🟡 Potential Reversal Zone(PRZ) ($66,120-$65,350)🟡 has more chances).
💡Another sign that we can point to Bitcoin correction is the formation of the Head and Shoulders Pattern .
🔔I expect Bitcoin to fall at least to my Pitchfork lines on the chart.
❗️⚠️Note⚠️❗️: An important point you should always remember is capital management and lack of greed.
Bitcoin Analyze ( BTCUSDT ), 1-hour time frame ⏰.
Do not forget to put Stop loss for your positions (For every position you want to open).
Please follow your strategy; this is just my Idea, and I will gladly see your ideas in this post.
Please do not forget the ✅' like '✅ button 🙏😊 & Share it with your friends; thanks, and Trade safe.

Bitcoin - On the way to 200,000?To what level can Bitcoin rise?
There is an analyst that I respect a lot, from Standard Chartered, who has considered the most likely target for Bitcoin's rise, the price of 200,000. I am more of a chart person, and we are going to go level by level, seeing the evolution of the price on the chart.
Financial advisors who have recommended their clients invest in cash Bitcoin ETFs have advised them to allocate 3.5% of their financial assets.
It strikes me that the group of financial advisors who have made this investment recommendation to their clients is a small group.
Institutions have not yet entered Bitcoin spot ETFs in large volume, because they have not had time to decide, and they will most likely do so now once a correction has begun.
So there is money waiting to flow into spot Bitcoin ETFs. In such a way, that analyst's forecast can be fulfilled.
Now, I prefer to look at the chart. What are we seeing in the short term?
The day before yesterday, there was less money coming into the spot Bitcoin ETFs, and yesterday we had net outflows by funds from the spot Bitcoin ETFs.
What does this reveal? It reveals that the bubble of optimism of people who believed that there were not going to be enough bitcoins for everyone is being punctured.
We see that desire to buy Bitcoin has been reduced. And what do we see on the chart?
The medium and long-term trend continues to be bullish, and what we are witnessing is a correction.
It is an orderly, logical and normal correction. There is a bearish channel, and I have established first resistance at the 68.123 zone.
In the short term, we are going to consider as the most likely scenario that Bitcoin continues to fall to that support zone that is around 61.000
And when it reaches that zone, or when we see some type of exhaustion pattern, we will think about whether it has made a bottom and can deploy another leg upwards.
Guys, what do you think? Leave a comment with your thoughts.

Bitcoin will Fall after🚨Bull Trap🚨🏃♂️Bitcoin is moving in the 🔴 Resistance zone($69,000_$65,000) 🔴.
📈From the point of view of Classic Technical Analysis , it seems that a Rising Wedge Pattern has been formed, although, at the same time, we seem to have witnessed a Bull Trap , and this Bull Trap caused a new All-Time High(ATH=$69,990) to be created for Bitcoin.
📚What is the 🐮Bull Trap🐮❗️❓
🔸 After a minimal rise, the bull trap forms when analysts and traders expect the price to move upward, so traders open their long positions, hoping for the price to go up. However, that’s not the case. The price goes down, trapping those traders who thought otherwise.
🔸In this case, traders without correct stop losses suffer heavy losses. They are the so-called bull trap fallen.
🔔I expect Bitcoin to fall to at least one of the Fibonacci levels( after completing the pullback to the lower line of the Rising Wedge Pattern .
❗️⚠️Note⚠️❗️: If Bitcoin makes a new ATH again, the analysis will be failed.
❗️⚠️Note⚠️❗️: An important point you should always remember is capital management and lack of greed.
Bitcoin Analyze ( BTCUSDT ), 15-minute time frame ⏰.
Do not forget to put Stop loss for your positions (For every position you want to open).
Please follow your strategy; this is just my Idea, and I will gladly see your ideas in this post.
Please do not forget the ✅' like'✅ button 🙏😊 & Share it with your friends; thanks, and Trade safe.

After the New ATH of Bitcoin, what should we expect (Reasons)❗️❓😱Today, a new All-Time High(ATH) was created in most of the exchanges . Perhaps the movement of Bitcoin last week surprised many people, and many did not expect Bitcoin to touch All-Time High(ATH) before the new Halving . But it was expected that Bitcoin would react near the previous All-Time High(ATH), and the same happened. There are many reasons why Bitcoin should be corrected ( Fear and Greed index, Open Interest value, etc.).
💡 Bitcoin has started to decline from the 🔴 Resistance zone($69,000_$65,000) 🔴 and has managed to break the Uptrend line .
🌊According to the theory of Elliot waves , the end of wave 5 was in the 🔴 Resistance zone($69,000_$65,000) 🔴 , and we should expect correction waves ; one sign of the beginning of correction waves is the breaking of the Uptrend line . Another sign is the Regular Divergence(RD-) between two Consecutive Peaks.
💡One of the other charts that can help us confirm the Bitcoin correction is the Market Cap USDT Dominance% (USDT.D%) chart.
💡 USDT.D% after breaking the Support line and the 🟢 Heavy Support zone(5.80%-5.20%) 🟢 caused the cryptocurrency market to increase significantly in these weeks.
💡Currently, USDT.D% is in 🟡 Potential Reversal Zone(PRZ) 🟡and near Support lines and has also touched the 🎯Symmetric Triangle Target🎯 . I expect USDT.D% to rise to at least one Fibonacci level .👇
🔔I expect Bitcoin to start going down again after possibly playing around $61,500 for a while and at least down to the Support line and 🟡 Potential Reversal Zone(PRZ) 🟡.
❗️⚠️Note⚠️❗️: An important point you should always remember is capital management and lack of greed.
Bitcoin Analyze ( BTCUSDT ), 4-hour time frame ⏰.
Do not forget to put Stop loss for your positions (For every position you want to open).
Please follow your strategy; this is just my Idea, and I will gladly see your ideas in this post.
Please do not forget the ✅' like '✅ button 🙏😊 & Share it with your friends; thanks, and Trade safe.

🗺️Bitcoin Roadmap🗺️⏰(4-hour time frame)⏰😱Bitcoin surprised everyone in the last two days ( without any correction ) and increased by more than ➕25% . One of the biggest drivers of Bitcoin to increase again was MicroStrategy .
🏃♂️Bitcoin is currently moving at the 🟡 Potential Reversal Zone(PRZ) ($65,120_$56,300) 🟡and the Resistance line (we also saw the 🐮 Bull Trap 🐮).
🌊According to the theory of Elliott waves , it seems that Bitcoin has succeeded in completing wave 5 .
💡In general, the distance between the Price of Bitcoin and the SMA(100) has increased, and the correction can probably continue until the SMA(100) .
🏃♂️ Market Cap BTC Dominance% (BTC.D%) has entered the 🟡 Potential Reversal Zone(PRZ) 🟡, and I expect a correction to the Support line .👇
🔔I expect Bitcoin to decline to the 🟢 Support zone($57,580-$56,320) 🟢 and then attack the Support line .
❗️⚠️Note⚠️❗️ : So far, Bitcoin has not touched its All-Time High(ATH) before halving. Can Bitcoin touch $69,000 before Halving ❗️❓
❗️⚠️Note⚠️❗️: An important point you should always remember is capital management and lack of greed.
Bitcoin Analyze ( BTCUSDT ), 4-hour time frame ⏰.
Do not forget to put Stop loss for your positions (For every position you want to open).
Please follow your strategy; this is just my Idea, and I will gladly see your ideas in this post.
Please do not forget the ✅' like '✅ button 🙏😊 & Share it with your friends; thanks, and Trade safe.

🚧Bitcoin can GO DOWN by Rising Wedge Pattern🚧✅Bitcoin has managed to form a Rising Wedge Pattern near the 🔴 Resistance zone($52,820-$52,460) 🔴.
💡Also, we can see Regular Divergence(RD-) between two Consecutive Peaks .
🔔After breaking the Support line , I expect Bitcoin to go Down to at least the 🟢 Support zone($50,840-$50,200) 🟢 in the next hour.
❗️⚠️Note⚠️❗️: An important point you should always remember is capital management and lack of greed.
Bitcoin Analyze ( BTCUSDT ), 1-hour time frame ⏰.
Do not forget to put Stop loss for your positions (For every position you want to open).
Please follow your strategy; this is just my Idea, and I will gladly see your ideas in this post.
Please do not forget the ✅' like '✅ button 🙏😊 & Share it with your friends; thanks, and Trade safe.

Expanding Ending Diagonal Can Cause a Correction in Bitcoin🧐👋Hi everyone.
🚀Bitcoin continued its upward trend after a series of News and Joe Biden's strange Tweet (red eyes).
🏃♂️Bitcoin is moving near the upper reaches of the 🔴 Heavy Resistance zone($53,000-$47,000) 🔴, Resistance lines , and 🟡 Potential Reversal Zone(PRZ)($52,700-$51,780) 🟡.
🌊According to the Elliott wave theory, it seems that Bitcoin has chosen the Expanding Ending Diagonal Pattern to complete the fifth wave ( As long as Bitcoin cannot break the 🔴Heavy Resistance zone($53,000-$47,000)🔴, this wave count is valid. ).
📚The Expanding Ending Diagonal Pattern ( Elliot's point of view) is the same as the Ascending Broadening Wedge Pattern ( Classical Analysis point of view).
❗️⚠️Note⚠️❗️: If Bitcoin can touch $53,700, some corrective scenarios will expire, and we can expect Bitcoin to continue its upward trend to $56,000 in the coming days.
🔔I expect Bitcoin to go down to at least $50,000 , where the most volume trading has happened around this price in the past few days, and if Bitcoin can create a candle below $50,000 in the 4-hour time frame , we can expect a lower line of Expanding Ending Diagonal Pattern will break, and Bitcoin will fall even to the 🟢 Support zone($49,000-$47,000) 🟢.
📚 Elliott waves include a series of Rules and Guidelines that you can analyze and predict the road map of the price. In general, in the theory of Elliott waves, you are faced with several scenarios in which you should find the correct scenario with the help of other technical analysis tools and fundamental analysis and try to identify the correct scenario from the false scenario.
❤️In the end, here is some advice for you as a little brother:
🔸TradingView website has provided us with a suitable space to transfer our analysis, so it is better to use it and NOT waste our time on destruction or ugly comments.
🔸If you have any comments, please share them with respect .
🔸 No analysis is 100% , so if you use analysis as an investment, it is better to follow capital management and take responsibility for it yourself.
🔸I hope we can use TradingView to increase our capital and knowledge .
❗️⚠️Note⚠️❗️: An important point you should always remember is capital management and lack of greed.
Bitcoin Analyze ( BTCUSDT ), 4-hour time frame ⏰.
Do not forget to put Stop loss for your positions (For every position you want to open).
Please follow your strategy; this is just my Idea, and I will gladly see your ideas in this post.
Please do not forget the ✅' like '✅ button 🙏😊 & Share it with your friends; thanks, and Trade safe.

🚨Bitcoin is Ready to Decrease to the Uptrend line🚨🏃♂️Bitcoin is moving in the 🟡 Potential Reversal Zone(PRZ)($50,100-$47,000) 🟡.
💡Also, we can see Regular Divergence(RD-) between two Consecutive Peaks .
🌊According to the theory of Elliott waves , five impulse waves have been completed in 🟡 Potential Reversal Zone(PRZ)($50,100-$47,000) 🟡.
🔔I expect Bitcoin to fall at least to the Uptrend line , and if this line breaks, we can expect Bitcoin to fall to the 🟢 Support zone($44,700-$41,780) 🟢.
❗️⚠️Note⚠️❗️: An important point you should always remember is capital management and lack of greed.
Bitcoin Analyze ( BTCUSDT ), 4-hour time frame ⏰.
Do not forget to put Stop loss for your positions (For every position you want to open).
Please follow your strategy; this is just my Idea, and I will gladly see your ideas in this post.
Please do not forget the ✅' like '✅ button 🙏😊 & Share it with your friends; thanks, and Trade safe.

🗺️Bitcoin Roadmap🗺️⏰(4-hour time frame)⏰🏃♂️After breaking the 🔴 Resistance zone($44,700-$41,780) 🔴, Bitcoin has reached the top of the Ascending Channel with the help of the Symmetrical Triangle Pattern .
🏃♂️Bitcoin is also currently moving near the 🟡 Potential Reversal Zone(PRZ)($50,100-$47,000) 🟡.
🌊In terms of Elliott wave theory , Bitcoin seems to be. It has completed wave 3 at the top of the ascending channel and is completing wave 4 .
🔔I expect wave 4 to end near the broken 🔴 Resistance zone($44,700-$41,780) 🔴 and Bitcoin will start to rise again to the 🟡 Potential Reversal Zone(PRZ)($50,100-$47,000) 🟡.
❗️⚠️Note⚠️❗️: An important point you should always remember is capital management and lack of greed.
Bitcoin Analyze ( BTCUSDT ), 4-hour time frame ⏰.
Do not forget to put Stop loss for your positions (For every position you want to open).
Please follow your strategy; this is just my Idea, and I will gladly see your ideas in this post.
Please do not forget the ✅' like '✅ button 🙏😊 & Share it with your friends; thanks, and Trade safe.

BTC Market Cycle | Repetitive and Predictable Market CycleThe Bitcoin market cycle can be easily predicted by studying historical data. Whenever you seek an idea of where the market is heading, you can always look at the past to gauge the future. However, this doesn't guarantee that the predictions stated here will unfold exactly as described; it's a PREDICTION, not a fact.
Let's examine the chart displayed here. The market cycle repeats itself every four years, with our chart divided into four cycles, the fourth being the current cycle we are in. Every four years, Bitcoin undergoes a major event known as Halving, where the number of blocks containing Bitcoins is halved every four years. We started with 50 Bitcoins released in a block every 10 minutes; in 2012, that amount was reduced to 25 BTC. In the following cycle, it was halved again, and this will continue to happen every four years until all Bitcoins are mined. Currently, we are heading towards the fourth halving event, which will see the number of blocks released reduced to 3.125 BTC.
Due to this event, the price of Bitcoin appreciates in value every four years. This is driven by supply and demand, as fewer Bitcoins are mined than in the previous four years (reduced supply), creating scarcity and increasing demand. The mining difficulty also increases, causing miners to be reluctant to sell the Bitcoins they've mined, contributing to the price increase.
On our chart, we have three completed cycles that look almost identical. The cycles consist of a bull market where the price experiences a significant increase, followed by a bear market where the price drops in the range of 80–85%. This is followed by the first expansion, where we see a slight price increase, followed by the first accumulation phase. Prices move up and down within a specified range during this phase, also known as the consolidation phase. We then move on to the second expansion and the second accumulation, usually forming just before or within the halving period.
This not only shows us that the market cycles are similar but also allows us to predict future events. At the time of writing this, we are three months away from the fourth halving, and it appears we have entered the second accumulation phase, as seen in the past three cycles. Prices should trade in a specified range for a few months after the halving. When you examine the halving events on the chart, you can observe that we usually enter the bull run somewhere between 6 to 8 months after the halving. Based on that, we can predict that the next bull run will start between October and December 2024, lasting until the fourth quarter of 2025.
In the past, the cycles have been accurate, and we can expect the same unless a global catastrophic event occurs, as seen in March 2020 during the COVID-19 pandemic. In that phase, there was no second expansion as all markets crashed. It is my opinion that this led to the bull run not reaching its full potential. Had we experienced the second expansion, the price would have moved slightly higher before the second accumulation phase, leading to an extended bull run pushing the price near or above $100k.
My price prediction at the end of the cycle, assuming world events stay normal, is to see Bitcoin in the range of $120–150K.
What do you think the price of Bitcoin at the end of 2025 will be? Like, share, and feel free to leave a comment. Let me know if you agree or disagree with this analysis.

🗺️Bitcoin Roadmap🗺️⏰(Daily time frame)⏰👋Hi, everyone.
📈Today, I want to analyze Bitcoin for you in a daily time frame so that we can have a short-term view of Bitcoin regarding the technical analysis . (Please 🌹🙏 respectfully🙏🌹 share if you have a different opinion from me or other analysts).
✅As I expected, Bitcoin started declining from 🟡 Potential Reversal Zone(PRZ) 🟡 after the SEC approval of Bitcoin ETFs . ( In previous posts, I warned you several times that Bitcoin is near the end of its upward trend. )
🏃♂️Bitcoin has been moving in an Ascending Channel for more than a year , and as long as Bitcoin is moving in this channel, we can still hope for the rise of Bitcoin.
⚔️Currently, Bitcoin is attacking the 🟢 Support zone($39,000-$37,000) 🟢, SMA(100) and Support line for the first time . Of course, it seems that Bitcoin will NOT succeed in breaking this zone .
📚 Assets generally do NOT break Support and Resistance zones for the first time.
🌊According to the theory of Elliott waves , Bitcoin seems to have completed five impulse waves in 🟡 Potential Reversal Zone(PRZ) 🟡and is now starting to form new corrective waves .
🔔I expect an upward trend in the coming days and at least an increase in the 🔴 Resistance Zone($43,800-$43,000) 🔴. (Bitcoin has had a high trading volume of around $43,400 , which indicates an important resistance for Bitcoin ).
❗️⚠️Note⚠️❗️If the Daily Candle closes below the 🟢 Support zone($39,000-$37,000) 🟢, we can expect further falls for Bitcoin.
❗️⚠️Note⚠️❗️: An important point you should always remember is capital management and lack of greed.
Bitcoin Analyze ( BTCUSDT ), Daily time frame ⏰.
Do not forget to put Stop loss for your positions (For every position you want to open).
Please follow your strategy; this is just my Idea, and I will gladly see your ideas in this post.
Please do not forget the ✅' like '✅ button 🙏😊 & Share it with your friends; thanks, and Trade safe.
