Bitcoin is Ready to fill CME Gap!!!Bitcoin ( BINANCE:BTCUSDT )is approaching the Resistance zone($105,560-$104,940) , Downtrend line , and Cumulative Short Liquidation Leverage($105,654-$104,709) .
According to Elliott's wave theory , Bitcoin seems to be completing wave 4 . Probably wave 4 will end in the Resistance zone($105,560-$104,940) .
I expect Bitcoin to go towards filling the CME Gap($103,325-$101,840) AFTER breaking the Support line .
⚠️Note: US indices (Federal Funds Rate, FOMC Economic Projections, FOMC Statement) can affect the trend of Bitcoin; the possibility that the market will get excited when the indices are announced is very high.⚠️
⚠️Note: If Bitcoin breaks the Resistance zone($105,560-$104,940), we can expect Bitcoin to rise further, especially if Bitcoin touches $106,200.⚠️
🙏Please respect each other's ideas and express them politely if you agree or disagree.🙏
Bitcoin Analyze (BTCUSDT), 15-minute time frame⏰.
🔔Be sure to follow the updated ideas.🔔
Do not forget to put Stop loss for your positions (For every position you want to open).
Please follow your strategy and updates; this is just my Idea, and I will gladly see your ideas in this post.
Please do not forget the ✅' like '✅ button 🙏😊 & Share it with your friends; thanks, and Trade safe.
Bitcoinsignals

BITCOIN Will the Channel Up hold or has the Fed condemned it?Bitcoin (BTCUSD) is having an impressive sustainable price action within the Channel Up pattern since November 12, which despite yesterday's Fed fueled pull-back, is still holding. If it holds, it may follow the same pattern that it did exactly 1 year ago.
As you see, it was again in November 2023 that it traded within a Channel Up, which was supported by the 4H MA200 (orange trend-line) since October 11. After it broke out, the price reached the 7.0 Fibonacci extension level from the October low, before correcting again.
The situation is very similar today, the 4H MA200 is also holding since Oct 11, the price also formed a 4H Golden Cross on Sep 18, while both fractals started their impressive rallies around the same date (Sep 06 2023 and Sep 11 2024 respectively).
As a result, if the 4H MA200 holds, we can expect BTC to target the 7.0 Fib ext next at $135000.
-------------------------------------------------------------------------------
** Please LIKE 👍, FOLLOW ✅, SHARE 🙌 and COMMENT ✍ if you enjoy this idea! Also share your ideas and charts in the comments section below! This is best way to keep it relevant, support us, keep the content here free and allow the idea to reach as many people as possible. **
-------------------------------------------------------------------------------
💸💸💸💸💸💸
👇 👇 👇 👇 👇 👇

BITCOIN (BTCUSD): Bullish Move From Support Confirmed
Looks like Bitcoin is going to pullback from a key intraday/daily horizontal support.
As a confirmation, I spotted a tine cup & handle pattern on an hourly.
The price will go up and reach at least 105291 level soon.
❤️Please, support my work with like, thank you!❤️

BITCOIN Next top is going to surprise you but it SHOULDN'T !!Bitcoin (BTCUSD) broke yet another benchmark, the psychological level of $100k. The market cap is growing and many claim that it can't keep rising as the capitalization would be at unrealistic levels. For one capital inflows seem to be very comfortable right now with BTC investments and there are still billions waiting at the side for the right investment in 2025.
Fundamentals aside, Bitcoin's historic patterns and price action gives us even more reasons to expect (much) higher prices and a Cycle Top that could surprise many.
** Fibonacci Channel Up **
First of all, we've plotted a Channel Up starting from BTC's first Bear Cycle and displayed the Fibonacci retracement levels on it. As you can see, those fit perfectly and catch each Cycle's tops and bottoms very accurately:
1) June 2011 Top on the 0.618 Fib. November 2011 Bottom on the 0.0 Fib.
2) December 2013 Top on the 1.0 Fib. August 17 2015 Bottom on the 0.382 Fib.
3) December 2017 Top on the 1.0 Fib. December 2018 bottom on the 0.5 Fib.
4) April 2021 Top on the 0.786 Fib. November 2022 bottom on the 0.236 Fib.
** Pi Cycle and MM Bands **
Then we have applied the Pi Cycle trend-lines 1 (orange) and 2 (green), which are key trend Resistance and Support levels respectively, combined with the MMB SD3 above (red trend-line) and MMB SD3 below (black trend-line), which are also historically almost the absolute Resistance and Support levels respectively. In the middle of all these is the 1W MA50 (blue trend-line), which during the Parabolic Rally phases (like the one we are currently on), is Bitcoin's main upward force.
** Covering at least 4 Fib ranges **
As you can see, all Cycles broke above at least the Pi Cycle trend-line 1 (orange) before making a Top. The first two Cycles even hit the MMB SD3 above (red). Also each Cycle has a proportional Fibonacci Channel level range, covering at least 4 Fib bands (as described above). Cycle 1 covered Fibs 0.618, 0.5, 0.382, 0.236 and 0.0. Cycle 2 covered Fibs 1.0, 0.786, 0.618, 0.5, 0.382. Cycle 3 also covered Fibs 1.0, 0.786, 0.618, 0.5, 0.382. Cycle 4 covered Fibs 0.786, 0.618, 0.5, 0.382, 0.236.
** Surprise Top **
The MMB SD3 above (red trend-line) is now below Fib 0.618 and it is less likely for BTC to hit it since Cycle 3 didn't. As a result, it is possible that the next Top will be on Fib 0.5 at best (maximum). If that is succeeded towards the end of 2025, and assuming that the Pi Cycle trend-line 1 (orange) breaks by then as it always has on every previous Cycle, that gives us a target range for the next Cycle Top within $250k - $350k!
Do you still think that's unrealistic? Feel free to let us know in the comments section below!
-------------------------------------------------------------------------------
** Please LIKE 👍, FOLLOW ✅, SHARE 🙌 and COMMENT ✍ if you enjoy this idea! Also share your ideas and charts in the comments section below! This is best way to keep it relevant, support us, keep the content here free and allow the idea to reach as many people as possible. **
-------------------------------------------------------------------------------
💸💸💸💸💸💸
👇 👇 👇 👇 👇 👇

BITCOIN The Volatility Index points to strong consolidation nextLast time we analyzed Bitcoin (BTCUSD) in relation to the Volatility Index (VIX), was 4 months ago (August 22, see chart below) and was an extremely successful projection as we took advantage of the 1W MA50 (blue trend-line) bottom and predicted the $100k Target, which recently got hit:
Once more, we decided to seek the (mostly) negatively correlated patterns of VIX (chart on the right) to determine BTC's (chart on the left) price action in the coming months.
Based on VIX's Channel Down, the fact that it broke below its 1W MA50 (blue trend-line) and now is rebounding indicates that BTC may be entering a weekly consolidation phase. As you can see on VIX's chart, every time it broke below the 1W MA50 and started rising, Bitcoin entered a multi-week consolidation phase that sometimes was quick and others many months in length. Its 1W RSI is also at a level that relates to all those consolidation phases.
In our opinion this consolidation has more probabilities of being similar to December 04 2023 - January 29 2024, as the post August 2024 rally resembles more the rally that started on August 2023. This highlights the high degree of symmetry within Bitcoin's 2-year Channel Up.
If it continues to replicate that huge Bullish Leg, then we might as well see the rally peaking upon a +195.27% rise again. That could target $145000 by May 2025, which technically would also be marginally above the 1.5 Fibonacci Channel extension, similar to the March 11 2024 High.
So what do you think? Is it possible for Bitcoin to enter a multi-week consolidation now? Feel free to let us know in the comments section below!
-------------------------------------------------------------------------------
** Please LIKE 👍, FOLLOW ✅, SHARE 🙌 and COMMENT ✍ if you enjoy this idea! Also share your ideas and charts in the comments section below! This is best way to keep it relevant, support us, keep the content here free and allow the idea to reach as many people as possible. **
-------------------------------------------------------------------------------
💸💸💸💸💸💸
👇 👇 👇 👇 👇 👇

Bullish Patterns and Bitcoin: A Roadmap to $125KAs anticipated by many, following Trump’s election, Bitcoin experienced a significant surge. On November 14th, it encountered its first notable correction during this upward momentum.
In early December, Bitcoin crossed the critical 100k milestone for the first time. However, this achievement was followed by a swift pullback.
Since then, dips have consistently been met with strong buying activity, and as of now, the price has stabilized comfortably above this key psychological level.
The price action since mid-November reveals the formation of an ascending channel, a technical pattern that historically suggests a 70% probability of continuation to the upside.
A decisive breakout above 107k could confirm this bullish scenario, with a measured target for the next leg up around 125k if the pattern fulfills its statistical expectation.

Bitcoin Analysis ==>>Ready for Correction!!!Bitcoin ( BINANCE:BTCUSDT ) is moving in the Resistance zone($102,280-$101,000) . (We saw the fake break ).
According to the theory of Elliott waves , it seems that Bitcoin has succeeded in completing 5 impulsive waves , and we should wait for corrective waves .
Signs of the completion of the main wave 5 in the one-hour time frame:
1-BTC broke the Uptrend lines .
2- Shooting Star Candlestick Pattern formation
3- Regular Divergence(RD-) between Consecutive Peaks.
I expect Bitcoin to fall to at least the Support zone($99,600-$98,000) in the coming hours .
⚠️Note: If Bitcoin goes above $102,540, we should expect a new All-Time High(ATH).⚠️
⚠️Note: If the Support zone($99,600-$98,000) is broken, we should wait for Bitcoin to fall at least to $96,500.⚠️
Bitcoin Analyze (BTCUSDT), 1-hour time frame⏰.
🔔Be sure to follow the updated ideas.🔔
Do not forget to put Stop loss for your positions (For every position you want to open).
Please follow your strategy and updates; this is just my Idea, and I will gladly see your ideas in this post.
Please do not forget the ✅' like '✅ button 🙏😊 & Share it with your friends; thanks, and Trade safe.

BITCOIN The three Expansion Phases of the Cycle.We have talked about Bitcoin (BTCUSD) hitting the $100k Target on numerous analyses and one of those was almost 4 months ago (August 26, see chart below), where we introduced the 2-year Channel Up, which has been the dominant pattern since the very beginning of the new Bull Cycle:
That piece of analysis was on the 1M time-frame but today we will examine it from the 1W perspective as the horizon narrows. We have made some slight modifications and the one that stands out is that we've classified it on Expansion Phases.
The key characteristic of those was the mid-Phase consolidation, which on the previous 2 took place within the 0.382 - 0.5 Fibonacci range, while the 1W RSI also turned sideways for the first time since the Channel Up bottomed.
With this marker, the consolidation phase is easily identifiable and according to it, we are currently on once. As a result, we can assume that we are within the 0.382 - 0.5 Fib range of Expansion Phase 3. This indicates that there is still plenty of room to rise. Based on that, a $150k Target is technically plausible before Summer.
So do you expect to reach 150000 so fast, if we do at all during this Cycle? Feel free to let us know in the comments section below!
-------------------------------------------------------------------------------
** Please LIKE 👍, FOLLOW ✅, SHARE 🙌 and COMMENT ✍ if you enjoy this idea! Also share your ideas and charts in the comments section below! This is best way to keep it relevant, support us, keep the content here free and allow the idea to reach as many people as possible. **
-------------------------------------------------------------------------------
💸💸💸💸💸💸
👇 👇 👇 👇 👇 👇

BITCOIN This is why $250k is a Cycle Top candidateBitcoin (BTCUSD) is now cruising on the Bull Cycle's most aggressive phase, the Parabolic Rally. We got the final confirmation as it broke above and now established the 1st Standard Deviation from Above (grey trend-line) of the Mayer Multiple Bands (MMB) as the new Support.
Having already broken above the previous All Time High (ATH) Resistance, every time BTC flipped the 1st SD into Support while above the ATH, it hit at least the 2nd SD (orange trend-line) before the Cycle Top was priced. This level is currently at $181700 but rising along with the trend
What adds a more specific dynamic to the potential Cycle Top though, is that during Bitcoin's 11-year Higher Lows trend-line growth, it posted rallies of at least +1719% on each Cycle. As the Cycles progressed and due to the Law of Diminishing Returns, this rally started lower each time.
This shows the great significance of this rally and as a result, on the current Cycle with can estimate from its very bottom (November 2022). This suggests that we can reach at least $250k before or around the time the 2nd SD is tested. In addition, all Cycles have topped after the 1M RSI makes contact with its historic Lower Highs trend-line.
So what do you think? Is $250k a strong candidate for a Cycle Top? Feel free to let us know in the comments section below!
-------------------------------------------------------------------------------
** Please LIKE 👍, FOLLOW ✅, SHARE 🙌 and COMMENT ✍ if you enjoy this idea! Also share your ideas and charts in the comments section below! This is best way to keep it relevant, support us, keep the content here free and allow the idea to reach as many people as possible. **
-------------------------------------------------------------------------------
💸💸💸💸💸💸
👇 👇 👇 👇 👇 👇

Bitcoin Analysis==>>FallingBitcoin ( BINANCE:BTCUSDT ) is breaking the Support zone($99,600-$98,620) and the lower line of the Descending channel .
According to the theory of Elliott waves , Bitcoin was able to complete Double Three Correction(WXY) .
I expect Bitcoin to fal l at least as far as the width of the descending channel(broken) .
⚠️Note: We can expect more pumps if Bitcoin goes over $99,900. ⚠️
🙏Please respect each other's ideas and express them politely if you agree or disagree.🙏
Bitcoin Analyze (BTCUSDT), 1-hour time frame⏰.
🔔Be sure to follow the updated ideas.🔔
Do not forget to put Stop loss for your positions (For every position you want to open).
Please follow your strategy and updates; this is just my Idea, and I will gladly see your ideas in this post.
Please do not forget the ✅' like'✅ button 🙏😊 & Share it with your friends; thanks, and Trade safe.

Don't Worry its Bull RUN Bitcoin 100K SoonBINANCE:BTCUSDT
Dont Worry its opportunity for buying
keep buying
its buying zone for BTC
and from today alts coins also pump
my target is 104K in btc

Is Bitcoin Losing Momentum? Correction to 85K LikelyYesterday, Bitcoin experienced another drop, falling from above 100K and reaching a low of just over 94K, briefly touching the ascending trendline that dates back to the time of Trump’s election.
While the price action since November 5 has been characterized by higher highs and higher lows—usually a sign of bullish momentum—the broader structure appears to signal a potential reversal. This pattern suggests that Bitcoin is struggling to sustain its highs, raising doubts about its ability to maintain upward momentum, at least for now.
Although a new all-time high remains a possibility, I believe it is unlikely that Bitcoin will hold gains above 100K for an extended period. Instead, the more probable scenario involves a correction toward the 85K level.
A critical area to monitor lies between 92,500 and 93,000. A decisive break below this support zone would confirm my bearish outlook and could signal the beginning of a deeper correction.

BITCOIN nothing to stop it now! Can top anywhere inside 250-400kMore than 1 year ago (September 05 2023, see chart below), we published the following Bitcoin (BTCUSD) idea, which very illustratively presented the potential course of the new Bull Cycle:
As you can see, BTC managed to trade an entire year rising within this green Arc pattern and always below the Cyclical Pivot trend-line that emerged from the bottom of the 2018 Bear Cycle.
We made the last update on this chart last August (20 2024), where we called the end of the 5-month correction since March and the start of the new Phase (final Parabolic Rally) of the Bull Cycle.
** The key hold of the 1W MA50 **
The key for that call was the fact that the 1W MA50 (blue trend-line) held twice during the August sell-off and supported. As you can see, on all of BTC Bull Cycles, the 1W MA50 has been supporting post Halving and never broke until after the Top and the start of the new Bear Cycle.
** Symmetry of pre and post-Having **
Given that historically the Bull Cycle lasts post-Halving almost the time it lasted from the bottom to the Halving, we should expect its top around December 2025 - January 2026 and if it is on the Cyclical Pivot trend-line, then it could be as high as 400k.
However, even on a less optimistic scenario where it lasts 1064 days (152 weeks) from the Bottom (not counting FTX crash), like the 2015 - 2017 Bull Cycle, we can expect a peak a little over $200000 on the Cyclical Pivot trend-line.
** The 1W RSI series of Tops **
It is important to notice that the 1W RSI is recovering from the overbought volatility correction, having dropped from a massively overbought 88.50 High (March 04) to a practically bearish 45.00 Low (September 02). As this chart shows, BTC tends to top on levels similar to the first 1W RSI of the Cycle, so there is still a lot of way to go before it tops, especially if it follows the 2015 - 2017 Bull Cycle, which had four almost symmetrical such Tops.
But what do you think? Are you also expecting Bitcoin to top anywhere within a $250 - $400k range? Feel free to let us know in the comments section below!
-------------------------------------------------------------------------------
** Please LIKE 👍, FOLLOW ✅, SHARE 🙌 and COMMENT ✍ if you enjoy this idea! Also share your ideas and charts in the comments section below! This is best way to keep it relevant, support us, keep the content here free and allow the idea to reach as many people as possible. **
-------------------------------------------------------------------------------
💸💸💸💸💸💸
👇 👇 👇 👇 👇 👇

Bitcoin is going to the Moon PART 2! [S #3 B]How nice, hit all 3 targets from the original post in not even 2 days...
NOW FOR PART TWO!
I have added a few more targets, TP4, TP5, and TP6.
We are currently going up high in altitude and going to be reaching our planet's atmosphere very soon! We should the reach the moon in no time!
Bitcoin may dip a bit from the current price but should still make a new ATH.
I will be going a bit into what I call my "special indicator" that successfully helped me make the last few recent signals.
I call it "MarketAnalyzer FX Alpha 1" and it honestly has been doing a splendid job.
It is pointing upwards for Bitcoin, hopefully it won't take too long to hit our next target.
Entry:
***USE LOW LEVERAGE IF ANY AT ALL***
$79,200-$80,000 (Original posts entry)
If you have not entered yet, new entry could be $86,000-$89,000
TP1: $82,742 ✅
TP2: $85,132 ✅
TP3: $82,742 ✅
TP4: $90,800
TP5: $98,200
TP6: $110,000
For those that have the good entry of $79k-$80k I would move SL to entry.
If entering the current entry point, $85,000.
----------------------------------------------------------------------------------------------
***ALL ANALYSIS, SIGNALS, AND ANY CONTENT IS FOR EDUCATIONAL PURPOSES
ONLY AND ARE NOT MEANT TO BE PROFITED OFF.***
----------------------------------------------------------------------------------------------

Bitcoin Roadmap==>>Short term!!!Bitcoin ( BINANCE:BTCUSDT ) started to pump up late yesterday with the following three News and the important resistance of $100,000 seems to be broken:
1- Federal Reserve Chair Jerome Powell: Bitcoin is like gold( OANDA:XAUUSD ), not dollars.
2- President Putin says, “Bitcoin, Digital Assets will continue to develop".
3- 'Who's Laughing Now?' NYC Mayor Eric Adams Boasts About Bitcoin Paychecks
⚠️Note: As I said in previous posts, the crypto market has become more dependent on the news and reacts to any development or news in the world, so capital management should be observed more than before.⚠️
Let's now look at the analysis of Bitcoin after yesterday's pump .
Bitcoin is currently moving in the Potential Reversal Zone(PRZ) and near the Support zone($99,600-$98,620) .
According to the theory of Elliott waves , Bitcoin seems to be completing wave 4 , and we should wait for the start of wave 5 . The wave 4 structure is a Zigzag correction(ABC/5-3-5) .
I expect Bitcoin to start increasing again after the end of wave 4 and attack the Resistance line . If the resistance line breaks, it can at least go up to the previous top($104,088) .
⚠️Note: We should wait for Bitcoin to fall further if Bitcoin goes below the Support line and the Support zone($99,600-$98,620).⚠️
⚠️Note: Due to the Sharpie movement of wave 3, BTC may not even create a new All-Time High(ATH) (wave 5 will be Truncated). ⚠️
🙏Please respect each other's ideas and express them politely if you agree or disagree.🙏
Bitcoin Analyze (BTCUSDT), 15-minute time frame⏰.
🔔Be sure to follow the updated ideas.🔔
Do not forget to put Stop loss for your positions (For every position you want to open).
Please follow your strategy and updates; this is just my Idea, and I will gladly see your ideas in this post.
Please do not forget the ✅' like '✅ button 🙏😊 & Share it with your friends; thanks, and Trade safe.

BITCOIN Where were you when it broke $100000 ??It is officially history! Bitcoin (BTCUSD) finally broke the ultimate (until the next one!) psychological level of $100000. A price tag that was discussed as myth/ desire/ utopia not so many years ago. Perhaps the level that will go down in history as the future global currency's transition from its retail to the institutional phase (thanks Blackrock!) and on its way towards an eventual mass adoption (Amazon, X, Netflix and others are you listening?).
Well this post isn't an analysis. It's a festive one, a well deserved round of victory for HODLers who ignored for so many year the pessimists, the negative ones, the "Bitcoin is a scam", "Bitcoin is a fraud", "Bitcoin is going to zero" ones and kept holding. And those who will keep holding until perhaps $1000000? Who knows? Who can now deny it??
Well, lets have it. In the future you are going to hear the following a lot.
"Where were you daddy/ mommy/ grandpa/ grandma, when Bitcoin broke $100000?"
Indeed, and it will be a valid question. This will be bigger than the classics of why didn't you buy Amazon, Google etc in the late 90s/ early 00s. Or Gold in the early 1900s (yes great grandpa, that's for you!).
So let's wrap it up and this is a call for all of you to answer it and make a fun discussion in the comments section below:
" WHAT WERE YOU DOING WHEN BITCOIN BROKE $100k??? "
-------------------------------------------------------------------------------
** Please LIKE 👍, FOLLOW ✅, SHARE 🙌 and COMMENT ✍ if you enjoy this idea! Also share your ideas and charts in the comments section below! This is best way to keep it relevant, support us, keep the content here free and allow the idea to reach as many people as possible. **
-------------------------------------------------------------------------------
💸💸💸💸💸💸
👇 👇 👇 👇 👇 👇

BITCOIN repeating the November 2023 Channel and targets $140kBitcoin (BTCUSD) has been trading within a Channel Up in the past three weeks, basically for the majority of the month of November, following the U.S. elections. It may been struggling currently to break above the $100000 psychological barrier but historical patterns are in favor of a break-out as the very same Channel Up was formed exactly 1 year ago and paved the way for the March 14 2024 High.
** August 2023 vs August 2024 **
As you can see basically, BTC's whole sequence since the August 05 2024 Low is very similar to the one that started again a year before that in August 2023. The similarities are uncanny. Both fractals started with an August decline below the 1D MA200 (orange trend-line), bottoming inside a Cup pattern that initiated an Accumulation Process. At the same time, the 1D RSI was waving a Bullish Divergence as it has been rising on Higher Lows.
** Golden Cross to November Channel Up **
A 1D Golden Cross was formed right when the November Channel Up patterns emerged. By that time, the price was already on the 2.0 Fibonacci extension of the August decline. At the moment we are on the stage past a 1D MACD Death Cross, which led to a December bullish break-out to a new High.
** Next step = $140k **
A mere test of the 3.0 Fibonacci extension, would translate to a $140k price tag on Bitcoin. Based on the striking similarities and extremely high degree of symmetry with the pattern a year ago, it may become a reality as early as February 2025.
But what do you think? Is symmetry with last year about to kick in and force a bullish break-out to 140k? Feel free to let us know in the comments section below!
-------------------------------------------------------------------------------
** Please LIKE 👍, FOLLOW ✅, SHARE 🙌 and COMMENT ✍ if you enjoy this idea! Also share your ideas and charts in the comments section below! This is best way to keep it relevant, support us, keep the content here free and allow the idea to reach as many people as possible. **
-------------------------------------------------------------------------------
💸💸💸💸💸💸
👇 👇 👇 👇 👇 👇

BITCOIN $150k doesn't seem so unrealistic now, does it?Almost 4 months ago (August 14, see chart below), we made a bold prediction of a Bitcoin (BTCUSD) target at $150000 by early 2025, while the price was still at $60k:
This was received with a lot of skepticism at the time but with the price now almost on the $100k psychological barrier, the idea looks more and more realistic. It is time to revisit this chart and made some slight modifications based on the price action that was followed.
The price is now off the 0.786 - 1.0 Fibonacci range where it consolidated from March 2024 until October 2024. The enormous rise/ break-out is attributed of course to a large extent on the U.S. elections and the euphoria that followed. We are only 1 month outside this range and the price is already much higher.
Last month's candle is very similar to November 2020 and May 2017. In comparison, that was when the most aggressive (parabolic) rallies of those Bull Cycles started. In 2017 from May to December, it was on a 71.5° angle. On the next Cycle from November 2020 to April 2021, it was on a 68.5° angle, i.e. 3° lower. If that's a progression by any means, then we can assume that the 2024 - 2025 parabolic rally could be on a 65.5° angle (-3° from the previous Cycle). That gives a potential target of $300k as early as May 2025, assuming we could have a Double Top Cycle as in 2021.
In any case, it will be interesting to see if the current Cycle also makes a blow-off top (like the last two) outside/ above the Channel Up that started back on the December 2013 High. Unrealistic as it may seem now, the $150k Target is very plausible technically as it is just below the top of that multi-year Channel Up. If the $300k blow-off top (red Arcs) comes, then all the better, but a long-term investor may consider to start taking profits while the price is inside the Channel Up and starts being cautious once we break above it in the red Arcs.
So what do you think? Do you view $150k as technically realistic as this pattern indicates? And if so, can Bitcoin even make a blow-off top near $300k? Feel free to let us know in the comments section below!
-------------------------------------------------------------------------------
** Please LIKE 👍, FOLLOW ✅, SHARE 🙌 and COMMENT ✍ if you enjoy this idea! Also share your ideas and charts in the comments section below! This is best way to keep it relevant, support us, keep the content here free and allow the idea to reach as many people as possible. **
-------------------------------------------------------------------------------
💸💸💸💸💸💸
👇 👇 👇 👇 👇 👇

Bitcoin will Go Down Again!?Yesterday's data, including GDP , Core PCE , and Unemployment Claims , indicate persistent inflationary pressures and a relatively strong U.S. labor market. This could increase the likelihood of continued hawkish monetary policy from the Federal Reserve , typically strengthening the dollar and putting downward pressure on risk assets like Bitcoin( BINANCE:BTCUSDT ) .
Conversely, if markets interpret these figures as nearing the end of the Fed's rate hike cycle , it could be a bullish signal for Bitcoin .
Bitcoin has managed to break the Ascending Channel in the last two days. (as I expected in the previous post ).
Currently, Bitcoin is moving in the Resistance zone($97,642-$97,180) and near the lower line of the ascending channel and Important Resistance line . Yesterday's upward movement can be considered a pullback to the ascending channel (broken). One of the signs of the completion of a pullback can be the Shooting Star Candlestick Pattern ( You can see this pattern in the 4-hour time frame ).
According to the theory of Elliott waves, Bitcoin seems to be completing a corrective wave , a Zigzag corrective(ABC) wave structure.
Also, considering that USDT.D%( CRYPTOCAP:USDT.D ) will again follow an upward trend and BTC.D%( CRYPTOCAP:BTC.D ) will follow a downward trend , Bitcoin may be corrected again. Maybe the conditions( In terms of Correction ) of Altcoins will be better than Bitcoin.
I expect Bitcoin to start falling again after the pullback completes , and the first target is the CME Gap($93,835-$93,720) , and then attack the Support zone($90,000-$88,700) again.
🙏Please respect each other's ideas and express them politely if you agree or disagree.🙏
⚠️Note: If Bitcoin goes above Resistance zone($97,642-$97,180), we can expect it to touch $100,000.⚠️
Bitcoin Analyze (BTCUSDT), 1-hour time frame⏰.
🔔Be sure to follow the updated ideas.🔔
Do not forget to put Stop loss for your positions (For every position you want to open).
Please follow your strategy and updates; this is just my Idea, and I will gladly see your ideas in this post.
Please do not forget the ✅' like '✅ button 🙏😊 & Share it with your friends; thanks, and Trade safe.

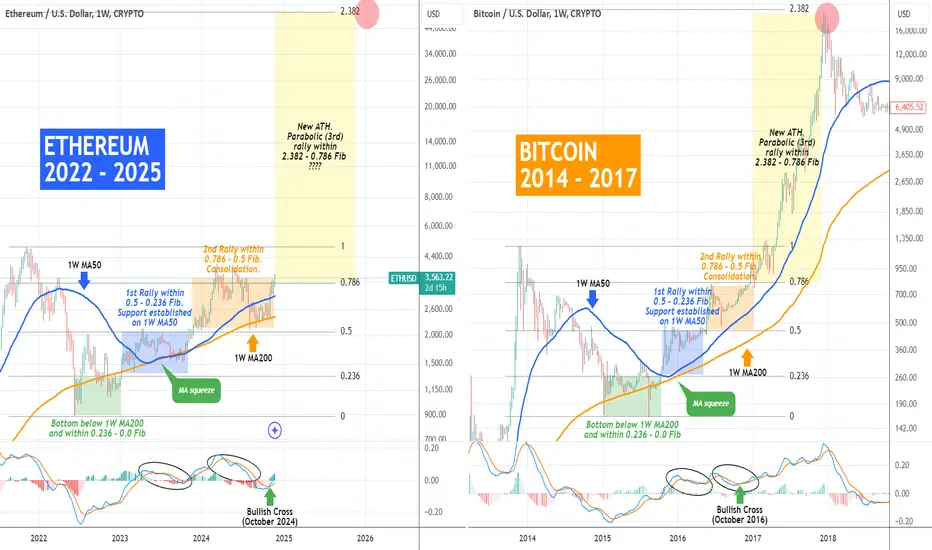
ETHEREUM Is it copying Bitcoin's 2014/17 Cycle towards $50k???Ethereum (ETHUSD) hasn't yet made a new All Time High (ATH), in contrast to Bitcoin (BTCUSD) but that isn't necessarily a negative development as it can highlight its enormous upside potential.
** ETH 2022/25 vs BTC 2014/17 **
A idea that strengthens this notion is today's analysis where you see ETH's current (2022 - 2025) Cycle against BTC's 2014 - 2017. As you can see so far the two Cycle's have been very similar with Ethereum replicating both the Bear Cycle and so far the majority of Bitcoin's past Bull Cycle.
** The Phases **
For more efficient comparison purposes, we have classified the Cycle in phases with the start being the bottom formation (Green Phase) below the 1W MA200 (orange trend-line) and within the 0.236 - 0.0 Fibonacci Zone. That gives way to the 1st rally (Blue Phase) within the 0.5 - 0.236 Fib with the 1W MA50 (blue trend-line) established as the Support. What follows is the 2nd Rally (Orange Phase) within the 0.786 - 0.5 Fib Zone and consolidation.
** October Bullish Cross and $50k?? **
The October 1W MACD Bullish Cross (Oct 2016 for BTC, Oct 2024 for ETH) signals the transition to the final stage (Yellow Phase) of the Bull Cycle, the Parabolic Rally to new ATH. For Bitcoin that peaked near the 2.382 Fibonacci extension. If that seems unrealistic for Ethereum's price today (the 2.382 Fib is just above $50k!!) in terms of market cap (and rightly so) just consider the impact that the ETFs' capital inflows have on the market. It remains to be seen, but nonetheless, ETH has enormous upside from here onwards and we're sure that even a +100% rally from the current price would be welcomed by the majority of the market.
-------------------------------------------------------------------------------
** Please LIKE 👍, FOLLOW ✅, SHARE 🙌 and COMMENT ✍ if you enjoy this idea! Also share your ideas and charts in the comments section below! This is best way to keep it relevant, support us, keep the content here free and allow the idea to reach as many people as possible. **
-------------------------------------------------------------------------------
💸💸💸💸💸💸
👇 👇 👇 👇 👇 👇
BITCOIN TARGETING ALL TIME HIGHS - BTC LONG IDEAI projected and shared the idea that Bitcoin would reach $70,000 and potentially $73,000 within a few days. It happened in just two days! I hope you took the trade and made some profits, as I did.
Now, I’m preparing to position myself with the expectation that we’ll reach all-time highs within a week or two.
We recently broke a massive bearish trendline that has held since March 2024. Just before that, a daily demand zone formed, which helped break the trendline, making it a key area for me. Additionally, the equilibrium level of the bullish leg aligns perfectly with my point of interest.
I expect the price to retrace to the daily demand zone, hit the discount Fibonacci area, test the trendline, and take off from there toward new all-time highs.
Of course, I’ll be looking for lower time-frame confirmations before initiating a long position.

BITCOIN Happy Thanksgiving with history on Bulls' side!!Happy Thanksgiving to everyone! As every year, we pay our tribute on this day with a historic run of Bitcoin (BTCUSD) on Thanksgiving days! Last year (see chart below) we made a $80000 call for today and we couldn't be happier that the market surpassed that:
This year we bring you a (much) simpler fact and that's the number of bearish signals on that day. Bitcoin has lived through 14 Thanksgiving days (excluding of course today) and only 3 have resulted in immediate bearish activity (2021, 2014 and 2013). Even the November 23 2017 Thanksgiving that was near the Cycle top, gave another 3 years of +150% gains before peaking.
You can see the previous Thanksgivings by scrolling left through the chart but it is obvious that due to BTC's cyclical behavior, the vast majority of Thanksgiving is an excellent time to invest. And today is no different as we still have almost another full year of Bull Cycle ahead of us (even more so its most aggressive part!).
Whatever trading actions you decide to make today, we wish you a blessed Thanksgiving!
So do you think this is a buy opportunity as history suggests? Feel free to let us know in the comments section below!
-------------------------------------------------------------------------------
** Please LIKE 👍, FOLLOW ✅, SHARE 🙌 and COMMENT ✍ if you enjoy this idea! Also share your ideas and charts in the comments section below! This is best way to keep it relevant, support us, keep the content here free and allow the idea to reach as many people as possible. **
-------------------------------------------------------------------------------
💸💸💸💸💸💸
👇 👇 👇 👇 👇 👇

BITCOIN rejected on the 1st real Resistance of the Bull Cycle.Yesterday's brutal Bitcoin (BTCUSD) rejection caught the majority of the market off guard. There are a few fundamental reasons, there is the exhaustion of the post-election euphoria, there is the psychological weight of the $100000 barrier. However there is one major technical reason that has gone under the radar and we'll explain it to you below.
** The Fibonacci Channel and the 0.236 Fib **
As you can see on this chart, the underlying pattern has been a Fibonacci Channel going through the last 3 Cycles (including the current one). The pattern started with a strong rebound on its bottom (green circle) that formed the December 2013 Top. That Cycle Top was on the 0.236 Fibonacci level of the Cycle and that is a level that rejected rallies during Bull Cycles on June 24 2019 and May 11 2024.
** The '1st Real Resistance of the Bull Cycle' **
That is the Fib trend-line that (more recently) rejected the uptrend on November 22. We can call this the '1st Real Resistance of the Bull Cycle' as this is the first major rejection level that a Bull Cycle faces before the eventual Top. That high during the last 2 Cycles has been on the 0.0 Fibonacci level, technically the top of the Channel (red circles). The red spot on the current Cycle in late 2025 doesn't represent a projection but is an illustration for comparison purposes.
** Top timing and the 1W MA50 **
On a side-note, it is interesting to observe that the duration of each of the past Bull Cycles has been roughly 150 weeks (1050 days) so a repeat of this pattern would give us a High towards the end of September/ early October. It is much better to try to time the High and sell that put an actual price tag on it. Equally interesting is the fact that even though BTC is on a technical rejection, the current rally started on the August 05 2024 Low, exactly on the 1W MA50 (blue trend-line). Technically, as long as this trend-line holds, the cyclical bullish wave should stay intact.
But what do you think? Do you think the 0.236 Fib i.e. the '1st Real Resistance of the Bull Cycle' will extend the correction? Feel free to let us know in the comments section below!
-------------------------------------------------------------------------------
** Please LIKE 👍, FOLLOW ✅, SHARE 🙌 and COMMENT ✍ if you enjoy this idea! Also share your ideas and charts in the comments section below! This is best way to keep it relevant, support us, keep the content here free and allow the idea to reach as many people as possible. **
-------------------------------------------------------------------------------
💸💸💸💸💸💸
👇 👇 👇 👇 👇 👇
