Bitcoin Correction Started!?Bitcoin ( BINANCE:BTCUSDT ) started pumping again today with the help of the following two News :
1-Chinese Court Declares Bitcoin and Crypto Ownership Legal.
2-Trump Plans White House Crypto Advisor Role.
These days, Bitcoin is more influenced by the news than before.
Bitcoin managed to break the Important resistance lines with the help of the above news .
Since Bitcoin does NOT have a previous price history at current prices , its analysis is associated with challenges, but I will try to analyze it for you with technical analysis tools and other parameters .
Bitcoin reacted well to the new Potential Reversal Zone(PRZ) .But Bitcoin could not touch the magic number of $100,000 ; one of the reasons for not touching this number is many sell orders that were exactly on the number of $100,000.
According to the Elliott wave theory , Bitcoin has entered five new impulsive waves after breaking the important resistance lines. It completed the main wave 5 .
It seems that we can wait for Bitcoin correction waves .
In terms of Classic Technical Analysi s, Bitcoin seems to be completing the Bump phase and entering the Run phase of the Bump-and-Run Top Pattern .👇
It also seems that USDT.D% ( CRYPTOCAP:USDT.D ) will have an upward trend , which can cause Bitcoin correction .
I expect Bitcoin to attack the lower line of the ascending channel after approaching the Resistance zone($97,642-$97,180) .
🙏Please respect each other's ideas and express them politely if you agree or disagree.🙏
⚠️ Note: If Bitcoin goes above $98,700, we can expect it to touch $100,000. ⚠️
⚠️ Note: Bitcoin can start to rise again from the lower line of the ascending channel. ⚠️
⚠️ Note: We should expect a deeper correction if Bitcoin goes below the Support zone($95,600-$92,000) and breaks the lower line of the ascending channel ⚠️
Bitcoin Analyze (BTCUSDT), 1-hour time frame⏰.
🔔Be sure to follow the updated ideas.🔔
Do not forget to put Stop loss for your positions (For every position you want to open).
Please follow your strategy and updates; this is just my Idea, and I will gladly see your ideas in this post.
Please do not forget the ✅' like '✅ button 🙏😊 & Share it with your friends; thanks, and Trade safe.
Bitcoinsignals

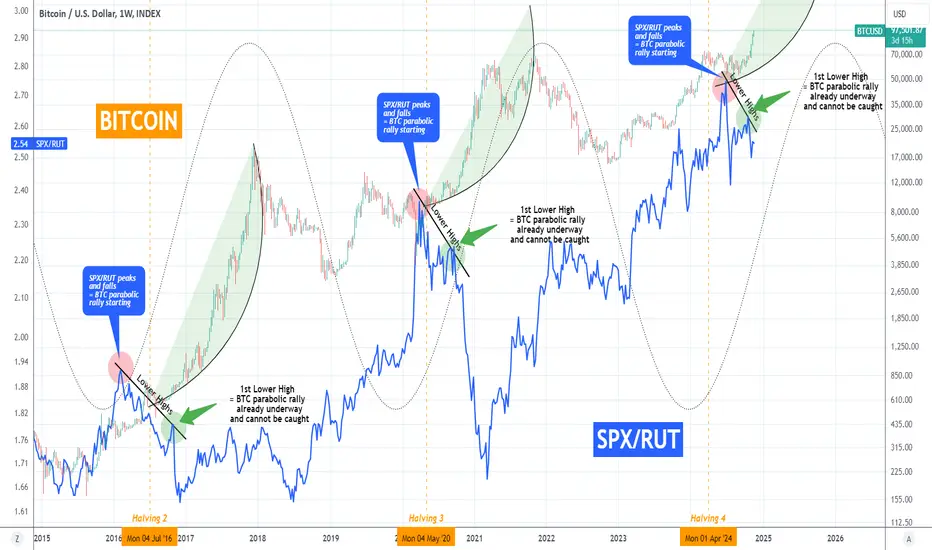
BITCOIN rally cant get caught anymore and SPXRUT ratio shows whyIt's beyond doubt now that Bitcoin (BTCUSD) has started the new Parabolic Rally (PR), technically the most aggressive phase of the Bull Cycle. We've made numerous analyses in the past explaining on time why we expected this break-out to take place after 7 months of accumulation.
What we bring to you today is the SPX/RUT ratio, the correlation of the S&P500 (SPX) and Russell 2000 (RUT) indices against BTC and how it confirms that this rally will now accelerate to a pace that it won't be easy to get caught (i.e. bought).
The SPX/RUT ratio is displayed by the blue trend-line. The ratio is particularly helpful during Bitcoin's Parabolic Rally phase as their correlation is mostly a negative one, meaning when the ratio falls, Bitcoin rises. On this chart, this correlation is present on a cyclical basis. This means that during every Cycle, it displays a behavioral pattern that is common.
The key characteristic here is the Lower Highs pattern that the ratio forms every Cycle around the Halving time. As you can see, when SPX/RUT peaks (red circle) and starts forming Lower Highs, Bitcoin stars its Parabolic Rally (green arc). On the 1st Lower High, BTC's rally is already underway and has entered the stage where due to the sheer buying pressure and aggression, getting an entry is difficult. The Lower Highs on SPX/RUT also signify a shift from big capitalization stocks to low, i.e. an increasing appetite for riskier assets and that transcends to the Bitcoin market as well.
So what do you think? Does the SPX/RUT ratio indicate that we've started the part of BTC's rally that is hard to catch? Feel free to let us know in the comments section below!
-------------------------------------------------------------------------------
** Please LIKE 👍, FOLLOW ✅, SHARE 🙌 and COMMENT ✍ if you enjoy this idea! Also share your ideas and charts in the comments section below! This is best way to keep it relevant, support us, keep the content here free and allow the idea to reach as many people as possible. **
-------------------------------------------------------------------------------
💸💸💸💸💸💸
👇 👇 👇 👇 👇 👇
BITCOIN Pi Cycle Theory aiming at $120k at least!Following Bitcoin's (BTCUSD) new All Time High in the aftermath of the U.S. elections, we've established on previous posts that we've entered the final year (12 months) of this Bull Cycle. This is clearly visible by the use of the Sine Waves as shown on this 1W chart.
** Pi Cycle **
The new aspect we're bringing to you today is the Pi Cycle indicator, which has proven to be as consistent as any other at projecting the long-term price action of Bitcoin. As you can see every Cycle Top has been considerably above the Top Pi Band (red trend-line) and we're currently trading $30k below where this level is now. This means that it is only a matter of time for BTC to 'attack' $120k and break it.
** 1W RSI kickstarting the aggression **
We are at a point where the new rally phase that started after the price tested, held and rebounded on the 1W MA50 back in early August, will start getting more and more aggressive. The final bullish signal was given last week after the 1W RSI closed above 70.00 (vertical orange dashed line). As you can see, during the previous two Cycles, every time Bitcoin closed the 1W RSI above 70.00, the Cycle peaked 54 weeks later (roughly 365 days). There is no reason to expect otherwise this time also, as this projected date (week of November 24 2025) falls exactly on the Sine Wave's Top.
Notice also that during the most aggressive part of the Parabolic Rally, the 1D MA100 (blue trend-line) tends to Support. And before that, when that crosses above the Bottom Pi band (green trend-line), the indicator gives a confirmed buy signal for the whole Cycle.
** Timing the market is everything **
The question now is how high can the price get? Well according to those estimates, a peak above the Top Pi Band can be anywhere within the $150k - $200k range, and that could be a conservative estimate. But lucky enough, with technical tools like the one we present to you today, we can time the market (thus our exits/ sells) almost perfectly and get out as high as possible, without having an absolute Target in mind.
But what do you think? Are you also expecting the rally to start getting even more aggressive and break above $120k? Feel free to let us know in the comments section below!
-------------------------------------------------------------------------------
** Please LIKE 👍, FOLLOW ✅, SHARE 🙌 and COMMENT ✍ if you enjoy this idea! Also share your ideas and charts in the comments section below! This is best way to keep it relevant, support us, keep the content here free and allow the idea to reach as many people as possible. **
-------------------------------------------------------------------------------
💸💸💸💸💸💸
👇 👇 👇 👇 👇 👇

BITCOIN Riding the 1DMA50 wave is the best strategy you can haveBitcoin (BTCUSD) has had an enormous bullish break-out to new All Time Highs (ATH) following last week's U.S. elections. The past 2 days have seen this massive rally turn sideways and as always a certain part of market participants have started calling for big corrections or even bear markets. Once again we will let simple charting show why this sideways price action is nothing but a short-term and mostly necessary consolidation.
** November 2020 vs November 2024 **
This analysis is a comparison of BTC's October 2020 - April 2021 rally with October 2024 - today. We've made idea regarding those time periods in the past but this time we bring a more aggressive picture on the 1D time-frame.
As you can see, on both fractals the 1D RSI started with a Channel Up while the price was still trading sideways/ consolidating within the 1W MA50 (red trend-line) and the Resistance level. That was the first sign of the upcoming Parabolic Rally, which was confirmed after the price broke above the Resistance.
BTC formed a Channel Up itself and right now we are on the November Bullish Leg and its consolidation phase (circle) that has been evident on both fractals. The 2020 - 2021 rally lasted for 164 days after November 01 and rose by +395%.
** The key role of the 1D MA50 **
Even if these time and price lengths aren't replicated, the key here for traders and investors alike is this: From October 09 2020 up until April 18 2021, BTC neve closed a 1D candle below its 1D MA50 (blue trend-line). It was the 1D MA50 that fully supported this 6-month rally, giving excellent buy entries for those seeking dip buying opportunities or those who simply wanted to hold onto their BTCs for as high as possible.
** Just ride the wave **
As a result, a viable and confirmed strategy at this stage of the Cycle (if you don't want to trade the volatility and buy low/ sell why) could be to just sell when finally a 1D candle closes below the 1D MA50. This is what we effectively call 'riding the 1D MA50 wave'.
So what do you think? Are you prepared to hold until the 1D MA50 breaks, are you willing to buy every time the price gets close to it, or simply have a different strategy at this starge? Feel free to let us know in the comments section below!
-------------------------------------------------------------------------------
** Please LIKE 👍, FOLLOW ✅, SHARE 🙌 and COMMENT ✍ if you enjoy this idea! Also share your ideas and charts in the comments section below! This is best way to keep it relevant, support us, keep the content here free and allow the idea to reach as many people as possible. **
-------------------------------------------------------------------------------
💸💸💸💸💸💸
👇 👇 👇 👇 👇 👇

Bitcoin Analysis==>>First Attack Will Fail!?Bitcoin ( BINANCE:BTCUSDT ) is moving near the Potential Reversal Zone(PRZ) and Important Resistance lines .
I don't expect Bitcoin to be able to break the important resistance lines in the first attack . What do you think !?
Bitcoin managed to form a New All-Time High again today.
According to the Elliott wave theory , Bitcoin seems to be completing the main wave 3 or even main wave 5 in the 1-hour time frame , which can end in a Potential Reversal Zone(PRZ) .
I expect Bitcoin to drop to Cumulative Long Liquidation Leverage and then to $88,000 in the coming hours .
Fear and Greed Index is Extreme Greed (84-87).
For a better understanding , I suggest you look at the analysis below in the weekly time frame .👇
Bitcoin Analyze (BTCUSDT), 1-hour time frame⏰.
🔔Be sure to follow the updated ideas.🔔
Do not forget to put Stop loss for your positions (For every position you want to open).
Please follow your strategy and updates; this is just my Idea, and I will gladly see your ideas in this post.
Please do not forget the ✅' like '✅ button 🙏😊 & Share it with your friends; thanks, and Trade safe.

Bitcoin | In Satoshi V Trust Gentlemen welcome to BULL MARKET
The price of Bitcoin is $28,280 today with a 24hour trading volume of 45 billion dollars This represents a 4% price increase in the last 24 hours and a 40% price increase in the past 7 days
When iconic US investment bank Lehman Brothers Holdings Inc. filed for bankruptcy in 2008, it shook people’s faith in banks so much that a new class of asset, which did not have the backing of any formal bank, came into being. Bitcoin, the most popular cryptocurrency, first found a mention in November 2008, about two months after the Lehman crisis. A decade later, cryptocurrencies have become one of the most debated financial assets, globally and in India, in terms of risk and returns. now in 2023 Banks fails even bigger and bitcoin is here to shine
Right now all big companies including Amazon, Microsoft, BlackRock, BridgeWater ... got an eye on crypto and buying the dip while the old banking system shows its flaws
all indicators sending bullish signal and be ready for 28500, 28700 and 28900$

BITCOIN buying pressure indeed stronger than any Cycle before!Three months ago (August 12, see chart below) we published our view on Bitcoin (BTCUSD) claiming that on the current levels and compared to the relative stages it was in previous Cycles, the bullish trend was stronger than ever before:
At the time the price was 'just' at GETTEX:59K and yesterday it touched the $90000 level. This shouldn't surprise you as the pattern has been 'playing out' in a similar way to both the 2019 - 2021 and 2015 - 2017 Bull Cycles.
In fact it is so strong that we now need to readjust the green parabolic channel of the current (2023 - 2025) Bull Cycle to a more aggressive pattern in order to fit the enormous rally that started in September.
As you can see this comparison with the previous Cycles suggests that BTC can reach at least the -0.618 Fibonacci extension, which is a little over $170000, like the other two did. It also highlights how the current Cycle has been more aggressive than the previous as the price reached the All Time High faster (March 2024) than the previous two but also the amazing symmetry among them as the current (final) parabolic rally that started on the August 05 2024 bottom took place 90 weeks (630 days) after the November 2022 bottom. As you see both in 2020 and 2016 the final parabolic rally also started 90 weeks after their respective Cycle bottoms.
So do you agree that the current rally shows the current buying pressure is more aggressive than in previous Cycles at this stage? Feel free to let us know in the comments section below!
-------------------------------------------------------------------------------
** Please LIKE 👍, FOLLOW ✅, SHARE 🙌 and COMMENT ✍ if you enjoy this idea! Also share your ideas and charts in the comments section below! This is best way to keep it relevant, support us, keep the content here free and allow the idea to reach as many people as possible. **
-------------------------------------------------------------------------------
💸💸💸💸💸💸
👇 👇 👇 👇 👇 👇

Bitcoin Analysis==>>Where is the End of the Rally!?Bitcoin ( BINANCE:BTCUSDT ) was able to start a new rally after breaking the upper line of Descending Broadening Wedge Pattern .
Bitcoin is moving near the Potential Reversal Zone(PRZ) , the Resistance lines , the middle line of Pitchfork , and the Time Reversal Zone(TRZ) .
According to the Elliott wave theory , Bitcoin is near to completing the Main wave 5 in PRZ .
Also, Regular Divergence(RD-) between Consecutive Peaks in MACD and RSI Indicators .
I expect Bitcoin will decrease after touching the Resistance lines to fill the important CME Gap($77,360-$80,670) .
⚠️Note: We can expect more pumps if Bitcoin breaks the Potential Reversal Zone(PRZ) ⚠️==Low possible.
What is your idea of Bitcoin being able to touch $100,000 during the current week❗️❓
Bitcoin Analyze (BTCUSDT), Weekly time frame⏰.
Do not forget to put Stop loss for your positions (For every position you want to open).
Please follow your strategy and updates ; this is just my Idea, and I will gladly see your ideas in this post.
Please do not forget the ✅' like '✅ button 🙏😊 & Share it with your friends; thanks, and Trade safe.
🔔Be sure to follow the updated ideas.🔔

Bitcoin is going to the moon! [S3]Signal #3 for my new signal series.
Bitcoin is extremely bullish right now and parabolic, its been bullish for a while now but the momentum remains strong and lots of bull flags remain positive.
----------------------------------------------------------------------------------------------
***ALL ANALYSIS, SIGNALS, AND ANY CONTENT IS FOR EDUCATIONAL PURPOSES
ONLY AND ARE NOT MEANT TO BE PROFITED OFF.***
----------------------------------------------------------------------------------------------
Like I stated in my first signal, I will not be going in big depth on the TA for the signal posts I make, I will make educational posts going more in depth on that soon though.
This post is mainly based on price action, momentum, and some indicators of mine.
Entry:
$79,200-$80,000
Targets:
TP1: $82,742
TP2: $85,132
TP3: $82,742
Stop Loss:
$74,305
----------------------------------------------------------------------------------------------
***ALL ANALYSIS, SIGNALS, AND ANY CONTENT IS FOR EDUCATIONAL PURPOSES
ONLY AND ARE NOT MEANT TO BE PROFITED OFF.***
----------------------------------------------------------------------------------------------

BITCOIN Can it repeat last year and reach $140000?It was less than a month (October 14, see chart below) when we updated our old Bitcoin (BTCUSD) Channel Up idea of June 07, calling for the confirmed start of the new Bullish Leg of the Channel Up and setting a medium-term Target of $94500:
New evidence following the U.S. elections suggest that the aggressive nature of the past weekly rally can see BTC target even higher, more specifically the top of the Channel Up by Q2 2025.
As you can see, the price is currently between the 0.5 - 0.618 Fibonacci Channel range, which is technically a neutral zone. However it is considerably below the 0.618 horizontal Fib level applied on a potential +198.10% rise (same as the Sep 2023 - March 2024 rally). This showcases the enormous upside potential that exists within this 2-year Channel Up.
The RSI is about to enter the Overbought Zone (>70.00), which when the previous two Bullish Legs started was also while the price was below the 0.618 Fib (especially in the case of the October 20 2023 candle).
As a result, even though our 94500 medium-term Target stands, for the long-term we are targeting 140000, which is almost at the top of the 2-year Channel Up and marginally below a potential +198.11% rise. Notice that the two lengthy corrections (green Rectangles) within the pattern started only when the RSI formed a Lower High below the overbought level (<70.00).
So what do you think? Is Bitcoin still so undervalued at the moment, despite last week's surge, that it can even hit $140k? Feel free to let us know in the comments section below!
-------------------------------------------------------------------------------
** Please LIKE 👍, FOLLOW ✅, SHARE 🙌 and COMMENT ✍ if you enjoy this idea! Also share your ideas and charts in the comments section below! This is best way to keep it relevant, support us, keep the content here free and allow the idea to reach as many people as possible. **
-------------------------------------------------------------------------------
💸💸💸💸💸💸
👇 👇 👇 👇 👇 👇

BTC is heading forward to unbelievable high records Hello traders and good morning,
As I said before, if you were following my analysis about the BTC and crypto in general, I have given an analysis about the.Bullish strong bullish momentum and said that price is going to reach the $100K very soon if the market of the Bitcoin keeps this strong bullish momentum.The the price ended in a high volatility.And reached an all time high. What we'll see in this month, which is the month before the last month of the year.If that bullish strong bullish momentum is kept well, the price will hit.And the nine $90,000 level and then in the last month, which is December.We will have a historical high level of Bitcoin if the buyers are still keeping that strong bullish momentum and eventually the price will hit.The $100K.Level, which will bea historical.All time high record, so please keep watching the market and.Make sure to.Get benefit of this bullish move and good luck everyone.
Well, talk to you later and good luck.

Bitcoin Roadmap!!!(New ATH)Bitcoin( BINANCE:BTCUSDT ) started pumping after it was almost certain that Donald Trump was the future president of the United States because Donald Trump announced his support for cryptocurrency during the last year .
In terms of Classic Technical Analysis , Bitcoin started pumping with the help of the Descending Broadening Wedge Pattern . ( Educational ).
Bitcoin has already managed to break the Heavy Resistance zone($73,900-$70,900) , but it has entered an important Potential Reversal Zone(PRZ) ; we have to see how long it can continue.
According to the Elliott wave theory , Bitcoin succeeded in completing the Double Three Correction(WXY) and is currently completing wave 4 .
I expect Bitcoin to start rising again from one of the Targets I have identified on the chart and at least rise to the upper line of the ascending channel . It probably needs Bitcoin correction to create another New All-Time High(ATH) .
⚠️If Bitcoin goes below the Heavy Resistance zone($73,900-$70,900), we should expect more dumps.⚠️
Bitcoin Analyze (BTCUSDT), 1-hour time frame⏰.
🔔Be sure to follow the updated ideas.🔔
Do not forget to put Stop loss for your positions (For every position you want to open).
Please follow your strategy and updates; this is just my Idea, and I will gladly see your ideas in this post.
Please do not forget the ✅' like '✅ button 🙏😊 & Share it with your friends; thanks, and Trade safe.

Bitcoin - Time to buy again!I was just waiting for the elections to be over. Now, it can be said that Bitcoin can reach $100,000 next year, and I believe in this. Technically, the price managed to break the megaphone, and this is confirmed when two or three candles close above this resistance. If this happens, you know better than I do what will happen next !!!
Give me some energy !!
✨We spend hours finding potential opportunities and writing useful ideas, we would be happy if you support us.
Best regards CobraVanguard.💚
_ _ _ _ __ _ _ _ _ _ _ _ _ _ _ _ _ _ _ _ _ _ _ _ _ _ _ _ _ _ _ _
✅Thank you, and for more ideas, hit ❤️Like❤️ and 🌟Follow🌟!
⚠️Things can change...
The markets are always changing and even with all these signals, the market changes tend to be strong and fast!!
BINANCE:BTCUSDT

BITCOIN made new ATH and the rally has only just begun!Bitcoin (BTCUSD) is marching towards our 88k short-term Target as we called on October 16 (see chart below):
As the U.S. elections have now been concluded with Trump's victory, we can now once more focus on the long-term horizon, particularly looking 1 year ahead.
Basically, the last time we looked at this pattern was back in August 14 2023 (see chart below), where we used the KSI indicator on the 3W time-frame, which has just made a Bullish Cross, to call the upcoming parabolic rally correctly:
This time we bring to you the last bullish signal of the upcoming multi-month Parabolic Rally, which is the 2W LMACD that is about to form a Bullish Cross. As you can see such a Cross was formed exactly on the November 08 2016 U.S. elections (Trump's 1st win), and a few months before the November 03 2020 elections. What followed was the most aggressive rally (green Rectangle area) of the Bull Phase (green parabolic channel) that started when the price broke above the 2W MA50 (blue trend-line).
As a result, we expect BTC to rise aggressively from here, entering the post-U.S. elections bullish phase that may very well exceed the $100k psychological barrier, as we've shown in previous analyses.
But what do you think? Will the new ATH today spark a full year of Bull for Bitcoin? Feel free to let us know in the comments section below!
-------------------------------------------------------------------------------
** Please LIKE 👍, FOLLOW ✅, SHARE 🙌 and COMMENT ✍ if you enjoy this idea! Also share your ideas and charts in the comments section below! This is best way to keep it relevant, support us, keep the content here free and allow the idea to reach as many people as possible. **
-------------------------------------------------------------------------------
💸💸💸💸💸💸
👇 👇 👇 👇 👇 👇

Bitcoin Falling Again==>>Short-term!!!Bitcoin ( BINANCE:BTCUSDT ) is currently moving near the Resistance lines and in the Resistance zone($69,580-$68,800) .
Regarding Elliott's wave theory , it seems that Bitcoin is still completing Corrective Waves . The Structure of Correction Waves looks like Double Three Correction(WXY) .
I expect Bitcoin to Go Down at least Cumulative Long Liquidation Leverage after breaking the Uptrend line .
⚠️Note: We can expect more pumps if Bitcoin can break the Resistance zone($69,580-$68,800) .⚠️
⚠️Note: The American elections and the tension between Iran and Israel can easily change the scenarios of Bitcoin: if the tension between Iran and Israel increases, we can see the fall of Bitcoin, and if Donald Trump does not succeed in the US presidential election, we can see the fall of Bitcoin. And vice versa.⚠️
Bitcoin Analyze (BTCUSDT), 15-minute time frame⏰.
🔔Be sure to follow the updated ideas.🔔
Do not forget to put Stop loss for your positions (For every position you want to open).
Please follow your strategy and updates; this is just my Idea, and I will gladly see your ideas in this post.
Please do not forget the ✅' like '✅ button 🙏😊 & Share it with your friends; thanks, and Trade safe.

BITCOIN fully supported targeting $170k after the ATH breaks.Exactly 3 months ago (August 05, see chart below) when the price was on the 1W MA50 (blue trend-line), having hit it for the first time since the week of March 12 2003, we claimed that this was the last stand for Bitcoin (BTCUSD) if the market wanted to maintain the Bull Cycle, as based on the previous 3 Cycles, it was the absolute supporting trend-line:
The 1W MA50 eventually held not once but twice and that gave way to a rally that last week tested the 73800 All Time High (ATH). That is incredibly bullish, especially only two days before the U.S. elections, as from the historic patterns we've shown you before, a Parabolic Rally has started after each election.
So according to our August comparison chart, if history is repeated, BTC is looking towards at least the 1.618 Fibonacci extension from the ATH, which is roughly a little over $170k.
But what do you think? Are you expecting the ATH test to start a massive rally similar to all previous Cycles? And if so, is $170000 a realistic Target? Feel free to let us know in the comments section below!
-------------------------------------------------------------------------------
** Please LIKE 👍, FOLLOW ✅, SHARE 🙌 and COMMENT ✍ if you enjoy this idea! Also share your ideas and charts in the comments section below! This is best way to keep it relevant, support us, keep the content here free and allow the idea to reach as many people as possible. **
-------------------------------------------------------------------------------
💸💸💸💸💸💸
👇 👇 👇 👇 👇 👇

Bitcoin Roadmap==>Short term!!!Bitcoin ( BINANCE:BTCUSDT ) touched the 🎯 Targets 🎯 as I expected in the previous post ✅.
Bitcoin started to rise well from the Support zone($67,620-$67,000) and the Support line again ( the start was accompanied by good momentum ).
Regarding Elliott's wave theory , wave 5 seems to be completed .
I expect Bitcoin to rise to at least the Support zone after breaking the Resistance lines .
⚠️Note: The American elections and the tension between Iran and Israel can easily change the scenarios of Bitcoin: if the tension between Iran and Israel increases, we can see the fall of Bitcoin, and if Donald Trump does not succeed in the US presidential election, we can see the fall of Bitcoin. And vice versa.⚠️
Bitcoin Analyze (BTCUSDT), 15-minute time frame⏰.
🔔Be sure to follow the updated ideas.🔔
Do not forget to put Stop loss for your positions (For every position you want to open).
Please follow your strategy and updates; this is just my Idea, and I will gladly see your ideas in this post.
Please do not forget the ✅' like '✅ button 🙏😊 & Share it with your friends; thanks, and Trade safe.

Bitcoin Analysis==>>DUMP==>>Filling GapsBitcoin ( BINANCE:BTCUSDT ) is currently moving in the Support zone ($70,100-$68,420) and near the Support line .
According to Elliott's wave theory , Bitcoin was able to complete main wave 4 ( although with a little irregular movement ).
I expect Bitcoin will break the Support line soon , and the main wave 5 can be finished in one of the Potential Reversal Zones(PRZs) and filling the CME Gaps one by one .
Bitcoin Analyze (BTCUSDT), 15-minute time frame⏰.
🔔Be sure to follow the updated ideas.🔔
Do not forget to put Stop loss for your positions (For every position you want to open).
Please follow your strategy and updates; this is just my Idea, and I will gladly see your ideas in this post.
Please do not forget the ✅' like '✅ button 🙏😊 & Share it with your friends; thanks, and Trade safe.

BITCOIN Closed 2 straight green 1M candles after 7 months!Bitcoin (BTCUSD) is closing today the monthly (1M) candle and unless it drops by 7000 in a few hours, it will close the month of October in green. That will be the 2nd straight green 1M candle since March!
This 7 month consolidation period is no stranger to BTC as such patterns, where there are no straight green 1M candles, are standard Accumulation Phases that we see during Bull Cycles. So far on the current one we've had three (including March 2024) and once the market closed 2 straight green 1M candles, it rallied.
The 2019 - 2021 Bull Cycle had three such straight green candle occasions and a very clear Accumulation Phase, while the 2015 - 2018 Cycle had numerous. One thing is clear based on this multi-year chart. When the market closes two straight green 1M candles, it is always a good signal to buy.
But what do you think? Do you find this indicator reliable? Are you buying based on this? Feel free to let us know in the comments section below!
-------------------------------------------------------------------------------
** Please LIKE 👍, FOLLOW ✅, SHARE 🙌 and COMMENT ✍ if you enjoy this idea! Also share your ideas and charts in the comments section below! This is best way to keep it relevant, support us, keep the content here free and allow the idea to reach as many people as possible. **
-------------------------------------------------------------------------------
💸💸💸💸💸💸
👇 👇 👇 👇 👇 👇

Bitcoin Analysis==>>New All-Time High(ATH) is Loading!!!For a better view of Bitcoin ( BINANCE:BTCUSDT ), I suggest you read yesterday's post first.👇
As I expected, Bitcoin corrected to the Support zone($72,000-$70,820) and is currently moving in a descending channel(small) .
According to Elliott wave theory , Bitcoin has completed wave 4 and we should wait for wave 5 .
I expect Bitcoin will touch New All-Time High(ATH) soon. (After breaking the upper line of the ascending channel).
⚠️Note: If Bitcoin falls below the Support zone($72,000-$70,820), it may fall further.⚠️
Bitcoin Analyze (BTCUSDT), 15-minute time frame⏰.
🔔Be sure to follow the updated ideas.🔔
Do not forget to put Stop loss for your positions (For every position you want to open).
Please follow your strategy and updates; this is just my Idea, and I will gladly see your ideas in this post.
Please do not forget the ✅' like '✅ button 🙏😊 & Share it with your friends; thanks, and Trade safe.

Bitcoin- Consolidation before ATH, but what next?At this moment, a new all-time high for BINANCE:BTCUSD seems likely, especially given the consolidation just below the previous ATH and the technical target from the small symmetrical triangle, which could push BTC above 75k soon.
However, I think the broader push everyone anticipates may not materialize.
Even if BTC briefly surpasses 80k, a 10-15% gain might not mean much in the grand scheme.
The media frenzy and crypto influencers projecting Bitcoin to pass 100k by year-end raise some caution for me.
I anticipate a peak around 80k or so, followed by a pullback into the familiar 50k–70k range, rather than a sustained breakout.
In summary, while I may buy in the short term, I’ll be closely watching for signs of weakness.
If these appear, I’ll switch to a short position, as I believe a false breakout from this flag pattern is a realistic scenario.

Bitcoin Roadmap!!!Bitcoin ( BINANCE:BTCUSDT ) moved as ✅I expected in the previous post .
Bitcoin is moving near the Potential Reversal Zone(PRZ) and the upper line of the ascending channel .
According to Elliott's wave theory, Bitcoin is completing wave 3 . I expect the Bitcoin rally will need a Correction to continue near the All Time-High(ATH) .
I expect Bitcoin to drop down to the Support zone($72,000-$70,820) and Support line .
🔔Let's first short position, and I will try to update for the long position.🔔
⚠️Note: If Bitcoin falls below the Support zone($72,000-$70,820), it may fall further.⚠️
Bitcoin Analyze (BTCUSDT), 1-hour time frame⏰.
🔔Be sure to follow the updated ideas.🔔
Do not forget to put Stop loss for your positions (For every position you want to open).
Please follow your strategy and updates; this is just my Idea, and I will gladly see your ideas in this post.
Please do not forget the ✅' like '✅ button 🙏😊 & Share it with your friends; thanks, and Trade safe.

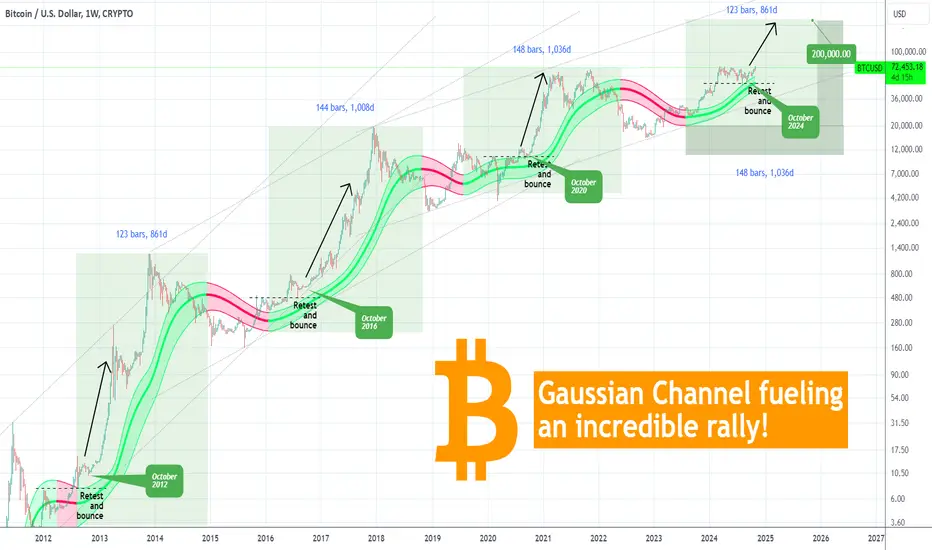
BITCOIN Gaussian Channel telling you the rally has already begunBitcoin (BTCUSD) is illustrated here on the 1W time-frame from the 2011 Cycle until today. We've used the Gaussian Channel (GC) after a long time and the reason is simple. Since the August 05 2024 Low, it has been supporting the uptrend up to today's test of the All Time High (ATH).
** Gaussian October support every 4 years **
This continuous support is a critical feature moving forward as every time the GC held at this stage of the previous Cycles (October 2020, 2016 and 2012), BTC started its final (and most aggressive) Parabolic Rally of the Cycle.
** Resistance turned Support **
What's equally interesting is that during those stages, the price also re-tested and held the former Resistance (of the previous Higher High), turned it into a Support (while the GC held) and bounced to the Parabolic Rally. This is a remarkably consistent feature taking place every 4 years!
** The green GC length matters **
Now as to the GC in more detail. What we want you to keep from it, is that the green part of the GC has lasted in the previous Cycles 123, 144 and 148 weeks respectively, which translates to 861, 1008 and 1036 days, until it turned red. As a result, we can expect the current green phase to last until December 08 2025 (minimum) and June 01 2026 (maximum). It is more reasonable to expect the longer case as the recent Cycles tend to have stabilized most of their common time patterns.
The Bear Cycle tends to start when a 1W candle is closed below the GC. Until then, based on the parallel Channel Up patterns that encompass 3 Cycles each time, we can even expect a price as high as $200000 for this Cycle Top.
Do you think that's realistic? And if so, do you also expect the GC wave to support a parabolic rally all the way to the top? Feel free to let us know in the comments section below!
-------------------------------------------------------------------------------
** Please LIKE 👍, FOLLOW ✅, SHARE 🙌 and COMMENT ✍ if you enjoy this idea! Also share your ideas and charts in the comments section below! This is best way to keep it relevant, support us, keep the content here free and allow the idea to reach as many people as possible. **
-------------------------------------------------------------------------------
💸💸💸💸💸💸
👇 👇 👇 👇 👇 👇