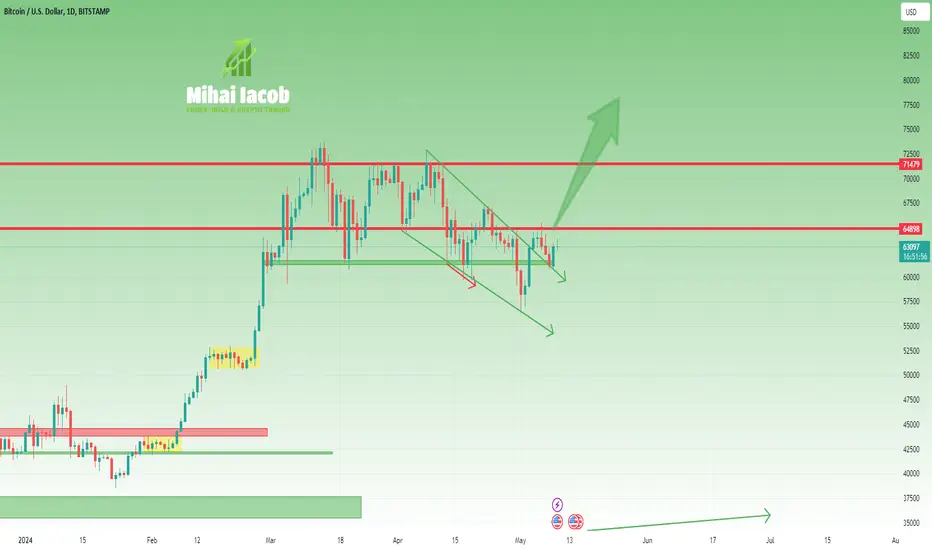
Bitcoin- would it finally break resistance?
After reaching an all-time high in March, BITSTAMP:BTCUSD started to consolidate between 61k and 71k, with a false breakdown in the final days of April. Following this false break, the price once again reached the resistance zone last week and is now consolidating again.
The overall trend remains clearly bullish, and the chart structure over the last three months is somewhat similar to the December-February consolidation.
Considering these factors, I remain bullish on Bitcoin and expect a rise to the 80k zone, if not higher. Only a price drop below 60k would change this bullish outlook.
Bitcoinsignals

BITCOIN There is no turning back from this.Bitcoin (BTCUSD) has started the 5th Bullish Wave of the current Bull Cycle, following the consolidation of the past 2 months. Since the November 2022 bottom we have had 4 such waves with consolidations ranging from 1 month to 6 months (blue Channel of April 10 - October 10 2023). The current wave can technically take Bitcoin up to $100k alone.
What is even more bullish than that though is the fact that the whole (ellipse) structure since the October 2023 Low, resembles the sequences of April 2020 - March 2021 and May - December 2017. As you can see, both were Bullish Legs of the 7-year Channel Up. Symmetrically, it appears that we are past its 2nd consolidation (blue circle) and starting the final rally to the Top of the Channel Up.
That means that the Cycle Top can even be marginally higher than $200k until the 1W MA50 (blue trend-line) is breached again (note that we are past a 1W Bullish Cross also) which can make us start considering a Bull Cycle again.
But what do you think? Is this rise just the start of a wave that will take BTC to 100000 even 200000 if history repeats itself? Feel free to let us know in the comments section below!
-------------------------------------------------------------------------------
** Please LIKE 👍, FOLLOW ✅, SHARE 🙌 and COMMENT ✍ if you enjoy this idea! Also share your ideas and charts in the comments section below! This is best way to keep it relevant, support us, keep the content here free and allow the idea to reach as many people as possible. **
-------------------------------------------------------------------------------
💸💸💸💸💸💸
👇 👇 👇 👇 👇 👇

BTCUSDSell on the theory markets ranges 70% of the time, and sell on the theory markets retraces HALF of the previous leg 90% of the time. 4h candle cluster breakdown (yellow support line) confirms the bias.

🚨Bitcoin will Fall by Failed Falling Wedge Pattern🚨❌ Bitcoin failed to break the 🔴 Resistance zone($65,700-$67,520) 🔴.
📈From the point of view of Classical Technical Analysis , the Failing Wedge pattern failed, and since if the reversal pattern fails , the pattern will have a continuing role , the Bitcoin fall is still expected.
🔔I expect Bitcoin to continue its downward trend after the rise to the lower line and 🟡 Potential Reversal Zone(PRZ) 🟡again.
❗️⚠️Note⚠️❗️: If Bitcoin touches $65,500 , the bullish scenario can change, I will talk about the importance of this number in the next posts .
❗️⚠️Note⚠️❗️: An important point you should always remember is capital management and lack of greed.
Bitcoin Analyze ( BTCUSDT ), 1-hour time frame ⏰.
Do not forget to put Stop loss for your positions (For every position you want to open).
Please follow your strategy; this is just my Idea, and I will gladly see your ideas in this post.
Please do not forget the ✅' like '✅ button 🙏😊 & Share it with your friends; thanks, and Trade safe.

BITCOIN 1st green week after 4 red! Have we finally bottomed??Bitcoin (BTCUSD) closed the first green 1W candle following a streak of 4 red ones, so it has been the first week in almost 1 month. That alone is a strong bullish sign, especially on the very aggressive Channel Up on the 1W time-frame (chart on the left).
As you can see, every consolidation that is formed after a Higher High (red Rectangle) ends and transcends to the new Bullish Leg (green) when then first 1W candle is formed (circles). The previous (2) Higher Highs have been priced around the 2.786 Fibonacci extension, so the Channel's top and the Fib extension give us a projected Target Zone of $100k - $120k by the start of August.
Even on the lower 1D time-frame (chart on the right), we have the strongest possible bullish break-out confirmation as after BTC held the 1W MA20 (red trend-line) and rebounded, its 1D RSI broke above its Lower Highs trend-line and the following day the price itself broke above its own Lower Highs. This creates the probability for an Inverse Head and Shoulders pattern (IH&S), which technically targets the 2.0 Fibonacci extension level ($78000). The only confirmation left to make is to close above the 1D MA50 (blue trend-line), which provided the last strong rejection on April 23.
So what do you think? Is this the start of a new strong rally for Bitcoin and if yes what target are you pursuing yourself? Feel free to let us know in the comments section below!
-------------------------------------------------------------------------------
** Please LIKE 👍, FOLLOW ✅, SHARE 🙌 and COMMENT ✍ if you enjoy this idea! Also share your ideas and charts in the comments section below! This is best way to keep it relevant, support us, keep the content here free and allow the idea to reach as many people as possible. **
-------------------------------------------------------------------------------
💸💸💸💸💸💸
👇 👇 👇 👇 👇 👇

🗺️Bitcoin Roadmap🗺️⏰(15-minute time frame)⏰🌐 Bitcoin seems to have started to increase under the influence of Ethereum ETF news ➕ Inflows into Bitcoin ETFs hit $237 million on Monday .
🏃♂️ Bitcoin is currently moving near the 🔴 Resistance zone($73,780-$71,920) 🔴 and the Resistance line .
🌊According to the Elliott wave theory , Bitcoin seems to be completing microwave 4 of the main wave 5 .
🔔I expect Bitcoin to Attack the Resistance zone after the completion of micro wave 4 from the main wave 5 .
❗️⚠️Note⚠️❗️: An important point you should always remember is capital management and lack of greed.
Bitcoin Analyze ( BTCUSDT ), 15-minute time frame ⏰.
Do not forget to put Stop loss for your positions (For every position you want to open).
Please follow your strategy; this is just my Idea, and I will gladly see your ideas in this post.
Please do not forget the ✅' like '✅ button 🙏😊 & Share it with your friends; thanks, and Trade safe.

BITCOIN is going to 'attack' $150k next. Confirmed!Bitcoin (BTCUSD) is starting the next rally phase after the pre and post-Halving 2-month consolidation, a development that is consistent with both of its previous Cycles.
In fact, if traded around and above the Mayer Multiple Band (MMB) of 1 Standard Deviation (SD) above (gray trend-line), which is the exact same consolidation phase it had (blue ellipse) after every time the Bollinger Bands Width (BBW) bottomed (blue trend-line).
The astonishing symmetry among BTC's Cycles is evident also when using the Vortex Indicator (VI)- and the CCI both on the 2M time-frame. As you can see, every timr the VI- topped was when the CCI made hits 1st Higher Low following its own bottom. The distance between that point in time (vertical orange line) and the bottom of the BBW (vertical green line) has been around 180 days on each of the past 3 Cycles.
On the last two, Bitcoin topped within 560 - 595 days from the vertical orange line. As a result, we can expect the price to top by the week of March 17 2025 the earliest.
The most important part perhaps is that after each consolidation after the BBW bottom (blue ellipse), Bitcoin's immediate target was the MMB 3SD, which is the orange trend-line. That is currently at $125k but by the time the rally reaches it, it could be closer to $150k.
But what do you think? Do you feel that BTC is about to 'attack' $150k as its next target? Feel free to let us know in the comments section below!
-------------------------------------------------------------------------------
** Please LIKE 👍, FOLLOW ✅, SHARE 🙌 and COMMENT ✍ if you enjoy this idea! Also share your ideas and charts in the comments section below! This is best way to keep it relevant, support us, keep the content here free and allow the idea to reach as many people as possible. **
-------------------------------------------------------------------------------
💸💸💸💸💸💸
👇 👇 👇 👇 👇 👇

Bitcoin Analysis (It's time for Bears🐻🧸🐼)✅ As I expected , Bitcoin reached the 🔴 Resistance zone($65,700-$67,520) 🔴.
🌊According to Elliott's wave theory , Bitcoin is completing wave 5 .
💡Also, we can see Regular Divergence(RD-) between two Consecutive Peaks .
📈Looking at the Market Cap USDT Dominance% (USDT.D%) chart , I see that USDT.D% has completed its Zigzag correction(ABC/5-3-5) in the 🟢Support zone(4.72%-4.53%)🟢. We should expect at least a temporary growth of USDT.D% , which means that Bitcoin should have a minimal correction.👇
🔔I expect Bitcoin to start falling from the 🔴 Resistance zone($65,700-$67,520) 🔴 and continue falling to at least the 🟢 Support zone($65,700-$64,180) 🟢 and the 50_SMA(Daily) .
❗️⚠️Note⚠️❗️: An important point you should always remember is capital management and lack of greed.
Bitcoin Analyze ( BTCUSDT ), 2-hour time frame ⏰.
Do not forget to put Stop loss for your positions (For every position you want to open).
Please follow your strategy; this is just my Idea, and I will gladly see your ideas in this post.
Please do not forget the ✅' like '✅ button 🙏😊 & Share it with your friends; thanks, and Trade safe.

BITCOIN Can it reach $200k?Bitcoin (BTCUSD) is on yet another green 1M (monthly) candle and if it closes that way it will be the 8th in the last 9, a natural Bull Cycle rally. This is taking place around the former All Time High (ATH) level for the 3rd month in a row.
A similar consolidation (blue circle) took place during each and every past Cycle and every time a very strong rally (green zone) started after it. Parallel to that, the 1M RSI printed a short-term pull-back. When the 1M MACD hit its Lower Highs Zone, it was time to start taking profits as the Cycle Top was priced.
Based on this past Cycles model, $200k is a very plausible Target that would even be much lower than the top of the Parabolic Channel.
So what do you think? Will BTC go that high during this Cycle? Feel free to let us know in the comments section below!
-------------------------------------------------------------------------------
** Please LIKE 👍, FOLLOW ✅, SHARE 🙌 and COMMENT ✍ if you enjoy this idea! Also share your ideas and charts in the comments section below! This is best way to keep it relevant, support us, keep the content here free and allow the idea to reach as many people as possible. **
-------------------------------------------------------------------------------
💸💸💸💸💸💸
👇 👇 👇 👇 👇 👇

🚀Bitcoin will Go Up after Pullback🚀💡 Bitcoin managed to break the 🔴 Resistance zone($65,700-$64,180) 🔴, Resistance line and 50_SMA(Daily) yesterday.
💡 Bitcoin seems to be completing a pullback right now.
🌊Regarding Elliott wave theory , Bitcoin seems to have completed the main wave 3 above the resistance zone and is currently completing wave 4 .
📈In terms of Classic Technical Analysis , Bitcoin managed to break the resistance zone , resistance line, and 50_SMA(Daily) with the help of the Inverse Head and Shoulders Pattern . Bitcoin seems to have increased at least to the 🎯Target🎯 of this pattern.
💡Let's take a look at the Market Cap USDT Dominance% (USDT.D%) chart .
💡 USDT.D% seems to start falling after reaching the 🔴 Resistance zone(4.92%-4.87%) 🔴, which is in line with Bitcoin's analysis. ⚠️The scenario will change if USDT.D% can break the resistance zone⚠️.👇
🔔I expect Bitcoin to rise to the next 🔴 Resistance zone($65,700-$67,520) 🔴 after the completion of wave 4 (pullback) .
❗️⚠️Note⚠️❗️: If Bitcoin falls below the 🔴 Resistance zone($65,700-$64,180) 🔴, the scenario will change.
❗️⚠️Note⚠️❗️: An important point you should always remember is capital management and lack of greed.
Bitcoin Analyze ( BTCUSDT ), 2-hour time frame ⏰.
Do not forget to put Stop loss for your positions (For every position you want to open).
Please follow your strategy; this is just my Idea, and I will gladly see your ideas in this post.
Please do not forget the ✅' like '✅ button 🙏😊 & Share it with your friends; thanks, and Trade safe.

BTC. Weekly trading levels 13 - 17.05.2024During the week you can trade from these price levels. Finding the entry point into a transaction and its support is up to you, depending on your trading style and the development of the situation. Zones show preferred price ranges WHERE to look for an entry point into a trade.
If you expect any medium-term price movements, then most likely they will start from one of the zones.
Levels are valid for a week, the date is in the title. Next week I will adjust the levels based on new data and publish a new post.
The history of level development can be seen in my previous posts. They cannot be edited or deleted. Everything is fair. :)
----------------------------------------------
I don’t play guess the direction (that’s why there are no directional arrows), but zones (levels) are used for trading. We wait for the zone to approach, watch the reaction, and enter the trade.
Levels are drawn based on volumes and data from the CME. They are used as areas of interest for trading. Traded as classic support/resistance levels. We see the reaction to the rebound, we trade the rebound. We see a breakout and continue to trade on a rollback to the level. The worst option is if we revolve around the zone in a flat.
Do not reverse the market at every level; if there is a trend movement, consider it as an opportunity to continue the movement. Until the price has drawn a reversal pattern.
Don't forget to like Rocket and Subscribe!!! Comments are welcome. Feedback is very important to me!

BITCOIN Inverse H&S in full motion. Next stop = $100k.We have been expecting the Inverse Head and Shoulders (IH&S) to break-out above the Lower Highs trend-line since May 06 (see chart below) and Bitcoin (BTCUSD) dully delivered:
In fact, what we will do on this idea is simply update the Bullish Megaphone of May 02 and chart it inside a more fitting Channel Up:
The previous two IH&S bottom formations delivered a rise of around +95%. With the 1D MACD on the same Bullish Cross that was present on both of those bottoms, we are expecting the $100000 psychological target to be reached after July, which will even be a rise below +90%.
What is your take on this? Feel free to let us know in the comments section below!
-------------------------------------------------------------------------------
** Please LIKE 👍, FOLLOW ✅, SHARE 🙌 and COMMENT ✍ if you enjoy this idea! Also share your ideas and charts in the comments section below! This is best way to keep it relevant, support us, keep the content here free and allow the idea to reach as many people as possible. **
-------------------------------------------------------------------------------
💸💸💸💸💸💸
👇 👇 👇 👇 👇 👇

✈️Bitcoin is Ready to Pump✈️🏃♂️ Bitcoin is moving in the 🔴 Resistance zone($63,440-$62,690) 🔴
🌊According to the theory of Elliott waves , Bitcoin seems to be forming a main wave 3 (the next 5 impulsive waves).
📈In terms of Classic Technical Analysis , Bitcoin has succeeded in breaking the upper line of the Descending Broadening Wedge Pattern .
💡Looking at the chart of Market Cap USDT Dominance% (USDT.D%) , we can see that USDT.D% managed to break the Support line and expect a drop to the 🟢 Support zone(4.72%-4.53%) 🟢 as I expected in the " USDT.D% will ⚔️Attack⚔️ to Support zone again " post.👇
🔔I expect Bitcoin to rise to at least the 🔴 Resistance zone($65,700-$64,200) 🔴 and the 50_SMA(Daily) .
❗️⚠️Note⚠️❗️: An important point you should always remember is capital management and lack of greed.
Bitcoin Analyze ( BTCUSDT ), 1-hour time frame ⏰.
Do not forget to put Stop loss for your positions (For every position you want to open).
Please follow your strategy; this is just my Idea, and I will gladly see your ideas in this post.
Please do not forget the ✅' like '✅ button 🙏😊 & Share it with your friends; thanks, and Trade safe.

BITCOIN Is 150k by August realistic?Bitcoin (BTCUSD) started to rise again, which is very natural as it almost completed a -25% correction (normal during Bull Cycles) and closed yesterday above the 1D MA50 after two straight rejections.
The situation couldn't look better on the long-term charts as well, namely on 1W where it is at a cyclical stage (ellipse on the chart) where during past Cycles it started its most aggressive rally.
As you can see, BTC rebounded on the EMA Ribbon, after making a new All Time High (ATH) while also recovering the Mayer Multiple SD1 from above (grey trend-line). When those parameters got met in the past, Bitcoin always touched at least the MMB SD2 from above (orange trend-line).
Based on that, the next Target on this run is $150000. Do you think that would be realistic as early as the end of August? Feel free to let us know in the comments section below!
-------------------------------------------------------------------------------
** Please LIKE 👍, FOLLOW ✅, SHARE 🙌 and COMMENT ✍ if you enjoy this idea! Also share your ideas and charts in the comments section below! This is best way to keep it relevant, support us, keep the content here free and allow the idea to reach as many people as possible. **
-------------------------------------------------------------------------------
💸💸💸💸💸💸
👇 👇 👇 👇 👇 👇

Bitcoin Fail in the ⚔️Third Attack⚔️ on the Resistance zone⚠️First, I must say that the Consumer Price Index(CPI) rates will be published today ( so be careful about your positions when they are published ).
🏃♂️ Bitcoin is currently moving in the 🔴 Resistance zone($63,440-$62,690) 🔴 (this is the third time it has attacked this zone).
🌊According to Elliott wave theory , Bitcoin seems to be in corrective waves . ( If the 🔴Resistance zone🔴 breaks, the scenario will change again) .
🔔I expect Bitcoin to start going down after the completion of main wave B to complete main wave C and at least fall to the Support line .
❗️⚠️Note⚠️❗️: if Bitcoin can break the 🔴 Resistance zone($63,440-$62,690) 🔴, the scenario will be changed.
❗️⚠️Note⚠️❗️: An important point you should always remember is capital management and lack of greed.
Bitcoin Analyze ( BTCUSDT ), 15-minute time frame ⏰.
Do not forget to put Stop loss for your positions (For every position you want to open).
Please follow your strategy; this is just my Idea, and I will gladly see your ideas in this post.
Please do not forget the ✅' like '✅ button 🙏😊 & Share it with your friends; thanks, and Trade safe.

BITCOIN starting a mega rally. See when alts will follow.Bitcoin (BTCUSD) just completed the final consolidation phase (red Rectangle) that as per the price action of past Cycles, is the final stage before the 1-year rally to the new Top. As you can see alt coin market (black trend-line) tends to bottom after Bitcoin's rally has already started and when it turns sideways again for a few weeks.
Technically alts make that 2nd major Higher Low on their Cycle and rebound when BTC investors take some profits and direct a certain portion of capital to the riskier but more generous in terms of returns, altcoin market.
So if you're wondering what to do next, be bullish on BTC and as the new rally extends, start taking profits towards August and make sure you're invested in alts. The lower their dominance is by then, the better.
Do you agree with this approach? Feel free to let us know in the comments section below!
-------------------------------------------------------------------------------
** Please LIKE 👍, FOLLOW ✅, SHARE 🙌 and COMMENT ✍ if you enjoy this idea! Also share your ideas and charts in the comments section below! This is best way to keep it relevant, support us, keep the content here free and allow the idea to reach as many people as possible. **
-------------------------------------------------------------------------------
💸💸💸💸💸💸
👇 👇 👇 👇 👇 👇

BITCOIN Another 1D MA50 rejection. More bleeding ahead?Bitcoin (BTCUSD) broke again below the 1D MA100 (green trend-line) after the 3rd rejection on the 1D MA50 (blue trend-line) in almost 1 month (since the April 13 bearish break-out). If it stays unbroken, it is a far from ideal development as the 1-year price action has shown us that such a pattern risks making a Lower Low.
The technical structure since April 08 is a Channel Down nonetheless, so such feat is certainly possible on the short-term. As you can see from past 1D MA50 bearish break-outs, BTC tends to get more than 2 rejections and excluding January 2024, it has stayed below the 1D MA100 for longer.
What's interesting is that if that Lower Low is made, it wouldn't just make a 1D MA200 (orange trend-line) test, but would also almost complete a -30% decline from the recent All Time High. Something that during Bull Cycle rallies is perfectly natural for Bitcoin.
SO do you think the market will go for it?? Feel free to let us know in the comments section below!
-------------------------------------------------------------------------------
** Please LIKE 👍, FOLLOW ✅, SHARE 🙌 and COMMENT ✍ if you enjoy this idea! Also share your ideas and charts in the comments section below! This is best way to keep it relevant, support us, keep the content here free and allow the idea to reach as many people as possible. **
-------------------------------------------------------------------------------
💸💸💸💸💸💸
👇 👇 👇 👇 👇 👇

Bitcoin- Bullish Engulfing on retestAs I mentioned a few days ago, BITSTAMP:BTCUSD has broken above the descending resistance level of its downward channel. This breakout could signal the end of the recent correction.
Following the initial climb to the critical horizontal level at 65k, Bitcoin experienced another drop, testing the previously broken resistance level, which this time acted as support. Yesterday, we observed a strong bullish engulfing pattern at this level.
These are positive indicators for bulls, suggesting potential further upward movement in price. The key level to monitor is 65k, and a breakout above this level could pave the way for a new all-time high in the near future.
My outlook remains bullish.
✈️Bitcoin is Ready to Go Up✈️🏃♂️ Bitcoin is moving near the 🟡 Potential Reversal Zone(PRZ)($61,800-$60,900) 🟡 and 100_SMA(Daily) and Support lines .
🌊According to Elliott's wave theory , Bitcoin is completing corrective waves , most likely a Zigzag(ABC) corrective wave structure.
💡We can consider corrective waves in the form of a pullback to the upper line of the descending channel .
📈According to Classical Technical Analysis , Bitcoin seems to have formed a Falling Wedge pattern . ( Of course, it is not very standard ).
🔔I expect Bitcoin to start rising from the 🟡 PRZ 🟡 and at least rise to the 🔴 Resistance zone($65,650-$64,200) 🔴.
❗️⚠️Note⚠️❗️: An important point you should always remember is capital management and lack of greed.
Bitcoin Analyze ( BTCUSDT ), 1-hour time frame ⏰.
Do not forget to put Stop loss for your positions (For every position you want to open).
Please follow your strategy; this is just my Idea, and I will gladly see your ideas in this post.
Please do not forget the ✅' like '✅ button 🙏😊 & Share it with your friends; thanks, and Trade safe.

BITCOIN Nothing to stop this Channel reaching 100k.Bitcoin (BTCUSD) is trading within the Rally Channel (green) with the price having already reached its bottom, making the 2nd Higher Low of the pattern. This is the very same pattern that emerged in the previous Cycle after the Growth Channel Up and took BTC to its new All Time High (ATH) at the time.
Both Growth Channels had a crash event below them, the previous Cycle even had a bubble event above it (Libra euphoria). But once the 1W MA50 (blue trend-line) turned into a Support after the Halving, the Bitcoin rally never looked back.
The 1W STOCH indicator, which is very similar to the past Cycle as well, shows that we might even be much earlier in the Cycle symmetrically than we think of. In any case the next two Higher Highs for the Rally Channel are $100k and $140k.
But what do you think? Are those Targets even plausible, let alone achievable by the end of Summer? Feel free to let us know in the comments section below!
-------------------------------------------------------------------------------
** Please LIKE 👍, FOLLOW ✅, SHARE 🙌 and COMMENT ✍ if you enjoy this idea! Also share your ideas and charts in the comments section below! This is best way to keep it relevant, support us, keep the content here free and allow the idea to reach as many people as possible. **
-------------------------------------------------------------------------------
💸💸💸💸💸💸
👇 👇 👇 👇 👇 👇

BITCOIN Mega Global Liquidity Buy Signal triggered!Bitcoin (BTCUSD) has seen a major buy signal getting triggered at the end of last month, that few are aware of. Our dominant circulating liquidity + High Yield corporate bonds formula (black trend-line) made a bottom and is rebounding, while BTC has been consolidating/ marginally pulling back.
Every time this combination took place in the past (green circles), Bitcoin was accumulating and shortly after started the parabolic rally phase (green ellipse). This is basically one of the most consistent long-term buy signals you can get in the market.
Are you really willing to bet against the market on this one?
Feel free to let us know in the comments section below!
-------------------------------------------------------------------------------
** Please LIKE 👍, FOLLOW ✅, SHARE 🙌 and COMMENT ✍ if you enjoy this idea! Also share your ideas and charts in the comments section below! This is best way to keep it relevant, support us, keep the content here free and allow the idea to reach as many people as possible. **
-------------------------------------------------------------------------------
💸💸💸💸💸💸
👇 👇 👇 👇 👇 👇

🚧Bitcoin Needs Correction🚧✅ Bitcoin moved as I expected in the previous post .
💡Currently, Bitcoin has reacted well to the 🔴 Resistance zone($65,650-$64,200) 🔴.
🌊According to the theory of Elliott waves , it seems that Bitcoin has succeeded in completing 5 impulse waves and now we have to wait for corrective waves .
💡Also, we can see Regular Divergence(RD-) between two Consecutive Peaks .
📈According to Classical Technical Analysis , Bitcoin can also form the Head and Shoulders Pattern .
🔔I expect Bitcoin to fall after breaking the Uptrend line , at least to the first 🎯 Target 🎯 I specified on the chart.
❗️⚠️Note⚠️❗️: If Bitcoin can break the 🔴 Resistance zone($65,650-$64,200) 🔴, the scenario will be changed.
❗️⚠️Note⚠️❗️: An important point you should always remember is capital management and lack of greed.
Bitcoin Analyze ( BTCUSDT ), 1-hour time frame ⏰.
Do not forget to put Stop loss for your positions (For every position you want to open).
Please follow your strategy; this is just my Idea, and I will gladly see your ideas in this post.
Please do not forget the ✅' like '✅ button 🙏😊 & Share it with your friends; thanks, and Trade safe.

Bitcoin is Ready to ⚔️Attack⚔️ the Resistance zone🎉Hi guys, I hope that you have a great weekend .
💡Bitcoin failed to break the 🟢 Heavy Support zone($61,100-$58,700) 🟢 and 100_SMA(Daily) and created a 🐻 Bear Trap 🐻, one of the reasons for which was the release of the US employment rate .
🏃♂️ Bitcoin currently seems to have succeeded in breaking the upper line of the descending channe l and is moving in the 🔴 Resistance zone($65,650-$64,200) 🔴.
🔔I expect Bitcoin to rise at least to the upper 🔴 Resistance zone($65,650-$64,200) 🔴 and possibly to the 50_SMA(Daily) .
❗️⚠️Note⚠️❗️: An important point you should always remember is capital management and lack of greed.
Bitcoin Analyze ( BTCUSDT ), 1-hour time frame ⏰.
Do not forget to put Stop loss for your positions (For every position you want to open).
Please follow your strategy; this is just my Idea, and I will gladly see your ideas in this post.
Please do not forget the ✅' like '✅ button 🙏😊 & Share it with your friends; thanks, and Trade safe.

Bitcoin steady above support. Are bears done?At the beginning of the month, due to tensions in the Middle East, BITSTAMP:BTCUSD dropped below the crucial 62k technical support level, even dipping below 60k to reach a local low at 57k.
However, this breakdown was short-lived, with BTC spending only 2 days below this significant level before reversing strongly. This reversal confirmed a false break when the price returned above 62k.
Over the weekend, Bitcoin also broke above the falling trend line of the recent downward channel, further bolstering its bullish perspective.
Currently, we are facing resistance at both the technical and psychological level of 65k. Once (or if) we break above this level, the path becomes clear to revisit the old all-time high zone and potentially even move further upward.
As long as 62k remains intact, I maintain a strong bullish stance.
