🚨Bitcoin Is Ready to Fall🚨🏃♂️Bitcoin is moving in 🟡 Potential Reversal Zone(PRZ)($66,120-$65,350) 🟡 and Resistance line .
🌊According to the Elliott wave theory , Bitcoin seems to be able to complete the Zigzag Correction(ABC/5-3-5) in PRZs (🟡 Potential Reversal Zone(PRZ) ($66,120-$65,350)🟡 has more chances).
💡Another sign that we can point to Bitcoin correction is the formation of the Head and Shoulders Pattern .
🔔I expect Bitcoin to fall at least to my Pitchfork lines on the chart.
❗️⚠️Note⚠️❗️: An important point you should always remember is capital management and lack of greed.
Bitcoin Analyze ( BTCUSDT ), 1-hour time frame ⏰.
Do not forget to put Stop loss for your positions (For every position you want to open).
Please follow your strategy; this is just my Idea, and I will gladly see your ideas in this post.
Please do not forget the ✅' like '✅ button 🙏😊 & Share it with your friends; thanks, and Trade safe.
Bitcoinsignals

BITCOIN Is $175000 so easy to achieve?Bitcoin (BTCUSD) broke its All Time High (ATH) this month, making history once again. The quest for the rest of the month is to close the March 1M candle above the previous ATH (69000). Why is this important? Because every time it did so in the past on each and every Cycle, the price never looked back and it entered the most aggressive part of the Bull Cycle: the Parabolic Break-out Phase.
This has coincided with the 1M RSI breaking above the 0.786 Fibonacci retracement level of the Fibonacci Channel Down. As you can see on the chart every time it did so, it reached (or almost) the top of the Channel Down (blue circle) while the price hit the 1.618 Fibonacci extension. During the first 2 Cycles the price went on even considerably higher than that (red rectangle) before the Cycle peaked, while the 1M RSI again hit the top of the Channel Down.
During the previous (most recent) Cycle though, there was no 2nd RSI top, as the price only marginally exceeded the 1.618 Fib with its 2nd top, in fact it didn't even close a 1M candle above it.
As a result, we may have a similar 'Double Top' Cycle this time also, but that's just the modest scenario. In any case the 1.618 Fib extension is now priced at $175000, which technically is a 'certainty' (if you can ever say that in investing) based on this historic chart and the Target of this Cycle.
But what do you think? Is $175k a given and if yes, will BTC surpass the 1.618 Fib for an even higher Cycle Top? Feel free to let us know in the comments section below!
-------------------------------------------------------------------------------
** Please LIKE 👍, FOLLOW ✅, SHARE 🙌 and COMMENT ✍ if you enjoy this idea! Also share your ideas and charts in the comments section below! This is best way to keep it relevant, support us, keep the content here free and allow the idea to reach as many people as possible. **
-------------------------------------------------------------------------------
💸💸💸💸💸💸
👇 👇 👇 👇 👇 👇

BTC FOR SCALPERS AND DAY TRADERS **18000 POINTS **Entry price ,stoploss and Target already marked in the chart itself FYI.
Guys pls like, share and follow my ideas .
Thank You All

BITCOIN New bottom formed. Rally could aim well above $100k.Bitcoin (BTCUSD) is at the early stages of a new parabolic rally, similar to January - March, as a key bullish development took place. The 1D RSI hit the 50.00 neutral (middle) level for the first time since breaking above it on January 26 2024 and rebounded, while keeping the 1D MA50 (blue trend-line) intact.
This is a strong bullish signal for the Bull Cycle. BTC has been within a range for the majority of this month and last time all those parameters emerged together was in late November - early December 2020. At that time, Bitcoin also hit the 50.00 RSI level, held above the 1D MA50 and after being ranged for almost a month, it started a new parabolic bullish leg towards the 6.0 Fibonacci extension before the next 1D MA50 pull-back.
As you can see, both sequences capped a roughly +100% rise since the previous Lows where the price made contact with the 1D MA100 (green trend-line) and eventually bounced. The 1D MA100 wasn't touched again for almost 7 months, not before BTC approached the 8.0 Fib extension, completing a +563% rise from that Low.
The fractals are virtually identical so far and if the current price action continues to replicate 2020/ 2021, we expect the 1D RSI to hit 90.00 again before retracing. If $100k isn't hit at that time, we will book profits regardless and buy again on the next 1D MA50 contact. Until then, $100k is our next Target.
But what do you think? Is 100k a realistic target that soon and if yes can Bitcoin repeat 2021 to its full extent and even reach 250k? Feel free to let us know in the comments section below!
-------------------------------------------------------------------------------
** Please LIKE 👍, FOLLOW ✅, SHARE 🙌 and COMMENT ✍ if you enjoy this idea! Also share your ideas and charts in the comments section below! This is best way to keep it relevant, support us, keep the content here free and allow the idea to reach as many people as possible. **
-------------------------------------------------------------------------------
💸💸💸💸💸💸
👇 👇 👇 👇 👇 👇

GBPJPYBank of England release today. No change is forecast, but technically, I would expect liquidity grabs back down to monthly fibonacci support #1 before or during the news release. This trend is still strong going up. I anticipate this pair breaking June 2015 high.

BITCOIN Will 60k hold?Bitcoin (BTCUSD) is having so far its strongest correction (almost -15%) in 2 months (since the January 23 2024 Low) with the 1D RSI turning neutral (was overbought last week) after forming Lower Highs (i.e. a Bearish Divergence).
The dominant pattern is still a Channel Up, supported by the 1D MA50 (blue trend-line) and last time we saw such an RSI Bearish Divergence was during the previous Channel Up (October 13 2023 - January 11 2024) but turned out to be false and the trend continued upwards. This time though the pull-back appears to be stronger, similar to January 12 2024, which broke the previous Channel Up and made a bearish move towards the 0.382 Fibonacci retracement level.
As a result we are looking for a pull-back extension near Support 1 (59500) and the 0.382 Fib, which is marginally below it, where the 1D MA50 is headed. This is the strongest Support Cluster possible on the short-term and if it holds, the bullish trend of the Channel Up should be maintained and the potential rebound can target $90000 around the time of the Halving. If however the price closes a 1D candle below the 0.382 Fib, we will be looking towards a 1D MA200 (orange trend-line) test around 45000, before the bullish trend is resumed.
Notice also that technically the 44.90 - 36.00 1D RSI Support Zone has been a buy opportunity since for the past 6 months.
Feel free to let us know in the comments section below!
-------------------------------------------------------------------------------
** Please LIKE 👍, FOLLOW ✅, SHARE 🙌 and COMMENT ✍ if you enjoy this idea! Also share your ideas and charts in the comments section below! This is best way to keep it relevant, support us, keep the content here free and allow the idea to reach as many people as possible. **
-------------------------------------------------------------------------------
💸💸💸💸💸💸
👇 👇 👇 👇 👇 👇

BITCOIN This dump will truly test the strength of the rally!Bitcoin (BTCUSD) declined from the fresh 73700 All Time High (ATH) back to 65600 in a matter of a few hours, breaking below the 4H MA50 (blue trend-line), entering the green Ichimoku Cloud for the first time this month, while touching the bottom of the short-term Channel Up pattern.
This is the 2nd Higher Low for the pattern and now is the time for the trend to test the strength of this rally. As long as the candles close inside the Channel Up, we expect the bullish trend to continue and make a break-out attempt even to the 3.0 Fibonacci extension (90000), similar to the Channel Up bullish break-out that delivered the December 09 2023 High.
The two patterns share many similarities not just on their price action and MA periods involved but also on their RSI sequences. If the Channel Up breaks to the downside though, we expect a quick test of Support 1 and will pursue a 60000 Target that should test the 4H MA200 (orange trend-line). Then, as long as the 1D MA50 (red trend-line) holds, we can look forward to a bullish reversal and higher accumulation towards yet another ATH near the end of the month or at worst first week of April.
Feel free to let us know in the comments section below!
-------------------------------------------------------------------------------
** Please LIKE 👍, FOLLOW ✅, SHARE 🙌 and COMMENT ✍ if you enjoy this idea! Also share your ideas and charts in the comments section below! This is best way to keep it relevant, support us, keep the content here free and allow the idea to reach as many people as possible. **
-------------------------------------------------------------------------------
💸💸💸💸💸💸
👇 👇 👇 👇 👇 👇

BITCOIN The ETF multiyear rally has only just begun(Gold's case)With Bitcoin's (BTCUSD) continuous bullish run, day after day, running basically the 7th straight green month, we thought it may be a good time to put things into a greater perspective from a macro point of view, as many seem confused over this hyper aggressive bullish sentiment.
The reason is one and one alone and has a very short name: E T F
Yes, everyone that is following the market knows that on January 11 2024, the first Bitcoin ETF was launched on the U.S. market and after a quick dip, the price has been rising every since. Other macro factors are playing their role, such as the AI technological innovation, the upcoming Halving, the anticipation of Fed rate cuts by June etc. But BTC has never made a new All Time High (ATH) before the Halving before, and this is primarily attributed to the ETFs introduction.
What better case to compare Bitcoin's price action to Gold's following its own ETF launch. That was done on March 28 2003 and the result you can see on the right hand chart. Gold used its 1W MA50 (blue trend-line) as a Support to fuel an 8 year parabolic rally, which only broken during the shock of the 2008 Housing Crisis, but still managed to recover the extend the rally until August 2011.
That peak almost on the 4.0 Fibonacci extension level from the High (January 1996) that preceded Gold's ETF. If Bitcoin follows a similar trend to Gold's (note that Gold's market cap is around $14.530 Trillion, while BTC's is 'only' $1.445 Trillion), it can reach and even surpass emphatically the $1000000 mark (the 4.0 Fib for Bitcoin is at $6 million). Crazy as this may sound (well that's Bitcoin's life story, everything has been 'crazy' at $1, then $10, $100, it was deemed expensive by some even at $1000 and so on), there is no time restriction nor the necessity to reach seemingly extraordinary levels in 8 years or 10. As the market matures, fiat currencies are devalued by more inflation etc, and adoption is accelerated, this may be a process that takes up 15, 20, 30 years. The key, not just for fund managers but also average investors, is to hold Bitcoin in their portfolios just as it has been paying off since 2003 to hold Gold.
Buy what do you think about these two assets and their potential similarities of their post ETF trends? Feel free to let us know in the comments section below!
-------------------------------------------------------------------------------
** Please LIKE 👍, FOLLOW ✅, SHARE 🙌 and COMMENT ✍ if you enjoy this idea! Also share your ideas and charts in the comments section below! This is best way to keep it relevant, support us, keep the content here free and allow the idea to reach as many people as possible. **
-------------------------------------------------------------------------------
💸💸💸💸💸💸
👇 👇 👇 👇 👇 👇

BITCOIN hit 70k! Can a 60k pull-back deliver 100k in 3 months?Bitcoin (BTCUSD) broke the $70000 psychological barrier today, smashing yet again a benchmark level during this Bull Cycle and on a momentum basis, it does not give any signs of stopping. However based on the 2020 post-COVID crash fractal, which started after the 1D MA50 (blue trend-line) crossed above the 1W MA50 (red trend-line), and that BTC has been following on an almost identical trade for the past 1 year (since March 2020), the price may experience a short-term pull-back at this stage.
If the fractal continues to play out, then a $60000 correction towards the end of the month, may come as a technical necessity is Bitcoin is to see a new High as we get closer to April's Halving. As you can see, even the 1D RSI sequences between the two fractals are quite similar. Based on that fractal we may even see Bitcoin at $100000 as early as June!
Do you agree with that? Feel free to let us know in the comments section below!
-------------------------------------------------------------------------------
** Please LIKE 👍, FOLLOW ✅, SHARE 🙌 and COMMENT ✍ if you enjoy this idea! Also share your ideas and charts in the comments section below! This is best way to keep it relevant, support us, keep the content here free and allow the idea to reach as many people as possible. **
-------------------------------------------------------------------------------
💸💸💸💸💸💸
👇 👇 👇 👇 👇 👇

Bitcoin will Fall after🚨Bull Trap🚨🏃♂️Bitcoin is moving in the 🔴 Resistance zone($69,000_$65,000) 🔴.
📈From the point of view of Classic Technical Analysis , it seems that a Rising Wedge Pattern has been formed, although, at the same time, we seem to have witnessed a Bull Trap , and this Bull Trap caused a new All-Time High(ATH=$69,990) to be created for Bitcoin.
📚What is the 🐮Bull Trap🐮❗️❓
🔸 After a minimal rise, the bull trap forms when analysts and traders expect the price to move upward, so traders open their long positions, hoping for the price to go up. However, that’s not the case. The price goes down, trapping those traders who thought otherwise.
🔸In this case, traders without correct stop losses suffer heavy losses. They are the so-called bull trap fallen.
🔔I expect Bitcoin to fall to at least one of the Fibonacci levels( after completing the pullback to the lower line of the Rising Wedge Pattern .
❗️⚠️Note⚠️❗️: If Bitcoin makes a new ATH again, the analysis will be failed.
❗️⚠️Note⚠️❗️: An important point you should always remember is capital management and lack of greed.
Bitcoin Analyze ( BTCUSDT ), 15-minute time frame ⏰.
Do not forget to put Stop loss for your positions (For every position you want to open).
Please follow your strategy; this is just my Idea, and I will gladly see your ideas in this post.
Please do not forget the ✅' like'✅ button 🙏😊 & Share it with your friends; thanks, and Trade safe.

BITCOIN What is next narrative it will break?Since th 2021 Bear Cycle started, Bitcoin (BTCUSD) entered a phase that few could have predicted. You can very easily even call it the 'Cycle of Narrative Destruction' as since the June 13 2022 break below the previous All Time High (ATH), Bitcoin started breaking narratives that have been well established throughout its history and few thought could break.
** Five major narrative breaks so far **
Starting from the very first narrative destruction on the week of June 13 2022 (we are viewing this chart on the 1W time-frame), Bitcoin managed to break below the previous ATH (19350) for the first every in its history. Then a few months later in November 2022 in the aftermath of the FTX crash, it broke below the 1W MA300 (red trend-line) also for the first time ever. This resulted into the first ever 1W Death Cross around February 2023 and following the recovery during 2023, it naturally formed the first ever 1W Golden Cross around the last week of December first week of January 2024. The most recent narrative that BTC has destroyed was this week as it made a new ATH marginally above $69000, which was the first time it did so before the Cycle's Halving (which is due in mid April 2024).
** Which narrative is next to break? **
As you can see, those are 5 major narrative breaks in the span of 18 months. So what narrative will BTC break next? The first that comes to our mind as the market is rising that fast this high, is the Theory of Diminishing Returns (TODR). This theory implies (and has been correct so far) that each Cycle delivers lower returns than the previous. As you see on the charts, the first Cycle gave +531681% returns, the next one +62325%, then +11808% and the most recent +2051%.
** So 330k is realistic?? **
If this narrative is to break, it means that BTC would need to make a little over +2051% during the current Cycle. That suggests that we can be looking at a Cycle peak above $330000! Of course if that happens, it would mean that Bitcoin will also break above its historic Parabolic Growth Channel, which can be considered another narrative destruction.
But what do you think? Can the Theory of Diminishing Returns be the next narrative to break and if not, which one do you think it will be? Feel free to let us know in the comments section below!
-------------------------------------------------------------------------------
** Please LIKE 👍, FOLLOW ✅, SHARE 🙌 and COMMENT ✍ if you enjoy this idea! Also share your ideas and charts in the comments section below! This is best way to keep it relevant, support us, keep the content here free and allow the idea to reach as many people as possible. **
-------------------------------------------------------------------------------
💸💸💸💸💸💸
👇 👇 👇 👇 👇 👇

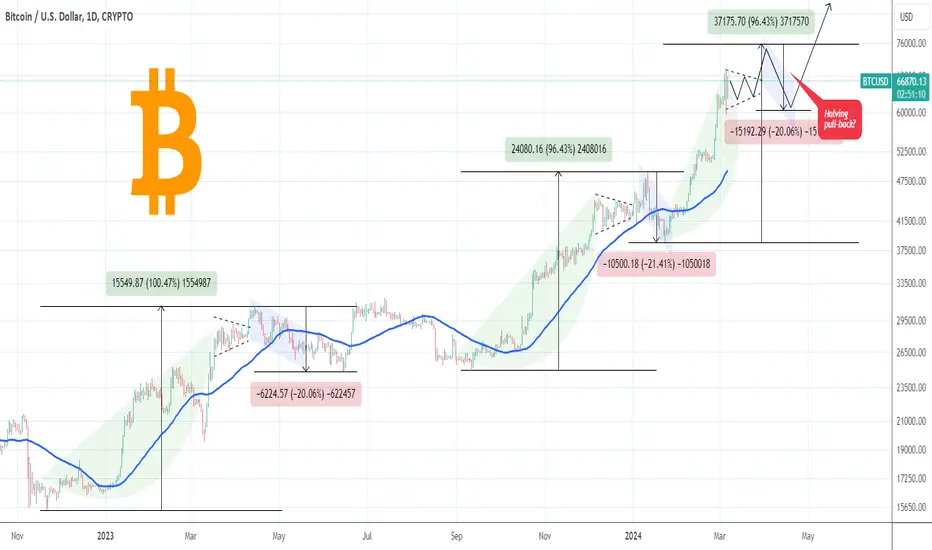
BITCOIN Volatility to kick in as we approach the Halving?So far since the November 2022 bottom, Bitcoin (BTCUSD) has formed the same pattern twice: roughly +100% rise, a Triangle that preceded the rally's top, followed by a roughly -20% decline in the form of a Channel Down.
The latest high volatility of the past 3 days resembles those Triangle patterns before the peak. A +96.43% rise, similar to the previous Wave, gets completed around $75500. If BTC continues to replicate those patterns, then a -20% correction should coincide with April's Halving.
Do you think that Bitcoin will continue following that blue-print? Feel free to let us know in the comments section below!
-------------------------------------------------------------------------------
** Please LIKE 👍, FOLLOW ✅, SHARE 🙌 and COMMENT ✍ if you enjoy this idea! Also share your ideas and charts in the comments section below! This is best way to keep it relevant, support us, keep the content here free and allow the idea to reach as many people as possible. **
-------------------------------------------------------------------------------
💸💸💸💸💸💸
👇 👇 👇 👇 👇 👇
After the New ATH of Bitcoin, what should we expect (Reasons)❗️❓😱Today, a new All-Time High(ATH) was created in most of the exchanges . Perhaps the movement of Bitcoin last week surprised many people, and many did not expect Bitcoin to touch All-Time High(ATH) before the new Halving . But it was expected that Bitcoin would react near the previous All-Time High(ATH), and the same happened. There are many reasons why Bitcoin should be corrected ( Fear and Greed index, Open Interest value, etc.).
💡 Bitcoin has started to decline from the 🔴 Resistance zone($69,000_$65,000) 🔴 and has managed to break the Uptrend line .
🌊According to the theory of Elliot waves , the end of wave 5 was in the 🔴 Resistance zone($69,000_$65,000) 🔴 , and we should expect correction waves ; one sign of the beginning of correction waves is the breaking of the Uptrend line . Another sign is the Regular Divergence(RD-) between two Consecutive Peaks.
💡One of the other charts that can help us confirm the Bitcoin correction is the Market Cap USDT Dominance% (USDT.D%) chart.
💡 USDT.D% after breaking the Support line and the 🟢 Heavy Support zone(5.80%-5.20%) 🟢 caused the cryptocurrency market to increase significantly in these weeks.
💡Currently, USDT.D% is in 🟡 Potential Reversal Zone(PRZ) 🟡and near Support lines and has also touched the 🎯Symmetric Triangle Target🎯 . I expect USDT.D% to rise to at least one Fibonacci level .👇
🔔I expect Bitcoin to start going down again after possibly playing around $61,500 for a while and at least down to the Support line and 🟡 Potential Reversal Zone(PRZ) 🟡.
❗️⚠️Note⚠️❗️: An important point you should always remember is capital management and lack of greed.
Bitcoin Analyze ( BTCUSDT ), 4-hour time frame ⏰.
Do not forget to put Stop loss for your positions (For every position you want to open).
Please follow your strategy; this is just my Idea, and I will gladly see your ideas in this post.
Please do not forget the ✅' like '✅ button 🙏😊 & Share it with your friends; thanks, and Trade safe.

BITCOIN Perfect symmetry shows $170k!This chart on the 1W time-frame shows how symmetric Bitcoin's price action has been before and after the March 2020 COVID crash with the price action has been before and after the November 2022 FTX crash.
Both within the long-term structure of a Channel Up, the bottomed below the 1W MA200 (orange trend-line), turned a Resistance into Support when the rally really took off, while the 1W RSI was ascending on a Channel Up.
Within this nearly 7 year Channel Up, BTC made its two Higher Highs peaks after a +1000% rally, which indicates that is the standard for the pattern. A repeat of a +1000% rise from the November 2022 bottom gives us a projected peak around $170000!
How realistic do you think that is? Do you agree with that model? Feel free to let us know in the comments section below!
-------------------------------------------------------------------------------
** Please LIKE 👍, FOLLOW ✅, SHARE 🙌 and COMMENT ✍ if you enjoy this idea! Also share your ideas and charts in the comments section below! This is best way to keep it relevant, support us, keep the content here free and allow the idea to reach as many people as possible. **
-------------------------------------------------------------------------------
💸💸💸💸💸💸
👇 👇 👇 👇 👇 👇

Bitcoin could continue its ascent to 67Last week was quite eventful for $BITSTAMP:BTCUSD. After breaking out of the two-week-long rectangle consolidation, the price surged, increasing by $10,000 in just a few days, or more notably, around 20%.
However, after reaching a local high on Thursday, the price began consolidating recent gains and is adjusting to the $60,000 mark.
The positive aspect for bulls is that this consolidation is forming a symmetrical triangle, which typically indicates a continuation pattern.
The target for this pattern is the 67k zone.
In conclusion, in my view, any dips should be considered opportunities for buying, and only if the price drops below 59K in terms of daily closing would this scenario be put on hold.

BUY MORE BITCOIN IN THIS RANGE NEW ATH IS COMING!!!HELLO TRADERS
As i can see BTC is going to make a new ATH in this session before halving a massive volume and greed will create a new ATH in bitcoins Friends it's still cheap peoples who was noy buying from 17K now greedy for bitcoin BLACK ROCK and other ETF,s are converting their assets in BITCOIN buy more and join the train before its will too late BTC is ready to trade in 6 DIGIT sooner than expected.... there are many other things can move more higher price of BTC
Greed is exceeding around the world
Its just an trade idea share you thoughts with us
STAY TUNED for more updates

BITCOIN Why $81000 may be more realistic than you think!We've been talking about the possibility of Bitcoin (BTCUSD) seeing $81000 for a while now but this pattern on the 1W time-frame shows for the first time more clearly why this is a more realistic than ever!
As you can see, by applying the Fibonacci Channel on the last 2 Cycles, we can see that Bitcoin just broke on the current 1W candle the 0.382 Fibonacci level (yellow line) for the first time since June 06 2022. In cyclical terms this is a very important development as during the previous Cycle, every time BTC broke above the 0.382 Fib (2 times), it always extended and hit the 0.5 Fib too (blue). In fact the time it took on those 2 cases to reach the 0.5 Fib after the price departed from the 0.236 Fib (green) was 7 weeks (49 days) and 8 weeks (56 days).
As a result, we can estimate a max time (8 weeks) of hitting the 0.5 Fib on the week of April 01 2024. If done on exactly that week, then 81k will be delivered. If earlier obviously we are looking within the 78-81k range.
The 1W CCI indicator (green circles) suggests that we might be closer to a November 2020 fractal than May - June 2019 (which was of course caused by the Libra euphoria). This indicates that currently we might be at the very start of this Cycle's most aggressive part, the Parabolic Rally.
But what do you think? Is 81k as close as this chart suggests? Feel free to let us know in the comments section below!
-------------------------------------------------------------------------------
** Please LIKE 👍, FOLLOW ✅, SHARE 🙌 and COMMENT ✍ if you enjoy this idea! Also share your ideas and charts in the comments section below! This is best way to keep it relevant, support us, keep the content here free and allow the idea to reach as many people as possible. **
-------------------------------------------------------------------------------
💸💸💸💸💸💸
👇 👇 👇 👇 👇 👇

🗺️Bitcoin Roadmap🗺️⏰(4-hour time frame)⏰😱Bitcoin surprised everyone in the last two days ( without any correction ) and increased by more than ➕25% . One of the biggest drivers of Bitcoin to increase again was MicroStrategy .
🏃♂️Bitcoin is currently moving at the 🟡 Potential Reversal Zone(PRZ) ($65,120_$56,300) 🟡and the Resistance line (we also saw the 🐮 Bull Trap 🐮).
🌊According to the theory of Elliott waves , it seems that Bitcoin has succeeded in completing wave 5 .
💡In general, the distance between the Price of Bitcoin and the SMA(100) has increased, and the correction can probably continue until the SMA(100) .
🏃♂️ Market Cap BTC Dominance% (BTC.D%) has entered the 🟡 Potential Reversal Zone(PRZ) 🟡, and I expect a correction to the Support line .👇
🔔I expect Bitcoin to decline to the 🟢 Support zone($57,580-$56,320) 🟢 and then attack the Support line .
❗️⚠️Note⚠️❗️ : So far, Bitcoin has not touched its All-Time High(ATH) before halving. Can Bitcoin touch $69,000 before Halving ❗️❓
❗️⚠️Note⚠️❗️: An important point you should always remember is capital management and lack of greed.
Bitcoin Analyze ( BTCUSDT ), 4-hour time frame ⏰.
Do not forget to put Stop loss for your positions (For every position you want to open).
Please follow your strategy; this is just my Idea, and I will gladly see your ideas in this post.
Please do not forget the ✅' like '✅ button 🙏😊 & Share it with your friends; thanks, and Trade safe.

BITCOIN Today's monthly closing can start a rally to $81000!Bitcoin (BTCUSD) is closing the monthly (1M) candle today and to the surprise of most, it is near the November 2021 All Time High (ATH). In fact it is exactly at the level where the ATH monthly candle (Nov 2021) made its closing. As a result if the month of February closes today above it, we will have a new ATH monthly closing!
** The importance of the monthly closing **
Why is that so important? Because every time in history BTC closed a 1M candle above the closing of the previous ATH candle closing, it started the Parabolic Rally Phase of the Bull Cycle and never looked back until the Cycle top. This is a key level as there were 2 times it got tested but as the 1M candle didn't close above the previous ATH candle closing (August 2012 and June 2019), the price got rejected and took numerous more months before the next test and eventual break-out.
** The 1M RSI and Fib bands **
It is important to highlight that on the tests that were successful and made a new 1M candle close above the previous ATH candle closing, the 1M RSI was overbought above 70.00 (blue circle and arrow), while the 2 times it failed, the RSI was below 70.00. Also during those successful tests, the 1M candle was recently detached from the Fib MA Multiple 3 (blue trend-line) and in reached Multiple 5 (yellow trend-line) within the next 2 months maximum.
** What's next if successful? **
This indicates that if today's monthly candle closes above our critical level, we should see $81000 by April! And if you want to make a rough estimate of the top of the Cycle, it should be at or marginally below Multiple 7 (red trend-line) with a fair projection being $150000. You should also consider to start profit taking once the 1M RSI approaches its historic Lower Highs trend-line, which has timed the pricings of all Cycle tops. And with the exception of the last one, that was on a Double Top on the Lower Highs.
But what do you think? Will Bitcoin makes a closing above the ATH 1M candle closing today and if so, will it hit 81k by April? Feel free to let us know in the comments section below!
-------------------------------------------------------------------------------
** Please LIKE 👍, FOLLOW ✅, SHARE 🙌 and COMMENT ✍ if you enjoy this idea! Also share your ideas and charts in the comments section below! This is best way to keep it relevant, support us, keep the content here free and allow the idea to reach as many people as possible. **
-------------------------------------------------------------------------------
💸💸💸💸💸💸
👇 👇 👇 👇 👇 👇

BITCOIN, Massive Bullish Breakout, Wave-Extension Objection!Hello There!
Welcome to my new analysis of Bitcoin in the middle to larger timeframe perspective. Within recent times Bitcoin developed a determined bullishness from where on it continued to form several new highs and establish a solid uptrend also supported by events such as the BTC ETFs (Exchange-Traded-Funds) that were confirmed for acceptance. Now Bitcoin also completed a major pattern which is a huge bull flag formation, Bitcoin completed such patterns several times within history and now the wave C expansion is ready to move into new all time high spheres.
With the current bullish dynamic holding on and more and more volume moving into the market as well as with the bullish sentiment building a strong technical support bitcoin is on the way to reach the full potential wave C target zones. Once the bitcoin price action bounced into the new all time high this will be an appropriate price move when the BTC ETFs trading volume also supports the price action and confirms the ability to lead to further bullish volume determination increases within the next times.
Thank you everybody for watching my idea about BITCOIN! Support is greatly appreciated.
VP

BITCOIN, Massive Broadening Wedge, Targets Active + ETF Volume.Hello There!
Welcome to my new analysis of BITCOIN in the daily timeframe perspective. The current bull run is still holding on and BITCOIN does not back off and is printing one hew high after the other. This uptrend is backed by real events that support the bullish case such as the Bitcoin ETFs release which is the preliminary fundament of new and fresh volume moving into the whole cryptocurrency market.
When considering the developing dynamics in my technical chart perspective now it has to be pointed out that BITCOIN since it bounced several times within the 50-EMA established the ability to form this gigantic broadening wedge formation. Recently BITCOIN formed the crucial breakout above the upper boundary of the formation above which it is now developing a main bullish triangle continuation formation.
There is also a major wave count ongoing which is supporting the broadening wedge development as the major waves A and B already formed the fundament of the broadening wedge BITCOIN is now continuing to form the wave C simultaneously with the bullish expansion wave. What is also an important factor that is stabilizing the bullish trend here is the horizontal support marked in orange.
Taking all these factors into consideration the most meaningful insight here is that BITCOIN now activated the main target zones with the initial target zone to be reached once the bullish continuation triangle has completed with the continued extensive bullish breakouts. Once the initial target zone has been reached and the bullish BTC ETF volume is holding on together with bullish technicals the final target zone will be reached.
Thank you everybody for watching my idea about BITCOIN! Support is greatly appreciated.
VP

BITCOIN on the quickest ATH test! Is this a narrative breaker?A few weeks ago we published an analysis regarding the importance of the .786 Fibonacci retracement level in cyclical terms, showing that historically, every time Bitcoin (BTCUSD) has closed a 1W candle above that Fib level, it never looked back and it always tested the All Time High (ATH) soon after.
Fast forward to today, BTC has already closed 2 straight 1W candles above that level. On this analysis on the 5D time-frame, we see the completion of the Golden Cross, which has always been present once on every Cycle, this time though formed the closest ever to the ATH.
In fact Bitcoin is 'only' another +20% away from its ATH and technically in should get hit within the next handful of weeks. In that case, we will have the quickest rise from a Cycle Bottom (RSI based) to ATH since the 2012 - 2013 Cycle, which was Bitcoin's first and of course not a representative Cycle sample as it was on its first years and naturally on a very aggressive rise due to being a brand new market on low cap. If we do count however from the actual November 2022 bottom (460 days up to now), then the current Cycle goes head-to-head even with 2012 - 2013 (it was 466 days until the ATH)!
In any case, this is a remarkable run for the market with still more than a month left until the new Halving! Of course much of this rally is attributed to the newly approved ETF, which is attracting historic attention and capital inflows on Wall Street. Just a side-note, it is worth paying attention to the 5D RSI. A Resistance Zone test can be a first bell that the top is in or very close.
But what do you think? How long before we test the ATH? Feel free to let us know in the comments section below!
-------------------------------------------------------------------------------
** Please LIKE 👍, FOLLOW ✅, SHARE 🙌 and COMMENT ✍ if you enjoy this idea! Also share your ideas and charts in the comments section below! This is best way to keep it relevant, support us, keep the content here free and allow the idea to reach as many people as possible. **
-------------------------------------------------------------------------------
💸💸💸💸💸💸
👇 👇 👇 👇 👇 👇

BITCOIN (BTCUSD): Breakout & The Next Resistances ₿
Bitcoin broke and closed above a key daily horizontal resistance,
setting a new higher high higher close.
Here are the next historical resistances based on a price action of 2021:
Resistance 1: 58900 - 61000 area
Resistance 2: 62300 - 64200 area
Resistance 3: 65500 - 66300 area
Resistance 4: 67500 - 69000 area
The next goal for buyers will be Resistance 1.
Get ready for a further growth!
❤️Please, support my work with like, thank you!❤️
