Rising Wedge into 8/1 Gann FanDangerous pattern forming here on Bitcoin right under the 8/1 Gann Fan would be very careful on longing here , I like rising wedges on Bitcoin they play out most of the time .
Have to wait for more confirmation before pulling the trigger on this short.
Bitcoinsignals

Bitcoin Analysis (↗️Long↗️/↘️Short↘️Position)🏃♂️After failing to break the Support line , Bitcoin started to rise and is currently moving in the 🟢 Support zone($42,780-$42,280) 🟢.
🌊In terms of Elliott waves , Bitcoin seems to be completing microwave 4 .
🌊The structure of microwave 4 is Double Three Correction(WXY) .
🔔I expect Bitcoin to rise to the upper areas of the 🔴 Resistance zone($43,720_$43,340) 🔴 and then start to decline again .
🧐 What was the reason for the growth of Bitcoin in the last 24 hours❗️❓
🔸 The first news of the receipt of the spot Bitcoin ETF application file by the Swiss company Pando is 3 weeks after this company's request by the SEC, which made many people hope for the approval of Bitcoin ETFs.
🔸But receiving the file does not mean approval and it is part of the standard process of reviewing ETFs by the US Securities and Exchange Commission (SEC).
🔸The second positive news is the listing of ARK 21Shares spot ETF in DTCC broker, which has caused this positive news to affect Bitcoin.
❗️⚠️Note⚠️❗️: The scenario will change if Bitcoin can close a candle in the 4-hour time frame above the Master Candle.
❗️⚠️Note⚠️❗️: An important point you should always remember is capital management and lack of greed.
Bitcoin Analyze ( BTCUSDT ), 15-minute time frame ⏰.
Do not forget to put Stop loss for your positions (For every position you want to open).
Please follow your strategy; this is just my Idea, and I will gladly see your ideas in this post.
Please do not forget the ✅' like '✅ button 🙏😊 & Share it with your friends; thanks, and Trade safe.

Bitcoin Analysis 🕯(Master Candle)🕯👋Hi, I hope you have a great weekend.
📚It is better to know that candles are considered as passports for charts. Candles alone or together ( candlestick patterns ) can convey concepts to us that help us identify price trends, and these patterns are in higher time frames , more volume and closer to standard patterns , the more valid they will be.
📉Today, I want to analyze the Bitcoin daily candles for the last week , which, along with the previous analysis, may help us identify the Bitcoin trend .
🕯If you look closely at the candle from five days ago in the daily time frame , you will see a candle with a red body , long and high volume , which contains five candles so far. The name of this candle is Master Candle .
📚 What is Master Candle ❗️❓
🔸 There are different ways of looking at this trading strategy, but in its simplest form, a Master Candle is a candle which contains the highs and lows of at least the next four candles after it. It can be applied to forex, gold, oil , crypto, stocks, and indices.
🔸 When a Master Candle forms, a trade is taken if the High/Low breaks , taken of course in the direction of the break.
💡Also, candles number 2 , 3, and 4 together and on the 🔴 Resistance zone($43,560-$42,780) 🔴 form the Evening Star Candlestick Pattern , which is one of the bearish reversal patterns .
💡Another point that may give us more insight into the value of this Master Candle is that this Master Candle is the longest and most voluminous daily Bitcoin candle since Bitcoin started its rally at $25,000 , and the other point is that this Master Candle has appeared at the top of the ascending channel and near the 🔴 Resistance zone($51,500_$45,340) 🔴 and the Regular Divergence(RD-) between two consecutive peak s can be seen.👇
💡Finally, before making a better conclusion, let's take a look at the weekly candlestick . The weekly candlestick has also formed a Hanging Man Candlestick Pattern near the 🔴 Resistance zone($51,500_$45,340) 🔴 and above the ascending channel . Hanging Man Candlestick Pattern is a bearish reversal pattern .👇
🔔As a result, I expect Bitcoin to decline and at least fill the 🔵 CME Gap($40,325-$39,290) 🔵 before falling to the 🟢 Support zone($39,000-$37,000) 🟢, given the Master Candle's red body and other analyses I shared with you earlier.
❗️⚠️Note⚠️❗️: If Bitcoin can break the High($43,810) Master Candle upwards, we can expect Bitcoin to rise to the 🔴 Resistance zone($51,500_$45,340) 🔴.
❗️⚠️Note⚠️❗️: An important point you should always remember is capital management and lack of greed.
Bitcoin Analyze ( BTCUSDT ), Daily time frame ⏰.
Do not forget to put Stop loss for your positions (For every position you want to open).
Please follow your strategy; this is just my Idea, and I will gladly see your ideas in this post.
Please do not forget the ✅' like '✅ button 🙏😊 & Share it with your friends; thanks, and Trade safe.

🚨Bitcoin is Ready to Fill CME Gap🚨✅As I expected, Bitcoin touched the 🔴 Resistance zone($43,180-$42,820) 🔴 .
🌊According to Elliott's wave theory , Bitcoin is completing a corrective Zigzag(ABC/5-3-5) pattern.
🔔I expect Bitcoin to decrease to at least the Support line after completing the Zigzag correction structure, and if the support line breaks, we can expect 🔵 CME Gap($40,325-$39,290) 🔵 to fill.
❗️⚠️Note⚠️❗️: If BTC can break the $44,720 , the Scenario will change.
❗️⚠️Note⚠️❗️: An important point you should always remember is capital management and lack of greed.
Bitcoin Analyze ( BTCUSDT ), 15-minute time frame ⏰.
Do not forget to put Stop loss for your positions (For every position you want to open).
Please follow your strategy; this is just my Idea, and I will gladly see your ideas in this post.
Please do not forget the ✅' like '✅ button 🙏😊 & Share it with your friends; thanks, and Trade safe.

🚨The End of the Bitcoin Rally(💡Signs💡)🚨👋Hi, everyone. I hope you had a great weekend.
🧐Today, I decided to answer the question of whether Bitcoin has reached the end of the Bullish Rally or not ❗️❓
⏰To answer the above question, it is better to look at the Bitcoin chart in the higher time frames, such as daily, 2-day, or weekly.
🌐Bitcoin started to increase after the confirmation of ETFs , but it seems that the result of the news should NOT help Bitcoin anymore, because the reality is that no money has entered the market through companies and we have to wait for the approval of ETFs and then their implementation phase. So it seems that the cryptocurrency market has increased well so far with this news, although when the entry of ETFs is done , we can see more growth of Bitcoin ( According to the news, the first ETF will be approved on January 8-10 ).
💡If we look at the 2-day chart of Bitcoin, we will realize that Bitcoin has been moving in an Ascending channel for more than a year .
💡Another interesting point is that the Pitchfork lines played the role of Support and Resistance very well on the Bitcoin chart so that every time a line breaks upwards, Bitcoin moves up to the upper bar.
🏃♂️Bitcoin is moving near the upper line of the Ascending Channel , one of the Pitchfork lines(0.618) , and the 🔴Resistance zone($51,500_$45,340)🔴 .
🌊In terms of Elliott wave theory , Bitcoin seems to have completed the second impulse wave 5 [ although I expected Bitcoin to touch the 🔴Resistance zone($51,500_$45,340)🔴] .
💡Also, we can see Regular Divergence(RD-) between two Consecutive Peaks.
💡If Bitcoin touches the price range of $34,000-$34,300 , a large amount of LONG positions are exposed to the risk of liquidation , which is unfortunately attractive for exchanges .
💡One thing that can be said about Volume Trading is that, in general, the Volume Trading in the second five impulse waves is much less than the first five impulses == Not a good sign for the continuation of the upward trend of Bitcoin.
💡Another sign that can confirm the decline of Bitcoin is the presence of 🔵 6 CME Gaps 🔵; according to my research, Bitcoin has never created more than 5-6 CME Gaps in one direction, and in the past, Bitcoin has either been in an upward trend or moved down and filled these CME Gaps.
💡In addition, Bitcoin's Dominance(BTC.D%) has approached the 🟡 Price Reversal Zone(PRZ) 🟡, which will indicate the decrease of Bitcoin's dominance in the Cryptocurrency market in the future.👇
🔔I expect that Bitcoin will NOT be able to go above $44,700 in the next days and will fall to the 🟢 Support zone($39,000-$37,000) 🟢 and fill the 🔵 first CME Gap($40,325-$39,290) 🔵 and then spend some time above the support zone. The news of the approval of the fund, if it happens in January, can give temporary growth to Bitcoin, but it seems that the correction will continue at least until the lower line of the ascending channel and the 🔵 Second CME Gap($34,295-$34,160) 🔵.
❗️⚠️Note⚠️❗️: I will try to update you in the lower time frame every day.
❗️⚠️Note⚠️❗️: An important point you should always remember is capital management and lack of greed.
Bitcoin Analyze ( BTCUSDT ), 2-Days time frame ⏰.
Do not forget to put Stop loss for your positions (For every position you want to open).
Please follow your strategy; this is just my Idea, and I will gladly see your ideas in this post.
Please do not forget the ✅' like '✅ button 🙏😊 & Share it with your friends; thanks, and Trade safe.

🗺️Bitcoin Roadmap🗺️👋Hi, everyone; I hope you all have a positive Portfolio these days (be happy).
✅Bitcoin managed to break the 🔴 Resistance zone($38,650-$37,000) 🔴 [ In previous posts, my resistance zone was 🟡Price Reversal Zone(PRZ)🟡 ] and Important Resistance line during the weekend. However, this zone was not expected to break on Saturdays and Sundays when trading volume was generally low .
🏃♂️Bitcoin is moving on Important Resistance lines , Monthly Resistance (3) . It is interesting to know that all previous stations were on monthly pivots in the last two to three days.
🌊According to Elliott's wave theory , Bitcoin is on its way to completing the main wave 5 .
🌊If we want to look more closely at the waves, Bitcoin is currently completing microwave 3 of the main wave 5 .
🌊 Microwave 4 of microwave 3 of main wave 5 can end on one of the 23.6%($42,730) and 38.2%($41,676) Fibonacci lines.
💡 On-chain data shows that many Bitcoins have been purchased in the range of $45,000 and that medium-term Bitcoin holders are at a loss until now. If the price reaches this area, it is possible that a large number of holders will want to sell their Bitcoins at Breakeven !
🔔I expect Bitcoin to make the first attack on the 🔴 Heavy Resistance zone($52,130-$45,840) 🔴 to complete microwave 3 of the main wave 5 . It is also likely that the first 🔵 CME Gap($40,325-$39,290) 🔵 will be filled after completing the main wave 5 .
📚There are at least 🔵6 CME Gaps🔵 that Bitcoin has not yet filled; generally, over 98% of these gaps have been filled in Bitcoin.
📚 Elliott waves include a series of Rules and Guidelines that you can analyze and predict the road map of the price. In general, in the theory of Elliott waves, you are faced with several scenarios that you should find the correct scenario with the help of other technical analysis tools and fundamental analysis and try to identify the correct scenario from the false scenario.
❤️In the end, here is some advice for you as a little brother:
🔸 TradingView website has provided us with a suitable space to transfer our analysis, so it is better to use it and not waste our time on destruction or ugly comments.
🔸If you have any comments, please share them with respect .
🔸 No analysis is 100% , so if you use analysis as an investment, it is better to follow capital management and take responsibility for it yourself.
🔸Please don't look at the words of Celebrities about the price of Bitcoin and other Altcoins as an investment ; check their past, and the truth will be clear(These days they are hot).
🔸I hope we can use TradingView to increase our capital and knowledge .
❗️⚠️Note⚠️❗️: An important point you should always remember is capital management and lack of greed.
Bitcoin Analyze ( BTCUSDT ), 4-hour time frame ⏰.
Do not forget to put Stop loss for your positions (For every position you want to open).
Please follow your strategy; this is just my Idea, and I will gladly see your ideas in this post.
Please do not forget the ✅' like '✅ button 🙏😊 & Share it with your friends; thanks, and Trade safe.

BITCOIN Disturbing Puell trend-line calling for Cycle top?Bitcoin (BTCUSD) is trading within the 0.618 - 0.786 Fibonacci retracement levels which is the last Resistance Zone before it typically attempts a test of the All Time High (ATH) on each Bull Cycle. We have seen on previous analyses how the RSI is showing that this is a possible Mid-Cycle Resistance level where pull-backs towards the 1W MA50 (blue trend-line) occur.
** The Puell Multiple **
This time we are looking into the Puell Multiple and we are no strangers to it as it is the indicator that helped us buy with no fear on June 28 2021 (see chart below) when it hit the 0.30 - 0.40 Support Zone:
** Two Mid-Cycle rejections **
Just as the RSI, the 1W Puell Multiple is approaching the 2.40 Resistance, which has historically caused 3 rejections (December 28 2015, June 20 2016, June 24 2019), the two latter being Mid-Cycle pull-backs (blue circles).
** Can it be a Cycle Top? **
This indicator however displays a very disturbing structure, having the price entering the Lower Highs Zone since the June 06 2011 High. This Zone has priced all previous Cycle Tops (June 06 2011, December 02 2013, December 18 2017 and March 15 2021).
** What is it this time? **
The question is, what kind of top is it this time? Mid-Cycle or Cycle High? Even though all other key indicators show it's the former, we shouldn't take this Puell signal lightly. Technically, as long as the 1W MA50 holds, there is room for at least one more High and practically this potential pull-back is a buy opportunity.
Will a potential ETF approval distort this cyclical pattern though? If not, what do you think, is this a Mid-Cycle top or full Cycle High? Feel free to let us know in the comments section below!
-------------------------------------------------------------------------------
** Please LIKE 👍, FOLLOW ✅, SHARE 🙌 and COMMENT ✍ if you enjoy this idea! Also share your ideas and charts in the comments section below! This is best way to keep it relevant, support us, keep the content here free and allow the idea to reach as many people as possible. **
-------------------------------------------------------------------------------
💸💸💸💸💸💸
👇 👇 👇 👇 👇 👇

Bitcoin hits major Trendline ResistanceBitcoin has hit a major trendline resistance. The zone near 44200 will be very difficult zone for Bitcoin to cross. 39679 will be a good support and is proving so since three week. If 39679 is broken the next major support for Bitcoin will be near 35892. Major support zone for Bitcoin is between 30654 and 32232.
The above information is provided for educational purpose, analysis and paper trading only. Please don't treat this as a buy or sell recommendation for the stock. We do not guarantee any success in highly volatile market or otherwise. Stock market investment is subject to market risks which include global and regional risks. We will not be responsible for any Profit or loss that may occur due to any financial decision taken based on any data provided in this message.

Bitcoin- Recent price action is suggesting 48k target
The previous month proved highly favorable for BITSTAMP:BTCUSD bulls, witnessing a remarkable 25% surge in price and establishing a new local high above 44k. Following this upward move, a correction ensued, yet the price found solid support around the 40k zone.
After this correction, BTCUSD's price entered a consolidation phase, and the range of this consolidation is gradually contracting, indicative of a symmetrical triangle continuation pattern. The target for this pattern is set at 48k, with confirmation contingent on a breakout above the 43,500 zone.
I maintain a bullish outlook on Bitcoin, contingent on the price remaining above 40k in terms of daily close.

BITCOIN Stocks are hitting ATH earlier than BTC. Is it normal?The U.S. stocks are making new All Time Highs (ATH), with the Dow Jones already broken it, while the Nasdaq and the S&P500 (chart on the right) are very close too, while Bitcoin (BTCUSD) is almost -40% below its own ATH (chart on the left). Why is that and is it something normal?
Short answer: yes. Throughout BTC's history, it was always trailing (sometimes by an incredible margin) when the S&P500 was breaching its previous ATH after a multi-month correction. You can see those on times on the charts above (S&P hitting ATH on the blue vertical line, BTC's level at this time on the orange vertical line). It is interesting to note that every other Cycle, BTC is closer to its ATH than the previous, i.e. currently it's closer as opposed to April 2019 and before that (July 2016) it was again much closer, while on February 2012 it was on the lowest margin ever. Could be a Cyclical dynamic.
What's even more practical is that after every ATH breach for the S&P500, the index declines while Bitcoin rises, possibly in an early attempt to fill the gap.
The reasoning behind stocks making new ATH first, is that even though they are classified as risky assets, they don't match the incredibly high volatility and risk factor of Bitcoin (cryptocurrency). And the idea is that investors feel more comfortable investing capital in riskier assets, after the main market/ economy is booming and is confirmed.
What this tells you is that we are on the right Cyclical track as it happens every time on the same part of the Cycle. The stock market has left the 2022 inflation correction/ Bear Cycle back for good as it recovered all loses and is entering a new phase of expansion, and Bitcoin being closer to its Halving, is about to initiate the Parabolic Rally part of its new Bull Cycle.
But what do you think? Will Bitcoin catch up sooner than expected this time? Feel free to let us know in the comments section below!
-------------------------------------------------------------------------------
** Please LIKE 👍, FOLLOW ✅, SHARE 🙌 and COMMENT ✍ if you enjoy this idea! Also share your ideas and charts in the comments section below! This is best way to keep it relevant, support us, keep the content here free and allow the idea to reach as many people as possible. **
-------------------------------------------------------------------------------
💸💸💸💸💸💸
👇 👇 👇 👇 👇 👇

🗺️Bitcoin Roadmap🗺️(15-minute time frame)🏃♂️Bitcoin is moving near the 🔵 CME Gap($40,325-$39,290) 🔵 and Support line .
🌊In terms of Elliott wave theory , Bitcoin seems to have completed its 5-wave downtrend near the support line.
💡Also, we can see Regular Divergence(RD+) between two Consecutive Valleys .
🔔I expect Bitcoin to Go UP at least until the end of wave 4 and at the next target of the 🔴 Resistance zone($43,180-$42,820) 🔴.
❗️⚠️Note⚠️❗️: An important point you should always remember is capital management and lack of greed.
Bitcoin Analyze ( BTCUSDT ), 15-minute time frame ⏰.
Do not forget to put Stop loss for your positions (For every position you want to open).
Please follow your strategy; this is just my Idea, and I will gladly see your ideas in this post.
Please do not forget the ✅' like '✅ button 🙏😊 & Share it with your friends; thanks, and Trade safe.

BITCOIN Global bonds and Yuan signal a strong rally ahead.Those who follows for long know that this is not the first time we mix bonds and Chinese liquidity into Bitcoin's (BTCUSD) long-term analysis. We do so as more than a year ago we discovered their importance on BTC's trending patterns, which is so much affected by the monetary supply.
This time we decided to incorporate a fair Global Bonds Yield pool metric (blue trend-line) as well as the DXY/USDCNY ratio (red trend-line) in order to see on which stage of the liquidity cyclical patterns we are.
Global bonds trading within a +10 year Channel Down but are on the new Bullish Leg. It still has a full year before it hit the top and last time it was on this symmetrical level, Bitcoin was starting a Parabolic Rally. At the same time the DXY/USDCNY ratio is having the recent June rebound rejected (red circle) in the same way it did on November 2016. BTC is already three strong bullish months in, rising since September.
Do you think this is the start of a +1 year parabolic rally? Feel free to let us know in the comments section below!
-------------------------------------------------------------------------------
** Please LIKE 👍, FOLLOW ✅, SHARE 🙌 and COMMENT ✍ if you enjoy this idea! Also share your ideas and charts in the comments section below! This is best way to keep it relevant, support us, keep the content here free and allow the idea to reach as many people as possible. **
-------------------------------------------------------------------------------
💸💸💸💸💸💸
👇 👇 👇 👇 👇 👇

BITCOIN still trading very similarly to 2016. Still missing out?We have published quite a handful of Bitcoin (BTCUSD) analyses that compare in detail the current Cycle with that of 2014 - 2017. A representative sample of such study is the one below that we made on July 31:
People were still in denial that BTC would extend the recover that started after the FTX crash but we analyzed in detail why we thought that was the case. As you can see the classification in phases helped a lot and turned out to be very accurate at least so far.
** Pre Halving caution? **
So what now? The price has come very close to the 0.786 Fibonacci retracement level, which on the week of June 13 2016 cause a strong rejection which in the next 7 weeks extended as low as the 0.5 Fib and the 1W MA50 (blue trend-line).
** Are we accelerating on this Cycle? **
However that was after that Cycle's Halving (no 2, week of July 04 2016) and at the moment we are roughly 18 weeks (126 days) before (the next) Halving 4. If the recent phase has been indeed accelerated by the ETF speculation, then we have already entered the last period before the true parabolic rally of the Bull Cycle, what you can see on the chart as the '0.786 to ATH' range, which was 37 weeks (259 days) from the 0.786 Fib High (June 13 2016) to the 1W candle that made a new All Time High (ATH) on February 27 2017. According to that model, we can expect prices above 65000 by August 19 2024 (notice that even the ATH is on Nov 08 2021, the Fibs were taken from the April 12 2021 High, the true Cycle Top based on the 1W RSI).
** The underlying RSI trend-line **
Speaking of the 1W RSI, on top of the previous, very accurate pattern, I have identified an underlying trend-line (dashed) which shows that after it made a fake-out break above it, the RSI pulled-back on the recent lows Support, where the price's 0.5 Fib and 1W M50 cluster was. You can use that as an additional indicator to accumulate more BTC before the ATH gets tested.
So what do you think? Will Bitcoin pull back that much before the Halving and the eventual ATH test or you think we are going straight to +65k? Feel free to let us know in the comments section below!
-------------------------------------------------------------------------------
** Please LIKE 👍, FOLLOW ✅, SHARE 🙌 and COMMENT ✍ if you enjoy this idea! Also share your ideas and charts in the comments section below! This is best way to keep it relevant, support us, keep the content here free and allow the idea to reach as many people as possible. **
-------------------------------------------------------------------------------
💸💸💸💸💸💸
👇 👇 👇 👇 👇 👇

Cryptographic Truth Part 2 (Chainlink)Part 1
The bar pattern continues to play out like clockwork, but for how long? There comes a time when every bar pattern decouples and fails to mirror. One of the most amazing bar patterns I followed was in 2022, where a distribution bear market fractal from 2018 started forming at all-time highs for Bitcoin.
For the next 218 days, this bar pattern mirrored 2018. It was mind-blowing, also the easiest trading year by far. The TA below was published at the start of 2022, so we knew how the whole year would play out with incredible accuracy.
The key to finding out where the top will be is within Bitcoin; almost every big move Chainlink has made last cycle has been followed by a large Bitcoin move as well.
So if we go back to the very first time Chainlink broke a massive range, we can see Bitcoin had a massive move up in 2019.
This right here is the only move where Chainlink moved up without Bitcoin, and it only managed half its impulse wave before Bitcoin moved up.
It's the only time in history so far.
The next and last range break was again followed by a Bitcoin move, and the final push to Chainlink's all-time high to blow off top was followed by Bitcoin moves.
So once the range breaks, Chainlink has a very distinct pattern, as you can see in the chart below; it's always the same:
One impulse up
One Pullback
One impulse up
That's it; then the move is over. It happens very quickly. You can see there the two times it's happened outside of a bull market. It took 40-50 days. 2021 took double, most likely because we were in a bull market. We are definitely not in a bull market, so expect the move to last around 50 days.
Let's take a look at what happened in the Bull market. Chainlink already made a run from 10 dollars up to 53 dollars; we are at 10 dollars right now.
2021
Bitcoin - 23,500
Chainlink - 10 dollars
2023
Bitcoin - $30,600
Chainlink - 10 dollars
The difference is massive from 2021 to 2023, but regardless, both assets ended up hitting the golden pocket at the same time in 52 days! Amazing stuff really; both are much more in sync than I ever expected!
So if we take the bar pattern (BTC) of the cycle low in 2015 and overlay it on today's price action, we get the following.
Pretty close mirror, especially the first cycle bottom in June 2022. So if we look at what fib level that was in 2015, we can see Bitcoin topped out just under the golden pocket.
Now, if we go back to the comparison chart of BTC and LINK, we can see that if Bitcoin did, in fact, top out under the golden pocket, that would then put LINK at $25.
So if we take a look at the macro and range Fib retracements, we can see that the 4.236 range retracement for LINK comes in at $25.
Everything you've seen in this TA is how I arrived at the most probable outcome for Chainlink this year for . This TA can change very quickly depending on what level Bitcoin is at, so it's basically near impossible to predict where it will top. As new data comes in, we will change targets, so don't take this to the bank. One thing is for sure, the bar pattern will guide the way.
The main thing we need to focus on here is the first pullback in this zigzag fractal. Where it pulls back will give us a massive clue on where it tops.
Now I want to finish off by adding a crazy outcome for LINK. This has a low chance of playing out, in my opinion, but anything is possible. So instead of LINK topping out at $200 in October 2025, it tops out at $750. This would basically be a mirror move from 2019 in terms of fib levels. Highly unlikely, heck if we made a 100% retracement by mid-November, it would be possible.

Cryptographic Truth Final Run (Chainlink)The final run is starting, ahead of schedule it seems!
The fractal did not play out the same during this section; it seems we are running much faster! Normally, during this part of the zigzag fractal, Chainlink takes 12-15 days to bottom, but we seem to have done so in only 6 days, half the time it normally takes. I have covered this in all the previous Chainlink parts with pictures; take a look at parts 1-3.(Links Below)
The golden pocket sits at $35, and the fractal date when it tops out is December 15th, 2023.
A mirrored move would take us to $30 mid-December. I don't believe we will mirror because history shows us this final leg is much more extreme than the first.
This TA below of a BTC/LINK Fibonacci time sequence has been correct for years at predicting Chainlink events the next date is April 24th 2024.
Whats going to happen who knows but what we do know is when these dates arrive things happen with Chainlink .
Already re-entered my long here, got in at $14.6 after the descending wedge broke. This rally is only going to last until December. After that, there will be blood, one more flush out for sure. Below, I presented why, in a Bitcoin TA, sometime from March-April 2024, there will be something big happening that takes Bitcoin down to $20k, and if that happens, LINK will also be coming down.

Bitcoin- New high before correction?In my latest analysis of BITSTAMP:BTCUSD , I emphasized that the $35,000 mark serves as a robust support level for BTC.
As long as this threshold remains unbroken, the anticipation was for further upward momentum towards $40,000.
Now, with two weeks having passed since that analysis, Bitcoin has not only surpassed the $40,000 mark but has shown remarkable growth, exceeding 25% within this period.
This prompts a pivotal question: when can we expect a correction, or more precisely, from what level will it initiate?
In my opinion, there seems to be another peak on the horizon before any correction takes place, a notion supported by the current chart dynamics.
Following the recent upward surge and achieving a new high yesterday, BTC has started a consolidation phase in the form of a pennant.
This pattern, at least in theory, indicates the potential for another upward movement.
In summary, despite my consideration of a short trade, I am inclined to believe that the correction won't commence until BTC experiences another push, possibly surpassing the $45,000 threshold.

Bitcoin Roadmap 2025It's been a while since I did a Bitcoin TA; I've been focusing on Chainlink mostly these days. Still, I spent the last few days going over everything to come to this conclusion as the most probable outcome next two years . There's a high chance we won't see an all-time high until late 2024.
Like always, it's never easy to predict what Bitcoin is going to do next. You would think that this last cycle, we would have some sort of clear top and clear bottom so we could confidently calculate the next cycle top and bottom. But, in true Bitcoin fashion, we get a mixed bag.
Last Cycle
First time in history, Bitcoin had a double top for a cycle:
- April 2021 - Psychological Top
- November 2021 - Technical Top
The entire market topped out in April 2021; a few coins came in with higher highs later that year.
Something that is crystal clear is that Bitcoin took exactly the same amount of time to go from cycle low to cycle top (1064 days). It also took the same time to get from cycle low exactly 364 days; it was that easy, guys.
So, this is where we arrive at the first cycle top date: October 2025. 1064 days from the cycle low in November 2022 would give you that date.
The next date for a cycle top is August 2025, giving us the cycle top range from August to October 2025. A while back, I published a TA on Bitcoin's volume on a macro scale.
I found very interesting patterns and dates looking into the volume.
As you can see from this updated picture, every time Bitcoin has a bullish cross on volume, it takes 670 days to top. We just had the bullish cross in October this year, so 670 days from the cross would be August 2025.
Whenever Bitcoin breaks the 1/2 Gann, it takes about 924 days till the top. This cycle, we broke the 1/2 Gann in March 2023, so 924 days from March 2023 puts you at September 2025.https://www.tradingview.com/x/Wp7wYyMP/
It takes about 1400 days from cycle top to top; 1400 days from the November 2021 top would be October 2025.
This insanely powerful time sequence that predicted major Bitcoin events has failed this year for me for the first time; the next two dates are July 2024 and, you guessed it, September 2025.
If you calculate the time when the Gaussian channel turns green to the cycle top and calculate the average, you get 750 days. July 23rd, 2023, we Gaussian turned green; 750 days from that date puts you in the last week of August 2025, basically September 2025.
As you can see, the month September 2025 has a very high chance of being the month Bitcoin has its cycle high, and that would put Bitcoin, according to this model, at 175k.
### The 2024 Playbook
The most likely scenario is one big flush out next year. The Satoshi roundtable most likely is just going to do the classic 50% pullback into the CME gap, right?
Pre-Halving pullback is always deep and ranges from 40-50%! Well, why would they change their playbook? If it works every goddamn time, emotion gets the best of most of the traders and investors like every cycle. This is how I think it's going to play out.
Bitcoin rallies to 0.5-0.618 Fib 40-48k till Mid-December to mid-January 2023 at 48k; Bitcoin ETF gets approved, BULLISH NEWS floods the news and internet. www.coindesk.com
Analysts at Bloomberg predict that if a spot bitcoin ETF is not approved in this period, there’s still a 90% chance for approval by Jan. 10."
It is at this point where Bitcoin (40-48k) will reverse and go down to close the CME GAP at 20k and also creating the macro Bitcoin double bottom. It won't be easy to get Bitcoin down to that level, so "FLOOD BEARISH NEWS" is on the table. War, COVID, bank bankruptcies, new Bitcoin laws, new Bitcoin taxes - choose your weapon! When Bitcoin hits that 20k, that's when you load up!
You might think there is no way it's that easy - a 50% pullback to the CME GAP. But tell me if it works every time, why change or stop doing it?
The only comment I would like to make out of this CME gap is that it's the only time in history Bitcoin has closed and opened a gap in the same weekend. I could be wrong, but it seems to be so; if you do find another time, share it below.
So there you have it; will it play out like this? Who knows. One thing for sure is this rally won't last very long now.
Conclusion
- Rally to 40-48k: December 2023 - January 2024
- ETF approval: January 2024
- Reversal to 20k CME GAP by Halving (April 2024)
- Bull Market starts: September to November 2024
- Cycle Top: September 2025 to October 2025

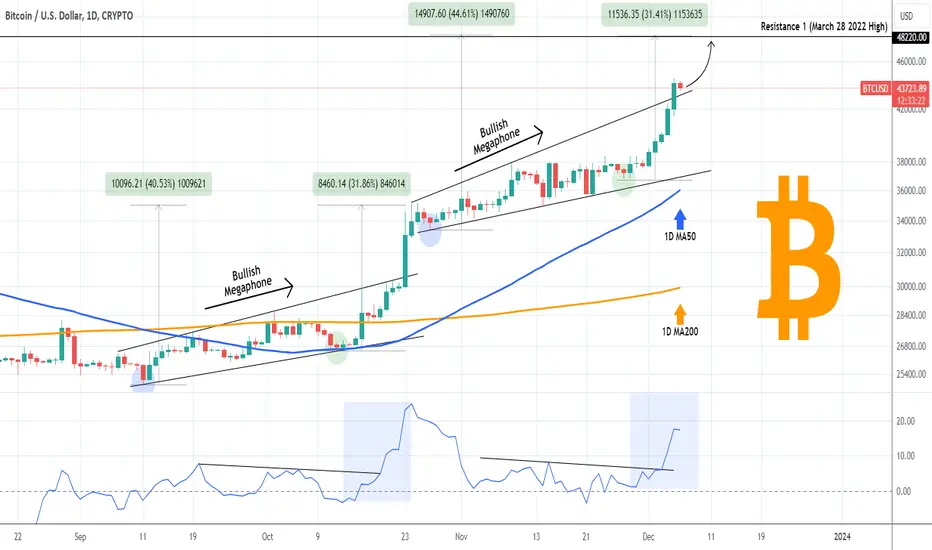
BITCOIN Megaphone breached! How high can the price go?Bitcoin (BTCUSD) broke yesterday above the Bullish Megaphone pattern that kept it at bay since the October 24 High. The previous Bullish Megaphone of September - October technically served as a consolidation belt before the price broke upwards to deliver a +31.86% peak from the Megaphone's last Higher Low and +40.50% from its first Low.
The ROC shows a similar behavioral structure between the two patterns. If it continues this way, then a new +31.50% leg will make a perfect contact on 48220, which is the March 28 2022 High, essentially the Bear Cycle's first Lower High and a key Resistance level of the current Bull Cycle. Technically, as long as the 1D MA50 (blue trend-line) holds (has been doing so since Sep 28), that is a realistic end target for this bullish wave.
But what do you think? Do you agree that this is a likely extension for this rally before the price pulls back or you expect a pull back now? Feel free to let us know in the comments section below!
-------------------------------------------------------------------------------
** Please LIKE 👍, FOLLOW ✅, SHARE 🙌 and COMMENT ✍ if you enjoy this idea! Also share your ideas and charts in the comments section below! This is best way to keep it relevant, support us, keep the content here free and allow the idea to reach as many people as possible. **
-------------------------------------------------------------------------------
💸💸💸💸💸💸
👇 👇 👇 👇 👇 👇
BITCOIN Hello April 2022! 40k cleared!Bitcoin (BTCUSD) broke above the psychological 40000 mark, trading now even above 41k. Those are levels that we haven't seen since the week of April 18 2022! And we don't know yet where this euphoric (on Fed, ETF anticipation) candle will stop.
Technically, the next Resistance level is the 48220 High that was the first Lower High made after the November 2021 All Time High, on the week of March 28 2022. With the current trend structure it is not unrealistic to hit this zone as the pattern remains a Channel Up since the November 2022 market bottom. The current bullish leg resembles that of March 2023 and the price action now is on a course to price the new Higher High near the 48220 Resistance.
Beyond that it is high speculation but if it continues to repeat the waves of the Channel Up and the sequence after the April 10 2023 High, we could see a Falling Wedge bottoming close to Halving 4 (expected in April 2024) and as you are all aware of, the supply shock that the Halving causes to BTC, should gradually set in motion the Parabolic Rally of the Bull Cycle.
In addition to the above, BTC is about to complete in the next 2-3 weeks the first ever Golden Cross on the 1W time-frame, which is when the 1W MA50 (blue trend-line) crosses above the 1W MA200 (orange trend-line). It will be really interesting to see how the market will react for the first time to such a bullish technical pattern.
But what do you think? Do you think that Channel Up is too scripted to be true? If not, can Bitcoin test 48k next straight away or a pull-back to test the middle/ bottom of the Demand Zone would be more realistic? Feel free to let us know in the comments section below!
-------------------------------------------------------------------------------
** Please LIKE 👍, FOLLOW ✅, SHARE 🙌 and COMMENT ✍ if you enjoy this idea! Also share your ideas and charts in the comments section below! This is best way to keep it relevant, support us, keep the content here free and allow the idea to reach as many people as possible. **
-------------------------------------------------------------------------------
💸💸💸💸💸💸
👇 👇 👇 👇 👇 👇

🚨Bitcoin is Ready for Correction🚨✅Bitcoin moved as I expected in previous posts and was able to touch the upper line of the Ending Diagonal again ( MicroStrategy helped in this movement by buying $600 million of Bitcoin).
📚The Ending Diagonal Pattern ( Elliot's point of view) is the same as the Rising Wedge Pattern ( Classical Analysis point of view).
🌊According to the theory of Elliott waves , Bitcoin is at the end of the main wave 3, so to complete this wave, microwave 5 of the main wave 3 had an Ending Diagonal structure.
💡In my opinion, the Ending Diagonal Pattern is standard so that the Fibonacci ratios are consistent with this pattern, as well as Regular Divergence(RD-) between Consecutive Peaks .
🔔I expect Bitcoin to start falling after breaking the lower line of the Ending Diagonal Pattern and Support lines and at least fall to 🟢 Support zone($36,000_$35,280) 🟢 or maybe Fill the lower 🔵 CME Gaps 🔵.
❗️⚠️Note⚠️❗️: If BTC can break the 🟡PRZ🟡, the Scenario will change.
❗️⚠️Note⚠️❗️: An important point you should always remember is capital management and lack of greed.
Bitcoin Analyze ( BTCUSDT ), 4-hour time frame ⏰.
Do not forget to put Stop loss for your positions (For every position you want to open).
Please follow your strategy; this is just my Idea, and I will gladly see your ideas in this post.
Please do not forget the ✅' like '✅ button 🙏😊 & Share it with your friends; thanks, and Trade safe.

🗺️Bitcoin Roadmap🗺️⏰(1-hour time frame)⏰💡Bitcoin tried many times to break the 🟡 Price Reversal Zone(PRZ) 🟡 but failed every time.
🌊In terms of Elliott wave theory , Bitcoin seems to have found microwave 5 of the main wave C at the 🟡Price Reversal Zone(PRZ)🟡 and the upper line of the Rising Wedge Pattern .
💡One of the confirmation signs of our wave counting can be the presence of Regular Divergence(RD-) between two micro waves 3 and 5 of the main wave C.
🔔I expect Bitcoin to attack the Support lines and the lower Rising Wedge Pattern line after breaking the 🟢 Support zone($38,000_$37,650) 🟢.
❗️⚠️Note⚠️❗️: An important point you should always remember is capital management and lack of greed.
Bitcoin Analyze ( BTCUSDT ), 1-hour time frame ⏰.
Do not forget to put Stop loss for your positions (For every position you want to open).
Please follow your strategy; this is just my Idea, and I will gladly see your ideas in this post.
Please do not forget the ✅' like '✅ button 🙏😊 & Share it with your friends; thanks, and Trade safe.

BITCOIN on the verge of a global money supply rally.On today's study we plot Bitcoin (BTCUSD) against two unique formulae that encompass the basic essence of the global money supply. The formula in blue has a differentiation towards Chinese bond yields while the orange on the Chinese Yuan. Both are regressed against the U.S. Dollar and the batch of the U.S. Balance Sheet, Chinese Central Bank Balance Sheet and the ECB's Assets.
BTC bottoms exactly when the orange trend-line bottoms and it starts the parabolic rally of its Bull Cycle when the blue trend-line bottoms on a Lower Low. Right now blue has started to rise after just bottoming on a Lower Low.
This is contrary to common belief and traditional Halving theory, but according to the above monetary metrics BTC may just be starting a new parabolic rally much earlier than anticipated.
Do you agree or it's too soon and you'll wait for the Halving? Feel free to let us know in the comments section below!
-------------------------------------------------------------------------------
** Please LIKE 👍, FOLLOW ✅, SHARE 🙌 and COMMENT ✍ if you enjoy this idea! Also share your ideas and charts in the comments section below! This is best way to keep it relevant, support us, keep the content here free and allow the idea to reach as many people as possible. **
-------------------------------------------------------------------------------
💸💸💸💸💸💸
👇 👇 👇 👇 👇 👇

BITCOIN Monthly RSI tells you where the Cycle Top will be!Following our recent Bitcoin (BTCUSD) Thanksgiving study on the trend-line angles, we decided to expand it a bit further and apply a similar reasoning on the RSI, this time on the 1M (monthly) time-frame.
The result is more than informative as, with the additional use of the Fibonacci Channel levels for better display, we see that from bottom to top, every Cycle displays an RSI trend-line on a 40° angle (approximately). Applying the same measurement on the current Cycle, we get a rough date for the next Top at around March 2025. This doesn't of course give a dollar figure of BTC's price at that time but rather tells you to (at least) start considering taking (some) profits on your holdings.
Do you agree with that model? Are going to sell around that date? Feel free to let us know in the comments section below!
-------------------------------------------------------------------------------
** Please LIKE 👍, FOLLOW ✅, SHARE 🙌 and COMMENT ✍ if you enjoy this idea! Also share your ideas and charts in the comments section below! This is best way to keep it relevant, support us, keep the content here free and allow the idea to reach as many people as possible. **
-------------------------------------------------------------------------------
💸💸💸💸💸💸
👇 👇 👇 👇 👇 👇
