Bitcoin is Ready to ⚔️Attack⚔️ to Support zone⏰(1-Hour)⏰✅As I expected, Bitcoin could NOT break the previous Top and important 🟡Price Reversal Zone(PRZ) 🟡.
🏃♂️Bitcoin has been moving in an Ascending Channel near the 🟡Price Reversal Zone(PRZ) 🟡for the past few days but managed to break the ascending channel and Support line(1) a few hours ago.
🌊According to Elliott's wave theory , all the waves inside the ascending channel formed a Double Three Correction(WXY) .
💡As in my previous post, Bitcoin still has a chance to fill the first 🔵CME Gaps🔵.
🔔I expect Bitcoin to gradually approach the 🟢 Support zone($36,000_$35,560) 🟢 and Support line(2) and eventually break them.
❗️⚠️Note⚠️❗️: An important point you should always remember is capital management and lack of greed.
Bitcoin Analyze ( BTCUSDT ), 1-hour time frame ⏰.
Do not forget to put Stop loss for your positions (For every position you want to open).
Please follow your strategy; this is just my Idea, and I will gladly see your ideas in this post.
Please do not forget the ✅' like '✅ button 🙏😊 & Share it with your friends; thanks, and Trade safe.
Bitcoinsignals

Bitcoin- Back at resistance. Will it break this time?In my previous BtcUsd analysis, I said that 35k-35.5k is strong support for bitcoin and the main cryptocurrency remains bullish as long as this level is intact.
As we can see from the chart, BtcUsd touched and reversed from this zone 3 times in the past month suggesting there is a strong demand under 36k.
Yesterday the price rose back to resistance and I'm looking for a break.
In this instance, Bitcoin could pass above the important 40k level.
I remain bullish as long as support is intact.

BITCOIN ETF what?? This is a cyclical USD-fueled rally!Bitcoin (BTCUSD) is seeing in the past 30 days the first legitimate medium-term rally since March - April. The ETF acceptance anticipation has been cited as one of the reasons but after the SEC's latest delay, we see that it hasn't affected BTC's price as much and the reason is something else. Perhaps the strongest technical reason why Bitcoin has been rallying, is the sharp decline of the U.S. Dollar Index (DXY). Displayed by the green trend-line, we can see that its October 09 peak coincided with Bitcoin's rally.
DXY tends to peak first and after it starts to decline, Bitcoin (also a general observation for commodities too, not limited to digital assets) catches as a few days later. As you can see on this chart (1W time-frame), it is a cyclical behavioral pattern where an initial decline on the DXY (red Flag) fuels BTC's last pre-Halving rally. When this DXY pattern (blue Arc) ends, it makes a Higher High peak outside the pattern and gets hammered aggressively (red hammer). This starts BTC parabalic rally, what we call at Tradingshot "Post Halving expansion". We are expecting that the following summer.
Do you think however that a SEC ETF approval earlier in 2024 will dramatically increase the chances of such a rally happening earlier or it's more tied to the DXY? Feel free to let us know in the comments section below!
-------------------------------------------------------------------------------
** Please LIKE 👍, FOLLOW ✅, SHARE 🙌 and COMMENT ✍ if you enjoy this idea! Also share your ideas and charts in the comments section below! This is best way to keep it relevant, support us, keep the content here free and allow the idea to reach as many people as possible. **
-------------------------------------------------------------------------------
💸💸💸💸💸💸
👇 👇 👇 👇 👇 👇

BITCOIN First 1W MA50/100 Bullish Cross since December 2019!!Bitcoin (BTCUSD) will complete this week or the next the first 1W MA50 (blue trend-line) - MA100 (green trend-line) Bullish Cross since the week of December 02 2019! Such a bullish pattern, exactly 4 years after, is a Cyclical buy signal which technically is the last we are going to get during this Cycle.
With the Halving being a fundamental signal, this Bullish Cross is the early signal of a pre-Halving buy, which sets the stage for the Bull Cycle's final parabolic rally. Time-wise it takes place almost during the same time period (Time Fib 2.236 in 2016 while today and 2019 it took place on the 2.0 Time Fib). As you can see, following this formation, BTC tends to rally to the 0.786 Fibonacci retracement level (if it hasn't done so before as in 2019), while the 0.5 Fib turns into the Support (it wouldn't have broken in 2020 if it weren't for the COVID crash).
Observe the similarities on the 1W MACD also around the time of the 1W MA50/100 Bullish Cross. It rises on a Bullish Cross and forms a Bearish Cross a few weeks after, which delivers a low price level we won't break again during the rest of the Bull Cycle. So to sum it up, moving forward, Bitcoin targets the 0.786 Fibonacci at $50000, while the 0.5 or at most the 0.382 Fib (32000 - 27000) will support.
But what do you think as we move towards the April Halving? Will 30k hold and more importantly are we on the path to hit 50k soon? Feel free to let us know in the comments section below!
-------------------------------------------------------------------------------
** Please LIKE 👍, FOLLOW ✅, SHARE 🙌 and COMMENT ✍ if you enjoy this idea! Also share your ideas and charts in the comments section below! This is best way to keep it relevant, support us, keep the content here free and allow the idea to reach as many people as possible. **
-------------------------------------------------------------------------------
💸💸💸💸💸💸
👇 👇 👇 👇 👇 👇

BITCOIN has entered the Halving Phase and targets 50k.Bitcoin (BTCUSD) is under heavy volatility lately due to the ETF development and in times like this, we tend to zoom out into the longer term time-frames such as the 1W to get a better perspective of where we might be at with relation to past Cycles, in an attempt to filter out the short/ medium-term volatility of such news.
** Cycle classification **
On this chart we compare the current to the 2018 - 2021 and 2014 - 2017 Cycles. To get an insightful understanding of time and levels, we have categorized the Phases into Bear (red), 1st Rally (orange), Pre & Post Halving (blue) and Parabolic Rally (green).
Based on that classification, BTC has just entered the Pre & Post Halving phase, with Halving 4 expected to take place in April 2024. During that phase, the price reaches or has already reached (in the case of 2020) the 0.786 Fibonacci retracement level, while keeping the 0.382 Fibonacci intact as a Support (notable exception of course March 2020 with the COVID crash, which was however an irregularity due to its once in 100 years occurrence). The 1W MA50 (blue trend-line) also poses as a loose Support.
** Now and new All Time High **
On the current Cycle, the 0.786 Fib is at $50000, so based on our model, either now or 3-4 months after the Halving it should be reached. At the same time, we shouldn't drop below 27000 (0.382 Fibonacci).
Once the 0.786 Fib breaks, BTC should test the 69000 All Time High (ATH) in a matter of weeks, which will be the start of the Parabolic Rally phase. Beyond that, it is a matter of how high the current Cycle can extend to in pricing the next ATH. The 2017 Cycle peaked on the 2.382 Fib extension and the 2021 on the 1.618 Fib extension. That is the Theory of Diminishing returns on every Cycle, as adoption gets greater. Technically it is natural to expect no more than 1.382 Fib, which is a little over $120000. Perhaps the worst case scenario might be 100k but of course much depends on the fundamentals at the time, e.g. how adoption evolves, how much capital will flow in case of an ETF approval etc.
But what do you think? Do you agree that 50k will be reached within our designated Pre & Post Halving phase? Or it is too high too soon? Feel free to let us know in the comments section below!
-------------------------------------------------------------------------------
** Please LIKE 👍, FOLLOW ✅, SHARE 🙌 and COMMENT ✍ if you enjoy this idea! Also share your ideas and charts in the comments section below! This is best way to keep it relevant, support us, keep the content here free and allow the idea to reach as many people as possible. **
-------------------------------------------------------------------------------
💸💸💸💸💸💸
👇 👇 👇 👇 👇 👇

BITCOIN This'll be the last pullback before the parabolic rally** ETF anticipation **
Bitcoin (BTCUSD) is rising against the majority's sentiment, which is something it does more often than not, fueled of course on a large degree by the heavy speculation over the SEC's Bitcoin ETF decision. Fundamentally, an approval can certainly cause another leg upwards based on euphoria, before the effect recedes as we move towards Halving 4 in April 2024.
** The RSI's Fibonacci Channel motion **
Based on certain technical data on the 3W time-frame, we can technically see only a minor uptick and then a multi-week pull-back before the bullish trend is resumed. This is based on the 3W RSI, which is trading inside a Fibonacci Channel Down since its inception, testament that despite BTC's enormous long-term growth, each Cycle shows diminishing returns (as adoption gets higher).
The RSI is almost on the 0.5 Fibonacci retracement level, which in the past has delivered a pull-back to at least the 0.382 Fib (exception September 2019 when it dropped lower as it corrected the huge Libra hype). The 0.5 Fib rejection is shown by the red arrows. When a rebound took place on the 0.382 Fib (green arrows) Bitcoin started a rally that never looked back. The whole price action is displayed by the blue circles. On top of that, see how beautifully the overall motion is depicted by the Sine Waves.
** Last correction before the rally **
Of course much depend on the upcoming ETF decision, but even in the event of a considerable new price surge, BTC should technically give one last pull-back at least to the 0.382 3W RSI Fib, that will most likely be the last opportunity to buy before the Bull Cycle's parabolic rally starts.
Do you agree with this RSI Fibonacci projection? Feel free to let us know in the comments section below!
-------------------------------------------------------------------------------
** Please LIKE 👍, FOLLOW ✅, SHARE 🙌 and COMMENT ✍ if you enjoy this idea! Also share your ideas and charts in the comments section below! This is best way to keep it relevant, support us, keep the content here free and allow the idea to reach as many people as possible. **
-------------------------------------------------------------------------------
💸💸💸💸💸💸
👇 👇 👇 👇 👇 👇

BITCOIN Is this the temporary Top before the Halving?Bitcoin (BTCUSD) has almost hit 37k today, and is getting closed to the 0.618 Fibonacci retracement level (39300), which is a key level for the Bull Cycle. We may be seeing a temporary Top for the market on what can be the start of a few months of sideways trading/ consolidation before the price starts rising again towards Halving 4 (April 2024).
The reasoning behind this assumption is that the Higher Lows trend-line that starts at the bottom of every Cycle, formed medium-term Tops (green circles) in the past two Cycles on February 15 2016 and February 10 2020, as it turned into a Higher Highs Resistance. The price has been at or marginally below the 0.618 Fibonacci level on those occasions. At the same time, the dashed Higher Lows trend-line always supported, with the exception of March 2020 and the COVID crash, which was a market extreme. Every Cycle has so far had its own extreme event below the dashed Higher Lows, whether that was the Bitfinex crash in August 2015 or more recently the FTX crash in November 2022.
Needless to mention that after a certain point, the 1W MA50 (blue trend-line) always becomes the Bull Cycle's long-term Support, and it appears that we are once more past this level as it successfully held from August until September. It is therefore very encouraging for long-term investors that both the 1W MA50 and the dashed trend-line have most likely turned into the Support levels that will lead to the point that the Parabolic Rally will take off but at the same time, we may be entering a phase where for a few weeks, BTC will trade sideways in a potential new accumulation phase.
So what do you think? Is Bitcoin about to price a temporary top or will it march past the 0.618 towards 45k-50k? Feel free to let us know in the comments section below!
-------------------------------------------------------------------------------
** Please LIKE 👍, FOLLOW ✅, SHARE 🙌 and COMMENT ✍ if you enjoy this idea! Also share your ideas and charts in the comments section below! This is best way to keep it relevant, support us, keep the content here free and allow the idea to reach as many people as possible. **
-------------------------------------------------------------------------------
💸💸💸💸💸💸
👇 👇 👇 👇 👇 👇

Long trade setup for INJUSDTFor the BINANCE:INJUSDT.P Long Trade Setup, the following values are suitable for our interval trade:
Entry: 16.780
Target: 17.405
Stop: 16.194
Cost Reduction: -
The profit is reasonable relative to the risk.

BITCOIN Closer to the Parabolic Rally than we think!Bitcoin (BTCUSD) typically starts the (final and most aggressive) Parabolic Rally sequence of the Bull Cycle straight after each Halving event. The next one (Halving 4) is expected in April 2024. Not too far away but the Vortex Indicator (VI) and Bollinger Bands Width (BBW) on the 2M time-frame show, we may be on the verge of starting it before the Halving.
As you can see, the BBW historically bottoms after the Halving and may have as a Support a (dotted) Lower Lows trend-line. It is on course to bottom there in March 2024. But it is the VI, which may only be max 2 months away from making a Bullish Cross, which is a formation it has historically done right before BTC starts a long-term sequence of straight green candles (Parabolic Rally) straight to the Bull Cycle's peak.
As a result, we may see this cross taking place on the next 2M candle (Jan 2024). What do you think? Can it be that we are that closer to the start or a "green only candle rally" than we think? Feel free to let us know in the comments section below!
-------------------------------------------------------------------------------
** Please LIKE 👍, FOLLOW ✅, SHARE 🙌 and COMMENT ✍ if you enjoy this idea! Also share your ideas and charts in the comments section below! This is best way to keep it relevant, support us, keep the content here free and allow the idea to reach as many people as possible. **
-------------------------------------------------------------------------------
💸💸💸💸💸💸
👇 👇 👇 👇 👇 👇

BITCOIN Will a BTC ETF mirror Gold's post approval +350% rise?Undoubtedly it's been the talk of the year. We are talking of course about a potential Bitcoin ETF approval by the U.S. Securities and Exchange Commission (SEC). Many analysts believe that BTC's recent rise has been due to euphoria on a potential positive result. Expectations certainly are not always met but this time, they are higher than ever.
** Are Bitcoin and Gold comparable? **
So, do we have any historic framework to relate to and work on? Possibly. Bitcoin (BTCUSD) has been dubbed as the digital Gold due to its store of value (theoretical) attribute. Even though they are different markets and two assets that certainly have different volatilities, it is understandably so, as Bitcoin (portrayed on the chart by orange trend-line) is relatively new (compared to Gold's traditional monetary backing), on much lower capitalization and is natural to be so volatile in its early stages until mass adoption happens and the market matures.
** Gold's ETF approval pattern **
As a result, Gold's ETF introduction back in March 28 2003 may be the perfect (and perhaps only dependable) comparison we can make if we want to put a potential Bitcoin ETF approval into context. As you can see, Gold (portrayed on the chart by the candles) rose massively by +350% since its ETF approval. The rise from the previous peak (January 1980) to the post ETF one (August 2011), has been +124%. Even though they are on different time-frames (but understandably so as Bitcoin is digital and moves on a much faster pace), we have adjusted BTC's last Bear Cycle and the subsequent first Bull Cycle rally, on Gold's price action from the 1980 peak to the March 2003 ETF approval. Of course this assumes that Bitcoin's ETF will be approved and even more so now, but this is the only basis for comparison we can make. When/ if approved, the width (and price ranges) can be adjusted.
** Bitcoin's projection based on Gold's ETD pattern **
So on the right chart we can see a post ETF approval projection for Bitcoin based on Gold's pattern. As +350% rise would push the price near $160000. The symmetry is astonishing as the peak-to-peak trend-line from BTC's November 2021 High to that potential +350% one (160k) would also be +124%, exactly like Gold's! Amazing coincidence indeed but certainly shows us just how pattern recognition and comparison can give interesting results. Especially on identical fundamentals.
But what do you think? Will a SEC approved Bitcoin ETF follow into Gold's footsteps? Feel free to let us know in the comments section below!
-------------------------------------------------------------------------------
** Please LIKE 👍, FOLLOW ✅, SHARE 🙌 and COMMENT ✍ if you enjoy this idea! Also share your ideas and charts in the comments section below! This is best way to keep it relevant, support us, keep the content here free and allow the idea to reach as many people as possible. **
-------------------------------------------------------------------------------
💸💸💸💸💸💸
👇 👇 👇 👇 👇 👇

BITCOIN Get ready for $36.5k. One opportunity only to buy lower.Bitcoin (BTCUSD) is on the rise again following a late Sunday pull-back. This is a short-term analysis on the 4H time-frame where we point out the similarities of the current fractal with October 02 - 06 and September 19 - 23. As you can see the blue circle indicates that BTC already priced the first Low on the 0.236 Fibonacci level when the descending (Channel Down) RSI pattern that hit the Arc shape, and there is one possibility to make a Lower Low when the 4H RSI hits the 30.00 oversold mark. That will be the most optimal buy entry for those who missed the rally.
If however the price breaks above the 35150 High (Fib 1.0) then we will have a standard bullish break-out signal in our hand. In both cases our (short-term) target is the 1.618 Fibonacci extension at $36500.
Do you think Bitcoin will give that pull-back opportunity before 36.5k? Feel free to let us know in the comments section below!
BONUS MATERIAL:
-------------------------------------------------------------------------------
** Please LIKE 👍, FOLLOW ✅, SHARE 🙌 and COMMENT ✍ if you enjoy this idea! Also share your ideas and charts in the comments section below! This is best way to keep it relevant, support us, keep the content here free and allow the idea to reach as many people as possible. **
-------------------------------------------------------------------------------
💸💸💸💸💸💸
👇 👇 👇 👇 👇 👇

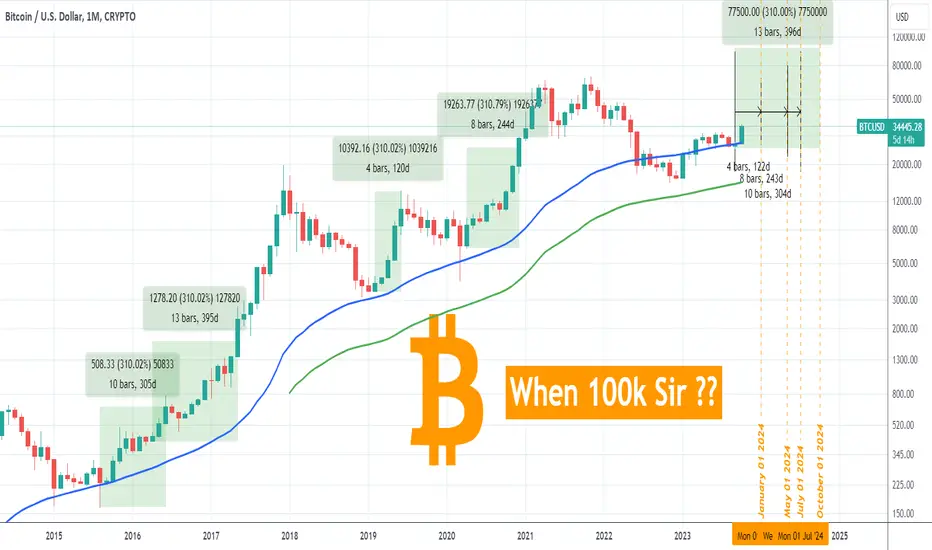
BITCOIN When 100k Sir? Pick your poison..Bitcoin (BTCUSD) has started yet another of its impressive rallies and it's not even its final year parabolic one as we aren't yet past the next Halving! However as you can see on this 1M chart, +300% (310 in our particular example) rallies aren't all that uncommon for BTC even in the stages before the final parabolic rally, which is historically the most aggressive of the Bull Cycle.
In fact, since 2015, Bitcoin had 2 such +310% rallies on each Cycle (4 in total), before the parabolic one. The most aggressive took 4 months (120 days) to reach +310%, the next one 8 months (244 days), then 10 months (305 days) and the longest one took 13 months (395 days). It's worth noting here that so far we haven't had any such rally during the current Cycle.
Based on these ranges we can expect a +310% rally on Bitcoin, which would make a direct hit on the psychological and highly anticipated macro level of $100k, either on January 2024, May 2024, July 2024 or October 2024. Rallies of such magnitude don't happen without a reason and with the high anticipation of the Bitcoin ETF, the market may have the catalyst it needs to really boost this rally. Depending on its magnitude, media awareness and pure demand, pick you expected date!
So do you think we will reach 100k sooner or later based on this model? Or we will need the final parabolic rally to do so? Feel free to let us know in the comments section below!
-------------------------------------------------------------------------------
** Please LIKE 👍, FOLLOW ✅, SHARE 🙌 and COMMENT ✍ if you enjoy this idea! Also share your ideas and charts in the comments section below! This is best way to keep it relevant, support us, keep the content here free and allow the idea to reach as many people as possible. **
-------------------------------------------------------------------------------
💸💸💸💸💸💸
👇 👇 👇 👇 👇 👇
BITCOIN Fueled by sellers! There is no going back from this!Bitcoin (BTCUSD) had yet another great fractal signal last time we looked (October 13) that caught this whole $8000 rally from the 1D MA50 (see chart below):
Many still argue that fractal analysis doesn't work, but for BTC in particular it has proved that time and time again, helps at providing timely entries and exits, especially on the long-term time-frames.
Such is the 1W time-frame, where we want to shift our attention to today. The price broke above the 0.5 Fibonacci retracement level (top to bottom Cycle), while the 1W MACD formed a Bullish Cross. Remarkably, when those parameters were fulfilled, while BTC was supported by the 1W MA50 (blue trend-line), the market 'never looked back' from this. Exception and slight delay to this sequence was the March 2020 COVID crash (black swan event), as the price wouldn't have broken below the 1W MA50 or the 0.5 Fib as a matter of fact, if this 'irregularity' hasn't happened.
Also, the 1W MACD wouldn't have broken below its Higher Lows trend-line, a line taken from the 2015 - 2017 Bull Cycle. If we apply it again on the current Cycle, we can see how well it has been holding. Every 1W MACD Bullish Cross is a buy opportunity from now on.
Technically we should see new All Time Highs within 8-10 month from now. But what about you? Do you agree with this historical correlation and that 'there is no going back from this' for the price now? Feel free to let us know in the comments section below!
-------------------------------------------------------------------------------
** Please LIKE 👍, FOLLOW ✅, SHARE 🙌 and COMMENT ✍ if you enjoy this idea! Also share your ideas and charts in the comments section below! This is best way to keep it relevant, support us, keep the content here free and allow the idea to reach as many people as possible. **
-------------------------------------------------------------------------------
💸💸💸💸💸💸
👇 👇 👇 👇 👇 👇

BITCOIN H&S close to being invalidated.Bullish move of the year?Bitcoin (BTCUSD) almost hit today 31050, which is the Shoulder level from the April 14 High that formed the Left Shoulder of the Head and Shoulders (H&S) pattern of the last 6 months. As long as this holds, it will be the Right Shoulder of the pattern, which translates into a Sell Signal, targeting the 28150 Support and potential contact with the 1D MA50 (blue trend-line).
If on the other hand the price closes above the Shoulder level or better yet the Head level (31830), it could be perhaps the bullish break-out move of the year. A H&S pattern typically targets the 2.0 Fibonacci extension from Head to neckline. We could assume that the 2.0 Fib invalidation target could be from neckline to Shoulder level. That would give us a buy target slightly above 37000.
Feel free to let us know in the comments section below!
-------------------------------------------------------------------------------
** Please LIKE 👍, FOLLOW ✅, SHARE 🙌 and COMMENT ✍ if you enjoy this idea! Also share your ideas and charts in the comments section below! This is best way to keep it relevant, support us, keep the content here free and allow the idea to reach as many people as possible. **
-------------------------------------------------------------------------------
💸💸💸💸💸💸
👇 👇 👇 👇 👇 👇

BITCOIN Overbought but it doesn't matter!Bitcoin (BTCUSD) is rising strongly today, against the majority's sentiment which after the ETF fake news earlier, was calling for (much) lower prices. We are almost on Monday's High, with the 1D RSI overbought above the 70.00 territory, but that may not matter at all, in case you are expecting a technical correction.
Assuming the 1 year pattern is a Channel Up, the current rise is the technical bullish leg towards a new Higher High. It is supported by the 1D MA50 (blue trend-line) and now by the 1D MA100 (green trend-line) as well. The previous bullish leg was also confirmed after breaking above the Lower Highs trend-line but didn't stop despite turning overbought on the 1D RSI. On the contrary it needed to form a Bearish Divergence of Lower Highs, before the first pull-back took place.
As a result, we don't expect a correction now, despite the overbought RSI but rather will wait for at least 3 Lower Highs, in order to take profit and wait for a 1D MA100 correction. That will be the buy with which we will target a symmetrical Higher High at 35500 on the 1.5 Fibonacci extension.
But what do you think? Does it matter that BTC is overbought or not and we will see much higher prices now? Feel free to let us know in the comments section below!
-------------------------------------------------------------------------------
** Please LIKE 👍, FOLLOW ✅, SHARE 🙌 and COMMENT ✍ if you enjoy this idea! Also share your ideas and charts in the comments section below! This is best way to keep it relevant, support us, keep the content here free and allow the idea to reach as many people as possible. **
-------------------------------------------------------------------------------
💸💸💸💸💸💸
👇 👇 👇 👇 👇 👇

BITCOIN 7 months of PAIN coming to an end??Bitcoin (BTCUSD) broke this week above the 1W MA100 (green trend-line) for the first time since the weekly candle of May 02 2022. The weekly candle closing is of particular interest as the price has quickly pulled back so far below the 1W MA100 (cointelegraph's fake news tweet). If it closes above it, then we may finally see an end to BTC's painful 7-month consolidation that is loosely supported by the 1W MA50 (blue trend-line).
Along with the 1W MA100, we may also get a huge bullish signal from the 1W RSI, which broke above its Lower Highs trend-line (that is in effect throughout the whole consolidation), and if the week closes above it, will give the early buy. An emerging Bullish Cross on the 1W MACD, will come as the icing on the cake to confirm the bullish break-out.
But what do you think? Do you think this 7-month agony is about to end on this week's closing? Feel free to let us know in the comments section below!
-------------------------------------------------------------------------------
** Please LIKE 👍, FOLLOW ✅, SHARE 🙌 and COMMENT ✍ if you enjoy this idea! Also share your ideas and charts in the comments section below! This is best way to keep it relevant, support us, keep the content here free and allow the idea to reach as many people as possible. **
-------------------------------------------------------------------------------
💸💸💸💸💸💸
👇 👇 👇 👇 👇 👇

✈️Bitcoin Will Go Up again✈️🔨Bitcoin seems to be breaking the Ascending Channel and 🟢 Support zone($27,580-$27,300) 🟢.
🌊According to Elliott's wave theory , Bitcoin has completed a Zigzag correction(ABC/5-3-5) in the ascending channel, but we have to wait for the next moves to confirm the end of the main wave B .
💡Also, the RSI indicator managed to break the Uptrend line and is currently moving near the 50% line ; I expect the RSI indicator to pull back to the Uptrend line .👇
🔔I expect Bitcoin to at least decline to the next 🟢 Support zone($26,880-$26,500) 🟢 and then rise again and touch the minimum Resistance line again.
Bitcoin Analyze ( BTCUSDT ), Daily time frame ⏰.
Do not forget to put Stop loss for your positions (For every position you want to open).
Please follow your strategy; this is my Idea, and I will gladly see your ideas in this post.
Please do not forget the ✅' like '✅ button 🙏😊 & Share it with your friends; thanks, and Trade safe.

BITCOIN Just accept that we are NOT going any LOWER than this!Kind of catchy title but 100% true nonetheless, at least according to this chart. On today's analysis we see Bitcoin (BTCUSD) on the 1W time-frame, supported by the 1W MA50 (blue trend-line).
Every time on these Cycles you see it broke above the previous Resistance (dashed line) and turned it into Support without breaking it, while the 1W MA50 was supported and a 1W MACD Bullish Cross took place above the 0.0 neutral mark, BTC never reached any prices lower than that and instead initiated a parabolic rally. We can see that when the Resistance-turned-Support broke due to the COVID crash, the 1W MA50 had also broken already (November 2019), while the 1W MACD Bullish Cross took place below 0.0. Thus not a sign of a parabolic rally.
These set of parameters show that indeed BTC won't be going lower than last months bottom any more. Do you think that will be the case and we can call September's low a bottom? Feel free to let us know in the comments section below!
-------------------------------------------------------------------------------
** Please LIKE 👍, FOLLOW ✅, SHARE 🙌 and COMMENT ✍ if you enjoy this idea! Also share your ideas and charts in the comments section below! This is best way to keep it relevant, support us, keep the content here free and allow the idea to reach as many people as possible. **
-------------------------------------------------------------------------------
💸💸💸💸💸💸
👇 👇 👇 👇 👇 👇

Bitcoin Analyze(Road map)🗺️⏰(1-Hour)⏰👋 Hi everyone.
🙏 First, I have to apologize for the busy chart, but I will try to draw all the important zones and lines for you so that the posts have an 📚 Educational aspect 📚.
🏃♂️Bitcoin is moving in the 🟢Support zone($26,880-$26,500)🟢 near the 🟣 Yearly Pivot Point($26,737) 🟣, Support lines and 🔵 50_SMA(Daily) 🔵.
🌊According to the theory of Elliott waves , Bitcoin seems to be completing its 5th wave with the help of the Expanding Ending Diagonal .
💡Also, we can see Regular Divergence(RD+) between two Consecutive valleys .
🔔I expect Bitcoin to move towards the Resistance line and 🔴 Resistance zone($27,600-$27,300) 🔴 after breaking the upper line of the Expanding Ending Diagonal .
❗️ Note ❗️: Below the 🟢Support zone($26,880-$26,500)🟢 , Bitcoin has a 🔵 CME Gap($26,400-$26,290) 🔵, which I don't think Bitcoin will fill this gap in this attack, but if this zone is filled, the scenario will change .
--------------------------------------------------------------------------------
🌐➕ Positive News ➕🌐:
First Abu Dhabi Bank completes cross-border payments testing on JPMorgan Onyx.
Telegram And TON Foundation Collaborate With Alibaba Cloud In Quest For Fastest Blockchain.
Bitcoin Lightning Network growth jumps 1,200% in 2 years.
Billionaire Paul Tudor Jones Still Likes Bitcoin Despite Price Drop.
Tether Continues To Flow Into Exchanges.
JPMorgan debuts tokenization platform, BlackRock among key clients: Report.
Crypto HODLers Stash Bitcoin Worth $1.35B Each Month, Onchain Data Show.
ARK Invest updates spot Bitcoin ETF proposal in response to SEC criticisms.
🌐➖ Negative News ➖🌐:
Crypto exchange Bitstamp to end Canadian services in January
Jim Cramer thinks 'Mr. Bitcoin is about to go down big'
--------------------------------------------------------------------------------
Bitcoin Analyze ( BTCUSDT ), 1-hour time frame ⏰.
Do not forget to put Stop loss for your positions (For every position you want to open).
Please follow your strategy; this is just my Idea, and I will gladly see your ideas in this post.
Please do not forget the ✅' like '✅ button 🙏😊 & Share it with your friends; thanks, and Trade safe.

BITCOIN Have you forgotten what LOGARITHMIC is all about??In the early days Bitcoin (BTCUSD) charts were very often about its parabolic rallies not just on a large Cycle scale but also shorter term. That's because its been having a Logarithmic Growth since its inception.
Lately though it appears that most have forgotten all about this. Let's refresh our memory on that logarithmic truly means for Bitcoin. On this 1W chart, we display BTC's heavy benchmarks on the logarithmic (log) scale. $1 gave way to $10 (leg a) in 17 weeks (119 days), then it took 96 weeks (679 days) to reach the (psychologically critical for the time) $100 benchmark (leg b). $1000 (leg c) was reached in 34 weeks (238 days), while $10000 (leg d) took 209 weeks (1463 days) after that to get hit.
Pure logarithmic growth, nothing more nothing less. An interesting observation here is that $100-to-$1000 (leg c) took double the time of leg a (c = a*2). In same fashion, leg d ($1000-to-$10000) was also almost twice as leg b (d = b*2). Could it be that the next leg (e), i.e. $10000 to $100000 (which is seen by the market as the new psychological level/ benchmark in Bitcoin's evolution) would be twice as lengthy as leg d, i.e. e d*2? This is translated to a time range of 418 weeks (2926 days), which gives us a rough projection of December 08 2025.
Could that be the correct timing for hitting Bitcoin's Holy Grail target or is it too late? Do you think its always good to keep an eye on the basics of Bitcoin's logarithmic growth? Feel free to let us know in the comments section below!
-------------------------------------------------------------------------------
** Please LIKE 👍, FOLLOW ✅, SHARE 🙌 and COMMENT ✍ if you enjoy this idea! Also share your ideas and charts in the comments section below! This is best way to keep it relevant, support us, keep the content here free and allow the idea to reach as many people as possible. **
-------------------------------------------------------------------------------
💸💸💸💸💸💸
👇 👇 👇 👇 👇 👇

BITCOIN Haven't we seen this before??Bitcoin (BTCUSD) tends to repeat its historic patterns. Not always in the exact same way but some principles remain. Since March 2023 we see a consolidation/ accumulation pattern which in our opinion draws comparisons with April - June 2020.
A Falling Wedge gave way to an aggressive break-out that formed an arc top, which then declined again below the 1D MA50 (blue trend-line). At the moment we are in the phase where the price is again above the 1D MA50. As you can see the 1W MA50 (red trend-line) has been supporting this whole time, since it formed a Bullish Cross with the 1D MA50. The RSI patterns between the two fractals are also similar.
We are well aware that 2020 was a Halving year while 2023 is not, but at least on a micro level, do you think that if the 1D MA50 holds, it will give way to some type of short-term rise? Feel free to let us know in the comments section below!
-------------------------------------------------------------------------------
** Please LIKE 👍, FOLLOW ✅, SHARE 🙌 and COMMENT ✍ if you enjoy this idea! Also share your ideas and charts in the comments section below! This is best way to keep it relevant, support us, keep the content here free and allow the idea to reach as many people as possible. **
-------------------------------------------------------------------------------
💸💸💸💸💸💸
👇 👇 👇 👇 👇 👇

BITCOIN & Chinese stocks. The Divergence that happens mid-Cycle.This is another very informative study that brings together Bitcoin (BTCUSD) and this time, the Chinese stock market (CN50 - blue trend-line). We are looking into the last two Cycles and how in particular the Chinese stocks often lead BTC moves before they happen.
Our focus is in the phase after the Bear Cycle bottom and before the Halvings. As you can see during both of the last market bottoms, the Chinese stocks started to rise first and a few weeks after BTC followed. This led us to the Divergence phases (then 2019 now 2023), which precede the Halving events. During those phases, we see the two assets diverge. In 2019 the Chinese stocks kept rising while BTC fell. In 2023 the Chinese stocks are declining but on a low pace, while BTC mostly rose.
Theoretically, the closer we will get to the Halving, the more the two should converge. But does this mean that a potential rise on Chinese stocks will first make BTC decline more? Or it will resume the norm that China will lead BTC moves again, i.e. BTC will follow with a rise of itself?
What do you think, which scenario will take place first? Feel free to let us know in the comments section below!
-------------------------------------------------------------------------------
** Please LIKE 👍, FOLLOW ✅, SHARE 🙌 and COMMENT ✍ if you enjoy this idea! Also share your ideas and charts in the comments section below! This is best way to keep it relevant, support us, keep the content here free and allow the idea to reach as many people as possible. **
-------------------------------------------------------------------------------
💸💸💸💸💸💸
👇 👇 👇 👇 👇 👇

BITCOIN Yuan & China bonds tell you everything you need to know!This is not the first time we emphasize the strong correlation of Bitcoin (BTCUSD) with Yuan (USDCNY) and the Chinese Bond Yields (CN02Y and CN20Y). We made an analysis right in the aftermath of the FTX crash, indicating why those indicators have all aligned, paving the way for BTC's new Bull Cycle. As you see that happened and this time we incorporate two mixed elements, the USDCNY/CNY20Y (red trend-line) and the CN02Y/CN20Y (blue trend-line).
** The CN02Y/CN20Y ratio **
Every time the CN02Y/CN20Y ratio's Lower Highs broke in the past, Bitcoin started the second phase of the Bull Cycle. Typically this was achieved while BTC was within a Channel Up (green). Right now the CN02Y/CN20Y ratio is testing its Lower Highs trend-line.
** The USDCNY/CN20Y ratio **
The CN02Y/CN20Y break-out has historically taken place a little after the USDCNY/CN20Y ratio peaked and started to decline. Not unexpected based on hard economics as a cheaper currency favors capital flowing to risky assets (such as Bitcoin). Right now the USDCNY/CN20Y ratio has started to decline but not emphatically yet, even though the 2023 rally is very similar to the ratio's peak rallies of January - March 2020 and June - October 2016.
** The harmony of the Sine Waves **
It is very interesting to point out the high degree of symmetry between those CN02Y/CN20Y break-outs and USDCNY/CN20Y rejections. We have applied the Sine Waves tool on them and the trend turns out so harmonic, almost like a Cycle itself. This shows that at the bottom of the Sine Waves, it has never been a bad idea to buy historically.
This mix is incredibly bullish for Bitcoin technically and it prompts to a new parabolic rally as we get closer to the next Halving, the likes of which we may have not seen in the past. But what do you think? Is this pattern good enough for you to buy when the ratio's Lower Highs break-out takes place? Feel free to let us know in the comments section below!
-------------------------------------------------------------------------------
** Please LIKE 👍, FOLLOW ✅, SHARE 🙌 and COMMENT ✍ if you enjoy this idea! Also share your ideas and charts in the comments section below! This is best way to keep it relevant, support us, keep the content here free and allow the idea to reach as many people as possible. **
-------------------------------------------------------------------------------
💸💸💸💸💸💸
👇 👇 👇 👇 👇 👇
