✈️Bitcoin Will Go Up again✈️🔨Bitcoin seems to be breaking the Ascending Channel and 🟢 Support zone($27,580-$27,300) 🟢.
🌊According to Elliott's wave theory , Bitcoin has completed a Zigzag correction(ABC/5-3-5) in the ascending channel, but we have to wait for the next moves to confirm the end of the main wave B .
💡Also, the RSI indicator managed to break the Uptrend line and is currently moving near the 50% line ; I expect the RSI indicator to pull back to the Uptrend line .👇
🔔I expect Bitcoin to at least decline to the next 🟢 Support zone($26,880-$26,500) 🟢 and then rise again and touch the minimum Resistance line again.
Bitcoin Analyze ( BTCUSDT ), Daily time frame ⏰.
Do not forget to put Stop loss for your positions (For every position you want to open).
Please follow your strategy; this is my Idea, and I will gladly see your ideas in this post.
Please do not forget the ✅' like '✅ button 🙏😊 & Share it with your friends; thanks, and Trade safe.
Bitcoinsignals

BITCOIN Just accept that we are NOT going any LOWER than this!Kind of catchy title but 100% true nonetheless, at least according to this chart. On today's analysis we see Bitcoin (BTCUSD) on the 1W time-frame, supported by the 1W MA50 (blue trend-line).
Every time on these Cycles you see it broke above the previous Resistance (dashed line) and turned it into Support without breaking it, while the 1W MA50 was supported and a 1W MACD Bullish Cross took place above the 0.0 neutral mark, BTC never reached any prices lower than that and instead initiated a parabolic rally. We can see that when the Resistance-turned-Support broke due to the COVID crash, the 1W MA50 had also broken already (November 2019), while the 1W MACD Bullish Cross took place below 0.0. Thus not a sign of a parabolic rally.
These set of parameters show that indeed BTC won't be going lower than last months bottom any more. Do you think that will be the case and we can call September's low a bottom? Feel free to let us know in the comments section below!
-------------------------------------------------------------------------------
** Please LIKE 👍, FOLLOW ✅, SHARE 🙌 and COMMENT ✍ if you enjoy this idea! Also share your ideas and charts in the comments section below! This is best way to keep it relevant, support us, keep the content here free and allow the idea to reach as many people as possible. **
-------------------------------------------------------------------------------
💸💸💸💸💸💸
👇 👇 👇 👇 👇 👇

Bitcoin Analyze(Road map)🗺️⏰(1-Hour)⏰👋 Hi everyone.
🙏 First, I have to apologize for the busy chart, but I will try to draw all the important zones and lines for you so that the posts have an 📚 Educational aspect 📚.
🏃♂️Bitcoin is moving in the 🟢Support zone($26,880-$26,500)🟢 near the 🟣 Yearly Pivot Point($26,737) 🟣, Support lines and 🔵 50_SMA(Daily) 🔵.
🌊According to the theory of Elliott waves , Bitcoin seems to be completing its 5th wave with the help of the Expanding Ending Diagonal .
💡Also, we can see Regular Divergence(RD+) between two Consecutive valleys .
🔔I expect Bitcoin to move towards the Resistance line and 🔴 Resistance zone($27,600-$27,300) 🔴 after breaking the upper line of the Expanding Ending Diagonal .
❗️ Note ❗️: Below the 🟢Support zone($26,880-$26,500)🟢 , Bitcoin has a 🔵 CME Gap($26,400-$26,290) 🔵, which I don't think Bitcoin will fill this gap in this attack, but if this zone is filled, the scenario will change .
--------------------------------------------------------------------------------
🌐➕ Positive News ➕🌐:
First Abu Dhabi Bank completes cross-border payments testing on JPMorgan Onyx.
Telegram And TON Foundation Collaborate With Alibaba Cloud In Quest For Fastest Blockchain.
Bitcoin Lightning Network growth jumps 1,200% in 2 years.
Billionaire Paul Tudor Jones Still Likes Bitcoin Despite Price Drop.
Tether Continues To Flow Into Exchanges.
JPMorgan debuts tokenization platform, BlackRock among key clients: Report.
Crypto HODLers Stash Bitcoin Worth $1.35B Each Month, Onchain Data Show.
ARK Invest updates spot Bitcoin ETF proposal in response to SEC criticisms.
🌐➖ Negative News ➖🌐:
Crypto exchange Bitstamp to end Canadian services in January
Jim Cramer thinks 'Mr. Bitcoin is about to go down big'
--------------------------------------------------------------------------------
Bitcoin Analyze ( BTCUSDT ), 1-hour time frame ⏰.
Do not forget to put Stop loss for your positions (For every position you want to open).
Please follow your strategy; this is just my Idea, and I will gladly see your ideas in this post.
Please do not forget the ✅' like '✅ button 🙏😊 & Share it with your friends; thanks, and Trade safe.

BITCOIN Have you forgotten what LOGARITHMIC is all about??In the early days Bitcoin (BTCUSD) charts were very often about its parabolic rallies not just on a large Cycle scale but also shorter term. That's because its been having a Logarithmic Growth since its inception.
Lately though it appears that most have forgotten all about this. Let's refresh our memory on that logarithmic truly means for Bitcoin. On this 1W chart, we display BTC's heavy benchmarks on the logarithmic (log) scale. $1 gave way to $10 (leg a) in 17 weeks (119 days), then it took 96 weeks (679 days) to reach the (psychologically critical for the time) $100 benchmark (leg b). $1000 (leg c) was reached in 34 weeks (238 days), while $10000 (leg d) took 209 weeks (1463 days) after that to get hit.
Pure logarithmic growth, nothing more nothing less. An interesting observation here is that $100-to-$1000 (leg c) took double the time of leg a (c = a*2). In same fashion, leg d ($1000-to-$10000) was also almost twice as leg b (d = b*2). Could it be that the next leg (e), i.e. $10000 to $100000 (which is seen by the market as the new psychological level/ benchmark in Bitcoin's evolution) would be twice as lengthy as leg d, i.e. e d*2? This is translated to a time range of 418 weeks (2926 days), which gives us a rough projection of December 08 2025.
Could that be the correct timing for hitting Bitcoin's Holy Grail target or is it too late? Do you think its always good to keep an eye on the basics of Bitcoin's logarithmic growth? Feel free to let us know in the comments section below!
-------------------------------------------------------------------------------
** Please LIKE 👍, FOLLOW ✅, SHARE 🙌 and COMMENT ✍ if you enjoy this idea! Also share your ideas and charts in the comments section below! This is best way to keep it relevant, support us, keep the content here free and allow the idea to reach as many people as possible. **
-------------------------------------------------------------------------------
💸💸💸💸💸💸
👇 👇 👇 👇 👇 👇

BITCOIN Haven't we seen this before??Bitcoin (BTCUSD) tends to repeat its historic patterns. Not always in the exact same way but some principles remain. Since March 2023 we see a consolidation/ accumulation pattern which in our opinion draws comparisons with April - June 2020.
A Falling Wedge gave way to an aggressive break-out that formed an arc top, which then declined again below the 1D MA50 (blue trend-line). At the moment we are in the phase where the price is again above the 1D MA50. As you can see the 1W MA50 (red trend-line) has been supporting this whole time, since it formed a Bullish Cross with the 1D MA50. The RSI patterns between the two fractals are also similar.
We are well aware that 2020 was a Halving year while 2023 is not, but at least on a micro level, do you think that if the 1D MA50 holds, it will give way to some type of short-term rise? Feel free to let us know in the comments section below!
-------------------------------------------------------------------------------
** Please LIKE 👍, FOLLOW ✅, SHARE 🙌 and COMMENT ✍ if you enjoy this idea! Also share your ideas and charts in the comments section below! This is best way to keep it relevant, support us, keep the content here free and allow the idea to reach as many people as possible. **
-------------------------------------------------------------------------------
💸💸💸💸💸💸
👇 👇 👇 👇 👇 👇

Bitcoin is Ready to ⚔️Attack⚔️ the Support line⏰(15_Min)⏰✅As I expected, Bitcoin is completing the waves that I shared with you in the last few days. (I suggest you follow the previous posts to get a better understanding of the Bitcoin roadmap .).
↘️Bitcoin came back below the Resistance line and attacked the 🟢 Support zone($25,840_$25,600) 🟢.
🌊In terms of Elliott wave theory , Bitcoin is completing its 5-wave downtrend;it seems to be completing wave 4 in 🟡 Price Reversal Zone(PRZ) 🟡.
🔔I expect Bitcoin will attack the Support line .
📚Of course, it should be noted that wave 4 may continue on Saturdays and Sundays , the reason being that the Volume Trading is generally low on these days.
--------------------------------------------------------------------------------
🌐➕ Positive News ➕🌐:
Nearly Half Of Institutions Are Holding Digital Assets For Clients: Report.
JPMorgan moves into deposit tokens for settlements: Report.
🌐➖ Negative News ➖🌐:
Bitcoin liquidates $23M in shorts as BTC price tags new September high.
CFTC Goes After Opyn, Other DeFi Operations in Enforcement Sweep.
IMF Releases New Paper to Address Crypto’s Risks to Financial Stability.
11,196 Years Jail Sentence for Faruk Özer, CEO of Collapsed Turkish Crypto Exchange Thodex.
Bitcoin worth $128 million sent to exchanges.
FED Statement on Stablecoins!
--------------------------------------------------------------------------------
Bitcoin Analyze ( BTCUSDT ), 15-minute time frame ⏰.
Do not forget to put Stop loss for your positions (For every position you want to open).
Please follow your strategy; this is just my Idea, and I will be glad to see your ideas in this post.
Please do not forget the ✅' like '✅ button 🙏😊 & Share it with your friends; thanks, and Trade safe.

BITCOIN & Chinese stocks. The Divergence that happens mid-Cycle.This is another very informative study that brings together Bitcoin (BTCUSD) and this time, the Chinese stock market (CN50 - blue trend-line). We are looking into the last two Cycles and how in particular the Chinese stocks often lead BTC moves before they happen.
Our focus is in the phase after the Bear Cycle bottom and before the Halvings. As you can see during both of the last market bottoms, the Chinese stocks started to rise first and a few weeks after BTC followed. This led us to the Divergence phases (then 2019 now 2023), which precede the Halving events. During those phases, we see the two assets diverge. In 2019 the Chinese stocks kept rising while BTC fell. In 2023 the Chinese stocks are declining but on a low pace, while BTC mostly rose.
Theoretically, the closer we will get to the Halving, the more the two should converge. But does this mean that a potential rise on Chinese stocks will first make BTC decline more? Or it will resume the norm that China will lead BTC moves again, i.e. BTC will follow with a rise of itself?
What do you think, which scenario will take place first? Feel free to let us know in the comments section below!
-------------------------------------------------------------------------------
** Please LIKE 👍, FOLLOW ✅, SHARE 🙌 and COMMENT ✍ if you enjoy this idea! Also share your ideas and charts in the comments section below! This is best way to keep it relevant, support us, keep the content here free and allow the idea to reach as many people as possible. **
-------------------------------------------------------------------------------
💸💸💸💸💸💸
👇 👇 👇 👇 👇 👇

BITCOIN Yuan & China bonds tell you everything you need to know!This is not the first time we emphasize the strong correlation of Bitcoin (BTCUSD) with Yuan (USDCNY) and the Chinese Bond Yields (CN02Y and CN20Y). We made an analysis right in the aftermath of the FTX crash, indicating why those indicators have all aligned, paving the way for BTC's new Bull Cycle. As you see that happened and this time we incorporate two mixed elements, the USDCNY/CNY20Y (red trend-line) and the CN02Y/CN20Y (blue trend-line).
** The CN02Y/CN20Y ratio **
Every time the CN02Y/CN20Y ratio's Lower Highs broke in the past, Bitcoin started the second phase of the Bull Cycle. Typically this was achieved while BTC was within a Channel Up (green). Right now the CN02Y/CN20Y ratio is testing its Lower Highs trend-line.
** The USDCNY/CN20Y ratio **
The CN02Y/CN20Y break-out has historically taken place a little after the USDCNY/CN20Y ratio peaked and started to decline. Not unexpected based on hard economics as a cheaper currency favors capital flowing to risky assets (such as Bitcoin). Right now the USDCNY/CN20Y ratio has started to decline but not emphatically yet, even though the 2023 rally is very similar to the ratio's peak rallies of January - March 2020 and June - October 2016.
** The harmony of the Sine Waves **
It is very interesting to point out the high degree of symmetry between those CN02Y/CN20Y break-outs and USDCNY/CN20Y rejections. We have applied the Sine Waves tool on them and the trend turns out so harmonic, almost like a Cycle itself. This shows that at the bottom of the Sine Waves, it has never been a bad idea to buy historically.
This mix is incredibly bullish for Bitcoin technically and it prompts to a new parabolic rally as we get closer to the next Halving, the likes of which we may have not seen in the past. But what do you think? Is this pattern good enough for you to buy when the ratio's Lower Highs break-out takes place? Feel free to let us know in the comments section below!
-------------------------------------------------------------------------------
** Please LIKE 👍, FOLLOW ✅, SHARE 🙌 and COMMENT ✍ if you enjoy this idea! Also share your ideas and charts in the comments section below! This is best way to keep it relevant, support us, keep the content here free and allow the idea to reach as many people as possible. **
-------------------------------------------------------------------------------
💸💸💸💸💸💸
👇 👇 👇 👇 👇 👇

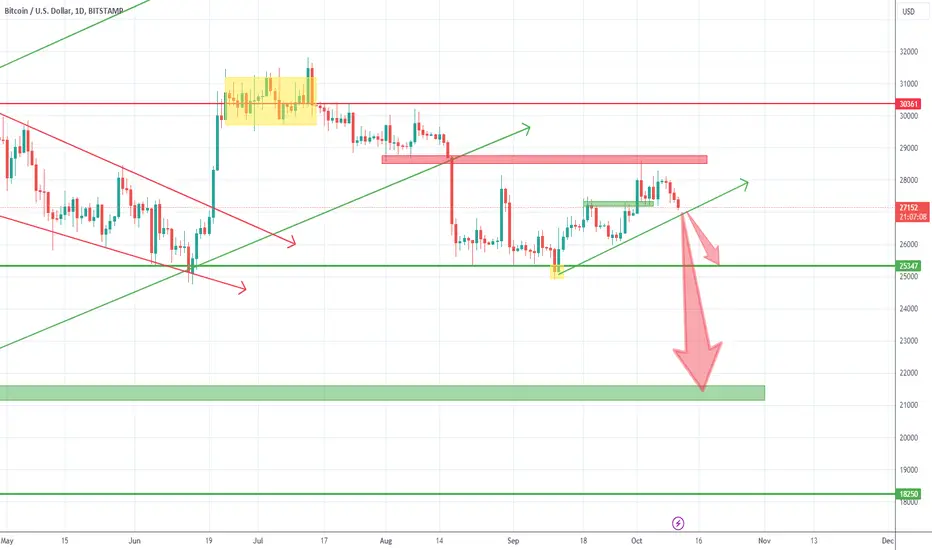
Bitcoin could dive soonAfter the reversal from 25k and the reach of my target at 28.500, Bitcoin started to consolidate.
Friday we had a new attempt to reconquer resistance and bulls failed again and BtcUsd started to fall again.
At the time of writing the price sits on confluence support, but the structure is not bullish at all and we could witness a break down
In such an instance, the first target for bears is 25k horizontal support, but, in the longer-term 21k is not out of the question.
I'm bearish on BTC as long as the price is under 28.500
BITCOIN The Gaussian giving one of the rarest buys you can get.Bitcoin (BTCUSD) has been trading within the (now green) Gaussian Channel since the mid-August decline. It is no surprise that it held that low and trade basically sideways as once the Gaussian turns green historically, it has signaled the phase of the bull market before the Halving. It shouldn't turn red again before the new Bear Cycle.
Last time BTC dipped inside a green Gaussian Channel after breaking into while red, was in October 2019. December - January 2020 followed with a strong rise before the non-technical and outside of any model's reach Black Swan event of COVID (which is an irregularity and doesn't count on our models).
As a result, such Gaussian green dip and trade is a rare buy opportunity during a Bull Cycle while prices are still relatively low. For reference, such an opportunity didn't emerge in the 2016 - 2017 Bull Cycle. Perhaps a 1W RSI at 40.00 would be the most ideal buy entry (lowest risk/ highest return).
But what do you think? Is this Gaussian pattern good enough for you to buy? Feel free to let us know in the comments section below!
-------------------------------------------------------------------------------
** Please LIKE 👍, FOLLOW ✅, SHARE 🙌 and COMMENT ✍ if you enjoy this idea! Also share your ideas and charts in the comments section below! This is best way to keep it relevant, support us, keep the content here free and allow the idea to reach as many people as possible. **
-------------------------------------------------------------------------------
💸💸💸💸💸💸
👇 👇 👇 👇 👇 👇

BITCOIN May not face again a Resistance Zone as strong as this!!Bitcoin (BTCUSD) is consolidating within the 1D MA50 (blue trend-line) and 1D MA200 (orange trend-line) for the last 10 days. This neutrality, this sideways price action may be directly attributed to the presence of the Lower Highs trend-line since the top of the previous Bull Cycle.
But it's not only that double hurdle level that BTC needs to overcome. Directly above it, we have the 31800 Resistance (July 13 2023 High), which is also the Mega Pivot Zone between the two Cycles, as it started as a Support Zone (closing all 1W candles from May - July 2021 above it with emphasis) and since May 2022 has been the Resistance to beat.
It becomes obvious that this is a quadruple Resistance level and quite frankly the strongest obstacle BTC has faced thus far during the 2023 recovery phase and quite possibly a Resistance Cluster the likes of which may not face again during this new Bull Cycle.
But what do you think? Is this the most critical Resistance Zone for Bitcoin and if so, will it break now? Feel free to let us know in the comments section below!
-------------------------------------------------------------------------------
** Please LIKE 👍, FOLLOW ✅, SHARE 🙌 and COMMENT ✍ if you enjoy this idea! Also share your ideas and charts in the comments section below! This is best way to keep it relevant, support us, keep the content here free and allow the idea to reach as many people as possible. **
-------------------------------------------------------------------------------
💸💸💸💸💸💸
👇 👇 👇 👇 👇 👇

🚧Bitcoin will Go Down Again🚧🔨Bitcoin started to rise from the 🟢 Heavy Support zone($25,280-$23,900) 🟢 and was able to break the Downtrend line yesterday.
✅Also, Bitcoin has managed to form an Ascending channel .
🏃♂️Bitcoin is currently moving in the 🔴 Resistance zone($28,460-$28,000) 🔴 near the SMA(100) and near the upper line of the ascending channel .
💡Also, we can see the Regular Divergence(RD-) between Price and Volume.
🌊In terms of Elliott Waves , Bitcoin managed to complete the main corrective wave A at the 🟢Heavy Support zone($25,280-$23,900)🟢 and is currently completing the main wave B.
📚Since the main wave A is five microwaves, we have to wait for the Zigzag correction(ABC/5-3-5) , and the higher the end of the main wave B is at higher prices, we expect the main wave C to be weaker.
📚☠️ Death Cross Signal ☠️: The death cross appears on a chart when an asset's short-term Moving Average(MA) , usually the 50-day, crosses below its long-term moving average, usually the 200-day.
🔔I expect the microwave C of the main wave B to finish at the 🔴 Resistance zone 🔴 or at the 🟡 Price Reversal Zone(PRZ) 🟡, and then Bitcoin will ⚔️ Attack ⚔️ the lower line of the ascending channel.
Bitcoin Analyze ( BTCUSDT ), Daily time frame ⏰.
Do not forget to put Stop loss for your positions (For every position you want to open).
Please follow your strategy; this is my Idea, and I will gladly see your ideas in this post.
Please do not forget the ✅' like '✅ button 🙏😊 & Share it with your friends; thanks, and Trade safe.

BITCOIN Cycle mapping like you've never seen it before!On today's Bitcoin (BTCUSD) study, we plot the historic Cycles on top one another, classifying them into different phases. This is an alternative but very useful way at looking in BTC's historic cyclical action as it offers a sound perspective regarding our current place on the Cyclical Scale.
As you can see, the 2011 - 2013 Cycle is displayed in blue, the 2014 - 2017 Cycle in orange, the 2018 - 2021 Cycle in black and the current one 2022 onwards in red. The phases are: Bear (red), Accumulation (orange), 1st Rally (blue) and 2nd Rally (green). The three most recent Cycles are plotted as they are in terms of duration but the 2011 - 2013 one is stretched in order to fit the phase classifications and relate to the more recent Cycles.
As a result, its Halving (1) is also moved to its respective spot. It is no coincidence then that all Halvings (1 through 4) fall close to each other on what we call "the Halving Belt". Now this Cycle display gives a sound sense of Bitcoin's Cyclical perspective in relative terms (for Cycle 1). The "we are here" vertical line reveals the respective place relative to the past Cycles. As you see, it is about to end the Accumulation Phase and as it approaches Halving 4, start the 1st Rally Phase of the Bull Cycle.
So what do you think? Does this chart give a fair sense of where we are now? Feel free to let us know in the comments section below!
-------------------------------------------------------------------------------
** Please LIKE 👍, FOLLOW ✅, SHARE 🙌 and COMMENT ✍ if you enjoy this idea! Also share your ideas and charts in the comments section below! This is best way to keep it relevant, support us, keep the content here free and allow the idea to reach as many people as possible. **
-------------------------------------------------------------------------------
💸💸💸💸💸💸
👇 👇 👇 👇 👇 👇

Bitcoin will go UP to my 🎯Target🎯⏰(15Min)⏰🏃Bitcoin is running on 🟢 Heavy Support zone($27,600-$27,300) 🟢 and 🟡 Price Reversal Zone(PRZ) 🟡.
🔔I expect Bitcoin to rise toward the 🎯 Target 🎯 that I specified in my chart after breaking the 🔴 Resistance zone 🔴.
❗️ Note ❗️: if Bitcoin goes below the 🟢 Heavy Support zone($27,600-$27,300) 🟢 we have to expect that Bitcoin will go down more.
--------------------------------------------------------------------------------
🌐➕ Positive News ➕🌐:
In general, October has been a good month for cryptocurrencies.
Ethereum Futures ETFs Debut on Low Volumes.
Grayscale Moves to Convert Its Ethereum Trust to a Spot ETH ETF
🌐➖ Negative News ➖🌐:
Peter Schiff: ‘We Are Still Early in the Biggest Bond Market Crash in U.S. History’.
Stablecoin Economy Sheds $1.52 Billion in September, Revisiting a 2-Year Low.
This Crypto Exchange Reportedly Suffered a $13 Million Hack
--------------------------------------------------------------------------------
Bitcoin Analyze ( BTCUSDT ), 15-minute time frame ⏰.
Do not forget to put Stop loss for your positions (For every position you want to open).
Please follow your strategy; this is just my Idea, and I will be glad to see your ideas in this post.
Please do not forget the ✅' like '✅ button 🙏😊 & Share it with your friends; thanks, and Trade safe.

BITCOIN Made a MACD Bullish Cross that opens the road to $40k!Bitcoin (BTCUSD) has completed a Bullish Cross on the 3D time-frame and that helped the price last week to start the short term rise that broke above the 3D MA50 (blue trend-line) for the first time since mid August. The previous 3 MACD Bullish Crosses have all delivered a Higher High within the 11 month Channel Up.
What's also interesting is how firmly the MA100 (green trend-line) held on the September 10 Low. Technically once BTC reclaims the MA50 (i.e. closes a full candle above it), the new bullish wave of the Channel Up will be confirmed. We expect it to test Resistance 2 at 40000, a critical psychological level.
Do you think this MACD Bullish Cross was what BTC needed to kickstart the new rally? Feel free to let us know in the comments section below!
-------------------------------------------------------------------------------
** Please LIKE 👍, FOLLOW ✅, SHARE 🙌 and COMMENT ✍ if you enjoy this idea! Also share your ideas and charts in the comments section below! This is best way to keep it relevant, support us, keep the content here free and allow the idea to reach as many people as possible. **
-------------------------------------------------------------------------------
💸💸💸💸💸💸
👇 👇 👇 👇 👇 👇

Bitcoin- Back to support?On 27 September I recommended a buy trade for Bitcoin saying that the cryptocurrency could rise and test 28500 resistance.
This target was reached on Monday and BtcUsd started to drop again.
Although I had a short-term buy trade, my bearish medium-term outlook has not altered and after this new test of resistance I think Btc will roll back down to support
At this moment we have Bitcoin just above confluence support and a rebound could follow.
However, I will use this rebound for a short trade against the recent high.
My target is 25k support

BITCOIN Alt season started and going all the way to the Halving!Bitcoin (BTCUSD) may have found Support on the 1W MA50 (blue trend-line) and rebounded but for basically the last 6 months it has been trading sideways/ consolidating. On the other hand, this hasn't stopped the altcoin market (orange trend-line depicting dominance) from breaking above its Bear Cycle's Lower Highs trend-line 6 weeks ago. Historically, when alts broke above that distinct Lower Highs trend-line in previous Cycles, BTC has always been above the 1W MA50 and (with the exception of the COVID crash) never lost it.
We have approximately 154 days/ 22 weeks until the next Halving (no 4) and on the same time range in the past 2 Cycles, the alt season had alreay started. Typically this extends to at least the Halving event. On Halving 2 it saw a huge price spike while during Halving 3 it had a steady rise that continued even after the event. We can therefore draw the conclusion that the alt season has just started and has at least another 5 months of growth ahead of it (until Halving 4). At the same time, BTC should stay supported by the 1W MA50.
So what do you think? Have we broken aggressively into a long alt season? If so, are you going light on Bitcoin and heavy on alts? Feel free to let us know in the comments section below!
-------------------------------------------------------------------------------
** Please LIKE 👍, FOLLOW ✅, SHARE 🙌 and COMMENT ✍ if you enjoy this idea! Also share your ideas and charts in the comments section below! This is best way to keep it relevant, support us, keep the content here free and allow the idea to reach as many people as possible. **
-------------------------------------------------------------------------------
💸💸💸💸💸💸
👇 👇 👇 👇 👇 👇

BITCOIN Cycle unlocked with Angle Theory! Can we reach 140-150k?Bitcoin (BTCUSD) is having a strong break-out day on the 1D time-frames and below but this is only on the short-term. Still it is a step in the right direction on the long-term after trading sideways in the last 6 months within the 1W MA50 (Support) and 1W MA100 (Resistance).
** Cycle Peaks and angles **
Today's study brings you the a multi-cycle depiction on the 1W time-frame of BTC since the peak of its very first Cycle at $32. Those that followed ($1250, $19800, $69800) all made contact with the Logarithmic top Growth Curve, a historic pattern that is holding since BTC's inception.
It appears that every peak-to-peak measurement is roughly half of the previous peak. The automatic angle measurements on the (red) dotted lines may differ based on the screen's display and how the horizontal/ vertical axis move but on ours (and the screenshot of the idea) goes like this: 38°, 19°, 10°. We estimate a 6° angle for the new Cycle peak on the log Growth Curve.
** Next Cycle peak? **
If we take all previous Cycles and apply them to fit the new price action towards the top of the Log Growth Curve, that 6° line gives a projected Cycle peak within $140000 - 150000. It is also interesting to apply the same angle principle to the Cycle bottoms. We can see that those (green dotted lines) can also roughly be half of what the previous bottom was (though the variations are higher). The new bottom is estimated to be on a 7° angle.
Remarkably the angles of the tops and bottoms of each Cycle have approximately the same measurements, indicating that despite being logarithmic within a curve, they can be viewed separately in Channels.
So what do you think? Can Bitcoin reach $140-150k during this Cycle? Feel free to let us know in the comments section below!
-------------------------------------------------------------------------------
** Please LIKE 👍, FOLLOW ✅, SHARE 🙌 and COMMENT ✍ if you enjoy this idea! Also share your ideas and charts in the comments section below! This is best way to keep it relevant, support us, keep the content here free and allow the idea to reach as many people as possible. **
-------------------------------------------------------------------------------
💸💸💸💸💸💸
👇 👇 👇 👇 👇 👇

BITCOIN First close above the 1D MA50 in 2 months?Bitcoin (BTCUSD) broke above the 1D MA50 (blue trend-line) again today and is very close to registering the first 1D candle closing above it since August 01. At the same time it broke above the Lower Highs of the Falling Wedge pattern that started on the July 13 High.
If it succeeds today in closing above it, we hav e high probabilities of seeing the bullish extension of the Inverse Head and Shoulders pattern (IH&S) we discussed last week materializing. The target extends as high as the 2.0 Fibonacci at 30000. The short-term target is the 1D MA200 (orange trend-line) at 28000. Interestingly enough Resistance 1 (28150) and Resistance 2 (30220) are near those two respective targets adding to their importance as supply levels.
Note that the 1D RSI has been on a strong Bullish Divergence since August 18 (candles on Lower Lows). That is why the IH&S has increased probabilities of breaking above the 2-month Falling Wedge pattern.
So what do you think? Is it time to break to the upside for good? Feel free to let us know in the comments section below!
-------------------------------------------------------------------------------
** Please LIKE 👍, FOLLOW ✅, SHARE 🙌 and COMMENT ✍ if you enjoy this idea! Also share your ideas and charts in the comments section below! This is best way to keep it relevant, support us, keep the content here free and allow the idea to reach as many people as possible. **
-------------------------------------------------------------------------------
💸💸💸💸💸💸
👇 👇 👇 👇 👇 👇

BITCOIN Don't expect any rebound as long as the USD is rising!Bitcoin (BTCUSD) failed again to break above the 1W MA200 (orange trend-line), closing instead the 1W candle in red and is pulling back. Today's study is on the 1W time-frame and compares BTC's price action through the whole year to the U.S. Dollar's (DXY).
You would expect a correlation between the two but as you can see on these charts, it has gotten increasingly tighter lately. BTC's last two medium-term declines are the direct consequence of DXY's price increases. When DXY bottomed and started to rise, BTC topped and started to decline (vice verse DXY topping, BTC bottoming). Obviously a far riskier asset like Bitcoin is trading in a more aggressive pattern like a Channel Up while the more stable by nature currency is trading/ consolidating within a Megaphone.
DXY the approaching the top of that Megaphone pattern, in fact it is very close to the 105.900 High of March. Having broken above its 1W MA50 (blue trend-line) this month, while BTC is still supported on its own, we can't be realistically expecting Bitcoin to rebound as long as the DXY continues to rise, unless an outside catalyst such as very favorable (adoption) news hit the market. Until then Bitcoin should seek a Support confirmation on its 1W MA50, while DXY should start forming a top in October.
But what do you think? Will Bitcoin rise irrelevant of what DXY will do, or we need to see a top on the latter first? Feel free to let us know in the comments section below!
-------------------------------------------------------------------------------
** Please LIKE 👍, FOLLOW ✅, SHARE 🙌 and COMMENT ✍ if you enjoy this idea! Also share your ideas and charts in the comments section below! This is best way to keep it relevant, support us, keep the content here free and allow the idea to reach as many people as possible. **
-------------------------------------------------------------------------------
💸💸💸💸💸💸
👇 👇 👇 👇 👇 👇

BITCOIN Rejected on July's Resistance buy can this save the day?Last week we covered the Lower Highs trend-lines involved on Bitcoin's (BTCUSD) medium-term price action (see chart below) and how each break-out would be a Resistance break targeting the next in line:
The Lower Highs 1 trend-line broke and almost hit our 27550 Target but the rejection on Lower Highs 2 (started on the July 13 High) has been so far rather emphatic. This was also a near 1D MA200 (orange trend-line) rejection that pulled the price back below the 1D MA50 (blue trend-line).
As discussed previously, the Fibonacci retracement levels play an important role on this price action. It should be no surprise that the 0.236 Fibonacci is holding so far this pull-back, while the rejection took place on the 0.382 Fib.
On the bright side, the 1W MA50 (red trend-line) remains the long-term Support, while the 1D RSI is on a Bullish Divergence (Higher Lows as opposed to Lower Lows of the price). As a result, we may see Lower Highs 2 break especially if the pattern transitions into an Inverse Head and Shoulders (IH&S). Technically such patterns target the 2.0 Fibonacci extension from their neckline. Surprisingly that is marginally below Resistance 2 (30220) and the 0.786 Fibonacci (30350). A straight 30000 target would be best for the medium-term.
We don't consider buying below Lower Highs 2 optimal, unless a new (last) pull-back towards the 1W MA50 occurs (excellent value entry). It would be more optimal to enter after a 1D candle closes above Lower Highs 2 or better yet a confirmed break of Resistance 1 (28150), which would be also a break above the 1D MA200.
So what do you think? Can this Inverse Head and Shoulders finally break above the Lower Highs and save the day for BTC? Feel free to let us know in the comments section below!
-------------------------------------------------------------------------------
** Please LIKE 👍, FOLLOW ✅, SHARE 🙌 and COMMENT ✍ if you enjoy this idea! Also share your ideas and charts in the comments section below! This is best way to keep it relevant, support us, keep the content here free and allow the idea to reach as many people as possible. **
-------------------------------------------------------------------------------
💸💸💸💸💸💸
👇 👇 👇 👇 👇 👇

BITCOIN Going for the Cycle's Lower Highs trendline and 1W MA100Bitcoin (BTCUSD) is about to test a major Resistance cluster, the Lower Highs trend-line from the Cycle's 2nd High and the 1W MA100 (green trend-line). The latter was the Resistance level that stopped the rally in July. The price has been essentially consolidating sideways within the 1W MA100 and 1W MA50 (blue trend-line) since. The former (Lower Highs) is the trend-line that was a key Resistance in the past two Cycles and its break-out coincided with the break above the 1W MA100 as well.
Today BTC is only 30 weeks (210 days) before Halving 4 (April 2024). Going back to the past two Cycles, we can see that in both cases the price was exactly on the 0.5 Fibonacci retracement level on that respective date/time range and at the same time above the 1W MA100 (though only marginally). Today the price is roughly $5000 below the 0.5 Fib and below the 1W MA100. Can this be an indication that this Cycle may not be as aggressive? We can't be sure but what we do know is that a break above the Lower Highs and 1W MA100 trend-lines would be a strong medium-term bullish signal, at least until next year's Halving.
But what do you think? Are you expecting Bitcoin to finally break above the Lower Highs trend-line and the 1W MA100 on the current rebound? Feel free to let us know in the comments section below!
-------------------------------------------------------------------------------
** Please LIKE 👍, FOLLOW ✅, SHARE 🙌 and COMMENT ✍ if you enjoy this idea! Also share your ideas and charts in the comments section below! This is best way to keep it relevant, support us, keep the content here free and allow the idea to reach as many people as possible. **
-------------------------------------------------------------------------------
💸💸💸💸💸💸
👇 👇 👇 👇 👇 👇

BITCOIN Above the 4H MA200 starting to test the Resistances.Bitcoin (BTCUSD) broke yesterday above the 4H MA200 (orange trend-line) for the first time since August 09. This was a critical Resistance as it made the emphatic August 29 rejection in the Greyscale aftermath.
With the 4H MA50's (blue trend-line) support, the price has now started to test the Resistance levels one by one with the first being the Lower Highs 1 trend-line that has been in effect since the August 08 High. If BTC closes a 1D candle above it, we will have the first bullish break-out signal and we will buy targeting the 0.382 Fibonacci level and Lower Highs 2 trend-line at 27550. This trend-line has been in effect since the annual High of July 13. Note that if this target is achieved, BTC will most likely form a Golden Cross on the 4H time-frame (would be the first since June 22).
Beyond that, we will only engage in buying if a 1D candle is closed above the 1D MA100 (red trend-line), a key level which is located slightly above Resistance 1 (28150) and slightly below the 0.5 Fibonacci. In that case our target will be 30220 (Resistance 2), marginally below Fibonacci 0.786.
Among all this, notice the significant Bullish Divergence that has been unfolding on the RSI, which has been on Higher Lows while Bitcoin traded on Lower Lows.
So what do you think about this critical test of the 4H MA200? Is it the first Resistance to break and many more will follow? Feel free to let us know in the comments section below!
-------------------------------------------------------------------------------
** Please LIKE 👍, FOLLOW ✅, SHARE 🙌 and COMMENT ✍ if you enjoy this idea! Also share your ideas and charts in the comments section below! This is best way to keep it relevant, support us, keep the content here free and allow the idea to reach as many people as possible. **
-------------------------------------------------------------------------------
💸💸💸💸💸💸
👇 👇 👇 👇 👇 👇

BITCOIN 1D Death Cross formed and its ugly! How bad can it be?Bitcoin (BTCUSD) couldn't avoid the Death Cross formation on the 1D time-frame as a result of August's decline. This is technically a bearish pattern, where the 1D MA50 (blue trend-line) crosses below the 1D MA200 (orange trend-line). So how bad can it be?
To answer that, we can look into the historic price action of course through past occurrences of the Death Cross pattern. On this analysis you see the last five (5) crosses (included the current one). Let's look into them with more detail one by one:
a) September 2023 (current)
The Death Cross was formed while the price is still above the 1W MA50 (red trend-line), which is supporting since March 13 2023 (6 months).
At the same time, the 1D LMACD hit -0.03 and is rebounding following a Bullish Cross.
b) January 2022 (Bear Cycle)
The Death Cross was formed while the price had already dipped below the 1W MA50, indicating the confirmed transition to the Bear Cycle.
The 1D LMACD was already declining after a pre Death Cross hit at -0.06.
c) October 2019 & March 2020 (Bull Cycle)
The 2019 Death Cross was formed while the price was above the 1W MA50, but eventually hit it. The 1D LMACD was rising on a Bullish Cross after a pre Death Cross hit at -0.06.
The 2020 Death Cross was formed while the price was below the 1W MA50 and after the actual bottom. This was due to the COVID global asset wide market flash crash, which of course was an irregularity, a Black Swan event that can't offer any meaningful conclusions to our current analysis.
d) September 2015 (start of Bull Cycle)
The Death Cross was formed while the price was below the 1W MA50 (which was still unbroken throughout the Bear Cycle) and after the actual bottom. This was due to the Bitfinex flash crash. That was the actual bottom of the Bear Cycle and the start of the new Bull Cycle, which was confirmed by the breaking of the 1W MA50. The 1D LMACD was rising on a Bullish Cross after a pre Death Cross hit at -0.06.
** Conclusion **
This is a mix of results but we can agree that the key here will be the 1W MA50. As long as the price holds it or even at the event of a marginal break, rebounds immediately, BTC most likely avoids a new Bear Cycle. If not, then the price action in the following weeks/ months will most likely draw more comparisons with the January 2022 Death Cross.
So what do you think? How bad do you feel this Death Cross pattern is? Feel free to let us know in the comments section below!
-------------------------------------------------------------------------------
** Please LIKE 👍, FOLLOW ✅, SHARE 🙌 and COMMENT ✍ if you enjoy this idea! Also share your ideas and charts in the comments section below! This is best way to keep it relevant, support us, keep the content here free and allow the idea to reach as many people as possible. **
-------------------------------------------------------------------------------
💸💸💸💸💸💸
👇 👇 👇 👇 👇 👇
