BITCOIN Consolidation above the Gaussian starts parabolic rally.Bitcoin (BTCUSD) is establishing a consolidating position above the Gaussian Channel on the 1W time-frame for the 4th straight week. On all of previous Cycles, such break and consolidation above the Gaussian was the start of a parabolic rally.
As far as targets are concerned, on the first 2 Cycles, the rally reached at least the 3.0 Fibonacci extension level measuring from the previous Cycle High and the Gaussian break-out level. The last Cycle (no3) reached (and exceeded) the 2.0 Fibonacci extension. Taking this 2.0 Fib 'worst' case scenario, we should be expecting this new rally to reach at least the $160000 mark.
Would you agree? Is your expected top higher or lower than 160k? Feel free to let us know in the comments section below!
-------------------------------------------------------------------------------
** Please LIKE 👍, FOLLOW ✅, SHARE 🙌 and COMMENT ✍ if you enjoy this idea! Also share your ideas and charts in the comments section below! **
-------------------------------------------------------------------------------
💸💸💸💸💸💸
👇 👇 👇 👇 👇 👇
Bitcoinsignals

Bitcoin- 35k could be nextSince the beginning of the year, Bitcoin is in an up trend contained in a nice rising channel, and after the break of the corrective falling wedge that followed the high of the year, the price rose again and for 3 weeks already is consolidating in this 30k zone.
This consolidation has formed a rectangle pattern which normally is a continuation pattern.
I expect this to be the case now and a new leg up will follow after the break above resistance.
35k is my target for BTC

Bitcoin Daily Price Action AnalysisHello traders, here's my analysis on price action of Bitcoin Daily. Currently we broker the daily uptrend structure which is mentioned as MSB ( Market Structure Break ) from where we are waiting for a replacement towards the golden pocket of Fib.R. I am looking for a short position from there and targeting towards the swing lows with the 21000 range for buying spot bags. DYOR, Don't forget to leave your opinion in comment section and like the idea. Happy Trading !!!.

Target is 59k (Bitcoin)I have been going on for some months about end of June being the next "Bitcoin event". The secret is that every year Bitcoin has a major pivot point , only one a year , which dictates the momentum for months, until the next date in the time sequence.
Here I go over back in May and state end of June is the time period for the next sequence. The only problem here was atleast for me it was not clear which way it was going to swing , even up until last week it could have flipped either way , last year things where much clearer because momentum was heavily to the downside.
As you can see we are on the 0.618 on this time fib and the reaction has been massive , we could be printing one of the biggest weekly candles in a long-time. These "event periods" are not small moves by any means , targets from here would be 59k.
Why 59k ? well bump and run reversal pattern target is 59k , last cycle Bitcoin did the same thing and hit the technical target.
As you can see it hit 13.5k a near perfect technical target from throwback , so far we have do the same and if we reach the technical target it would 59k.
What is also interesting is my Elliot wave indicator which is pretty dam good and pinpointing waves is signalling that the target range is also 56-59k target range.
Which also lines up with the 8/1 Gann Fan which is hovering around that 59k area also and to finish off we have a perfect 8/1 gann fann rejection of the USDT dominance.
So in the end this "event period" was a pivot to the upside not to the downside it seems that way for now , lets see how the weekly and monthly close.
So the next big date April 2024 which lines up with the Bitcoin halving , this fib date is more for Chainlink but still gives clues on where Bitcoin would be .
Something to note here not expecting all time high till October 2025 period.

Flash Crash or Bear Trap? (Bitcoin)The fact we are so close the Big Fib time date end of June 2023 and I still can't confirm which way this is going to swing is frustrating.
Last year it was so clear coming up to the fib date , this year price could swing either way.
For me there is two ways this is going to play out next 30-45days
1. We Flash crash down to retest the cycle low at 15k every cycle we create a double bottom , right now we keep be forming this crashing pattern that will take us back down to 15.5k.
As you can see it is a very distinct pattern it can appear in any timeframe , the higher the timeframe the longer it takes for the pattern to form .
There crashing patterns form everywhere not just Bitcoin.
So if it did flash crash then it would look very similar to 2015.
2.
Now the second outcome here is a massive bear trap and a massive move up to 40k end of June 2023.
Check this out.
We bounced massively off this moving average last time creating a huge bear trap. If it is going hold and reverse this is it , once we close under this moving average its over.
SPX500 bump and run reversal pattern still not reached its technical target .
We could still see a melt up in June 2023 for the SPX which would give a higher chance that Bitcoin hits 40k aswell.
So as you can see how things can swing each way , we break the yellow triangle and close above it for Bitcoin we go up or we continue making lower lows we will complete the crashing structure , guess we just have to wait.

Bitcoin held very well. Reversal could be nextBitcoin held its ground very well through Binance and Coinbase problems.
As we know, more often than not, when bad news is not affecting an asset and don't lead to a technical break, the asset is reversing to the upside and this also could be the case for BTC.
From a strictly technical perspective, 25k is strong confluence support, given by the trend line started at the beginning of the year and the horizontal level.
Also, the recent drop from 30k is corrective and a falling wedge.
Thant being said, BTC back above 27k would confirm the bullish outlook and could lead to a retest of the recent high or even a new one around 35k

BITCOIN Strong long-term buy signal by the BBWP!Bitcoin (BTCUSD) just flashed one of the rarest buy signals on the 1W time-frame. The Bollinger Band Width Percentile (BBWP) bottomed at 0%, giving a narrow width signal. Historically, when the price was above the 1W MA20 (red trend-line) during that signal (4 times/ green circle), it skyrocketed shortly after, while when it was below (1 time/ red circle) it dropped massively.
At the moment the price is on the 1W MA20 and it will be interesting to see if BTC closes above or below it, as it can influence the trend of the coming weeks. What do you think, will it close above it and skyrocket or below and decline? Feel free to let us know in the comments section below!
-------------------------------------------------------------------------------
** Please LIKE 👍, FOLLOW ✅, SHARE 🙌 and COMMENT ✍ if you enjoy this idea! Also share your ideas and charts in the comments section below! **
-------------------------------------------------------------------------------
💸💸💸💸💸💸
👇 👇 👇 👇 👇 👇

Bitcoin- Aggressive turn from 25kIn my yesterday's comment regarding BTC, I said that 25k is a strong floor for the price and dips in this zone should be bought.
Following Coinbase's news, Bitcoin dipped again, but this drop was very short-lived and the reversal was very aggressive, indicating bulls are very strong.
Technically we are still under the falling trend line that started in mid-April, but looking at the chart we can clearly see that the drop is corrective.
I'm strongly bullish at this moment and a break back above the 27500 level that I've mentioned before would bring additional confirmation for a potential rise to 30k.
Buy dips remain the recommended strategy as long as 25k holds and also a 1:3 R:R could be achieved with a good entry.

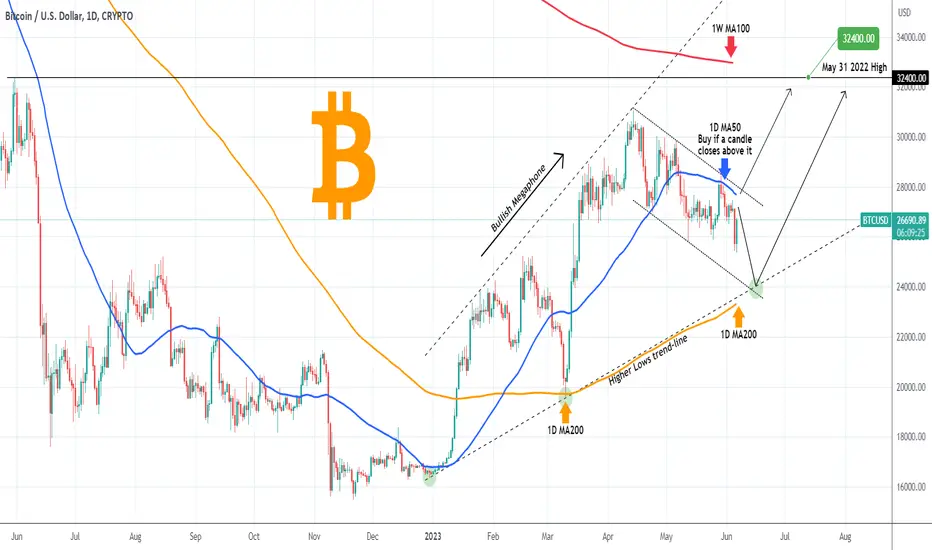
BITCOIN The Megaphone bottoms lower, unless this breaks first.Bitcoin (BTCUSD) made a new Lower Low since the short-term Channel Down started on April 14 and is rebounding in the past five hours. The long-term pattern remains a Bullish Megaphone and this Channel Down is the corrective wave towards the Higher Lows trend-line. For as long as it holds, it is likely to see it bottom on the 1D MA200 (orange trend-line) just like it happened on the March 10 Higher Low.
Be prepared though to buy earlier if the price closes a 1D candle above the 1D MA50 (blue trend-line), which hasn't happened since May 06 (exactly 1 month ago). In either case, our target is the next Resistance at 32400 (May 31 2022 High), which is where the 1W MA100 (red trend-line) is headed to, the last remaining MA Resistance.
-------------------------------------------------------------------------------
** Please LIKE 👍, FOLLOW ✅, SHARE 🙌 and COMMENT ✍ if you enjoy this idea! Also share your ideas and charts in the comments section below! **
-------------------------------------------------------------------------------
💸💸💸💸💸💸
👇 👇 👇 👇 👇 👇
TIME FOR 25200, Short soonI am ultimately bullish on BTC however there's need for a correction down to 25200 to complete the pattern that shoots it up above 31k
so my short is at 28190
sl - 28500
also swing failure pattern seen

BITCOIN The importance of the monthly closing.Bitcoin (BTCUSD) posted last month the first 1M (monthly) red candle closing since December 2022. That was a strong four month bullish streak with the 1M MA50 (blue trend-line) supporting since March 2023. On today's analysis we put emphasis on the importance of the candle closings on the 1M time-frame.
As you see, both May and April closed below the Resistance Zone (red) that was previously a Support in 2022 having closed all 1M candles up to April 2022 above it, despite some large wicks that broke much lower but where bought back aggressively in the end. That Support Zone is now the new Resistance Zone, in a similar way as the Resistance Zone of July - August 2022 (green) is now the new Support.
Within July - August, the 1W MA50 (red trend-line) will most likely enter that Support Zone, in a similar way as the 1W MA100 (green trend-line), which is the long-term Resistance, is now trading within the Resistance Zone. All this while the 1M MACD is about to complete a Bullish Cross, the first since July 2020.
As a result, we have a huge Neutral Zone ahead of us until the end of the year and will continue to hold as long as 1M candles close within it. A candle closing above the Resistance Zone, will be a bullish break-out signal towards the 45900 - 48500, which is the next Resistance Zone ahead and our long-term target.
So what do you think? Do monthly candle closings have any significance in Bitcoin's trend? And if so, do you agree with the proposed outlook above? Feel free to let us know in the comments section below!
-------------------------------------------------------------------------------
** Please LIKE 👍, FOLLOW ✅, SHARE 🙌 and COMMENT ✍ if you enjoy this idea! Also share your ideas and charts in the comments section below! **
-------------------------------------------------------------------------------
💸💸💸💸💸💸
👇 👇 👇 👇 👇 👇

BITCOIN Close to its first 1W MA20/200 Bullish Cross in HISTORY!Bitcoin (BTCUSD) is very close to forming a Bullish Cross on the 1W time-frame between the 1W MA20 (red trend-line) and the 1W MA200 (orange trend-line). When completed it will be its first such pattern in its history and that is a major bullish signal on its own. In order to get a full grasp of this formation's magnitude, we compare it with the Nasdaq (NDX) on the 1W time-frame as well (chart on the right).
As you see, Nasdaq has formed its 1W MA20/200 Bullish Cross 2 months already (March 06) and exactly on that formation it started a relentless rally, with both MA periods holding as Supports. The price is above the 0.618 Fibonacci retracement level and aiming at the Next Resistance (15300), which is almost on the 0.786 Fibonacci.
BTC has been obviously lagging behind, not even having broken above the 0.5 Fibonacci but with its Next Resistance (48350) also being almost on the 0.786 Fibonacci level. This potentially indicates that Bitcoin has much more upside to it.
So what do you think? Can BTC's first ever 1W MA20/200 Bullish Cross start a rally that will fill at least the 0.618 Fib gap in the same fashion as Nasdaq? Feel free to let us know in the comments section below!
-------------------------------------------------------------------------------
** Please LIKE 👍, FOLLOW ✅, SHARE 🙌 and COMMENT ✍ if you enjoy this idea! Also share your ideas and charts in the comments section below! **
-------------------------------------------------------------------------------
💸💸💸💸💸💸
👇 👇 👇 👇 👇 👇

I am SHORTING BITCOIN (BTCUSD)
Looks like the market maker will push BTC lower.
I decided to take a trend-following trade.
Entry - 26950
Stop loss - 27480
Target - 26100
Good luck!
Please, like this signal!

BITCOIN Is it repeating Amazon's incredible bull run?Bitcoin (BTCUSD) is currently testing (and so far holding) its MA200 (orange trend-line) on the 1W time-frame for the fourth straight week. This is being cemented as the new Support of the new Bull Cycle. A Bull Cycle which was confirmed after the price broke above the Lower Highs trend-line of the Bear Cycle, as well as the MA50 (blue trend-line), forming a Death Cross in the process.
We can see almost exactly the same pattern formed on Amazon (AMZN) back in 2010. After a break above its Lower Highs, Amazon formed a Death Cross on the 1D time-frame, broke above its MA50 and hit the MA200. With the MA50 is Support, after a short consolidation/ accumulation phase it started a relentless rally that broke above the previous High.
BTC seems to be currently on a similar consolidation phase. Does it mean that it might make one last short-term bearish wave near the MA50? If the RSI indicators between the two fractals are symmetrical, then BTC's current RSI pull-back suggests that we are at or near the new Low.
So what do you think? Is Bitcoin about to start a strong rally similar to 2010 Amazon's? Feel free to let us know in the comments section below!
-------------------------------------------------------------------------------
** Please LIKE 👍, FOLLOW ✅, SHARE 🙌 and COMMENT ✍ if you enjoy this idea! Also share your ideas and charts in the comments section below! **
-------------------------------------------------------------------------------
💸💸💸💸💸💸
👇 👇 👇 👇 👇 👇

BITCOIN Rejection on the 1D MA50 maintains the Channel Down.Bitcoin (BTCUSD) is on the third straight red 1D candle following Monday's rejection (and closing below) on the 1D MA50 (blue trend-line), the short-term Resistance MA. This maintains the medium-term Channel Down but at the same time the long-term Channel Up since the start of the year remains unbroken.
The 1D MA100 (green trend-line) is the first line of Support and if it holds, we will go long only when the price closes above both the 1D MA50 and Resistance 1 (28500). The target is, as stated on previous analyses, the 1W MA100 (red trend-line) at 32500. Note that the fact that the 1D MACD made a Bullish Cross on Saturday, empowers this probability.
On the other hand, a 1D candle close below the long-term Channel Up, makes the short-term Channel Down prevails and should extend selling towards the 1D MA200 (orange trend-line), which has been untouched since March 10. In that case, our target will be Support 2 (24000). The risk is low with this break-out strategy on the current levels, so plan your trades accordingly.
Which break-out do you think will prevail? Feel free to let us know in the comments section below!
-------------------------------------------------------------------------------
** Please LIKE 👍, FOLLOW ✅, SHARE 🙌 and COMMENT ✍ if you enjoy this idea! Also share your ideas and charts in the comments section below! **
-------------------------------------------------------------------------------
💸💸💸💸💸💸
👇 👇 👇 👇 👇 👇

BITCOIN 55k Bullish fractal on 1M ahead of a MACD Bullish Cross!Bitcoin (BTCUSD) is about to close the monthly candle of May and most likely it will be the first red since December. We haven't seen a four month bullish streak since January 2021. Despite the end of this succession, this is far from a discouraging long-term signal as the past two Cycles show that every time the 1M time-frame prints this pattern where a red 1M candle pauses a bullish streak, tests the Symmetrical Support (previous Resistance turned into Support) and holds, it then initiates a very strong rally.
Two times out of three this rise was the parabolic rally at the end of each Cycle (+560% in 2021 and +2100% in 2017). The first time it was the initial rally after the Bear Cycle bottom and it rose by +125%. On all occasions, the Symmetrical Support held, i.e. no candle ever closed below it. A +125% rise from this month's low gives an approximate target slightly above $55000. With the 1M LMACD about to make a Bullish Cross, the first since July 2020, this fractal seems to be gathering all the firepower it needs to start the next phase of the Bull Cycle.
Note that after the red monthly candle, during the previous fractals, the rally peaked in 5, 7 and 9 months. The earliest (5 months) times the $55k top in October.
So what do think? Is this the final red monthly candle before a relentless rally? Feel free to let us know in the comments section below!
-------------------------------------------------------------------------------
** Please LIKE 👍, FOLLOW ✅, SHARE 🙌 and COMMENT ✍ if you enjoy this idea! Also share your ideas and charts in the comments section below! **
-------------------------------------------------------------------------------
💸💸💸💸💸💸
👇 👇 👇 👇 👇 👇

BITCOIN RSI break-out and the Bollinger huge upside!Our last week's buy signal was purely based on the 1D RSI break-out (see chart below) and Bitcoin (BTCUSD) didn't fail to deliver:
As you see, the RSI on the 1D time-frame eventually broke above its Lower Highs trend-line, and as it has done all year on three previous occasions, it is starting to rise aggressively. Today the price broke above the 1D MA50 (blue trend-line) but has so far been rejected. BTC needs a candle close above it in order to accumulate more buyers and extend this rally. On a different occasion, the 1D MA100 (green trend-line) may be re-tested for validation.
The price did however break above the Bollinger Bands top and the BBWidth remains low, indicating that there is considerable upside potential. This is the first time this year that BTC had a 1D RSI break-out that low with the BBW at its lowest possible level. With the long-term pattern being a Channel Up and the price practically still trading on its bottom, the low BBW simply validates further the argument of the significant upside potential. Once a 1D candle closes above the 1D MA50, the short-term target will be the 1W MA100 (red trend-line) at 32500.
But what do yo think? Was the RSI Lower Highs break-out the early buy signal to 32500 we've been waiting for? Feel free to let us know in the comments section below!
-------------------------------------------------------------------------------
** Please LIKE 👍, FOLLOW ✅, SHARE 🙌 and COMMENT ✍ if you enjoy this idea! Also share your ideas and charts in the comments section below! **
-------------------------------------------------------------------------------
💸💸💸💸💸💸
👇 👇 👇 👇 👇 👇

BIG DAY TOMORROW (BITCOIN BTC)Someone please tell me, "this time it's different." Come on, I dare you, lol.
Tell me, who wants to rent my crystal ball?
It's a mirror, literally a mirror, with comments going all the way back from that crystal ball TA that "this time it's different" because of the "macro environment." Haha, what garbage.
We longed PICO bottom.
For the traders who are not in denial, let's break it down.
We've been following a Fib time sequence from 2019 that could play out like last cycle.
0.5 Fib time to 0.618 is the pocket where you get pivots in the market. As you can see, last cycle, 0.5 Fib time marked the reversal for the final wave of the relief rally.
What are the chances that both last cycle and this cycle, 180 days out of the cycle low, we get both 0.5 Fib and symmetrical triangles? Tell me, what are the chances? Tell me, please, that "this time it's different," all the way up to 50k.
Tomorrow is a big day. We either complete the mirrored pattern which at this moment, I believe there is a much higher chance we break to the upside or we begin a crashing structure back down to 15.5k.
So, we nailed the two biggest moves of 2022, and my macro streak is still alive, the first macro prediction this year.
40-50k Bitcoin top for this year sometime late June to mid-August 2023.
Invalidation would be weekly close under 0.382 Fan Fib.

BITCOIN The path to $250k is revealed. Bitcoin (BTCUSD) has been on a minor pull-back phase in the past 5-6 weeks and that is again inflicting fear in the weak hands of the market participants. However, this should make us lose sight of the bigger picture and BTC's long-term goal. This chart on the 1W time-frame illustrates a very unique pattern that splits BTC's historic price action into 4 phases that can potentially reveal the next cyclical Top.
** The Two Phases **
As you see, the Cycles are divided into Bear-to-Bear (blue) and Bull (green) Phases. The Bear-to-Bear begins at the start of the Bear Cycle and ends at the bottom of the next Bear Cycle. The Bull Phase starts on that bottom and ends at the top before the Bear begins. We are currently on the new Bull Phase, which in accordance to the previous Bull Phase, the price is pulling back (circle) towards the 1W MA50 (blue trend-line) that is technically the long-term Support during this part of the Cycle. The 1W RSI is pulling back after turning overbought early last month, similar to what happened on December 14 2015. Based on that, we are expected to form a bottom within the next 2 weeks.
** The RSI symmetry **
The 1W RSI is particularly helpful when it comes to mapping those Phases and identifying identical spots in time, as the symmetry between Phases is astounding. The Cycle Top is easily revealed by the RSI, followed by Lower Highs that drive it to an oversold state, where investors can start buying again. Another distinct characteristic is the Overbought Volatility of the RSI as the price rises within its Bull Phase.
** The Cyclical Pivot **
What is perhaps the most important part of this cheat-sheet, is the Cyclical Pivot trend-line. That starts at the bottom of the Bear-to-Bear Phase, supports all the way and then gets broken at the start of the Bull Phase. The key attribute is that when BTC hit it again on December 11 2017, the Bull Phases Top was formed. As a result, we can argue that when BTC hits the new Cyclical Pivot trend-line again, we could have the new cyclical Top. Since the Phases have been fairly proportional so far, we can expect the new Bull Phase to last for at least 152 weeks (1064 days), and by that time a technical contact with the Cyclical Pivot can be at around $250k.
But what do you think? Can $250000 be the new Top? Feel free to let us know in the comments section below!
-------------------------------------------------------------------------------
** Please LIKE 👍, FOLLOW ✅, SHARE 🙌 and COMMENT ✍ if you enjoy this idea! Also share your ideas and charts in the comments section below! **
-------------------------------------------------------------------------------
💸💸💸💸💸💸
👇 👇 👇 👇 👇 👇

BITCOIN The RSI Lower Highs is the keyBitcoin (BTCUSD) is yet again testing the 1D MA100 (green trend-line), for the 4th time is 12 days. While this is obviously the Support (if broken then the 1D MA200 can be tested) and the 1D MA200 (blue trend-line) the short-term Resistance, it is the 1D RSI that we might want to be looking at for the next confirmed buy entry.
As you see it is currently under a Lower Highs trend-line with the last rejection coming yesterday. Every time it broke above such Lower Highs trend-lines since the start of the year, a strong rally followed (+16.88%, +43.59% and +11.34% respectively).
Is this one of the indicators you'll be looking for a buy signal? Feel free to let us know in the comments section below!
-------------------------------------------------------------------------------
** Please LIKE 👍, FOLLOW ✅, SHARE 🙌 and COMMENT ✍ if you enjoy this idea! Also share your ideas and charts in the comments section below! **
-------------------------------------------------------------------------------
💸💸💸💸💸💸
👇 👇 👇 👇 👇 👇

BITCOIN 1W MACD Bearish Cross but 50k end-of-year possible!Bitcoin (BTCUSD) continues to show strong similarities with the 2015/16 Cycle, which is something we first posted almost a year ago when the market made the June Low. Right now BTC is about to complete a Bearish Cross on the 1W LMACD, the first since April 2022. Even though that's a technically bearish signal, during Bull Cycles it is a sign of a medium-term consolidation.
In relation to 2015/16 in particular, the 1W LMACD Bearish Cross that took place in mid January 2016, was formed right after a strong pull-back to Fibonacci 0.382 and a steady rise/ consolidation started that broke out when a 1W candle closed above the 0.5 Fibonacci. The 1W MA100 (green trend-line) was in Support during that phase.
Today, the 1W MA100 is the Resistance, sitting right on the 0.5 Fibonacci level, while it was the 1W MA200 (orange trend-line) that supported the pull-back two weeks ago to the 0.382 Fibonacci. The 1W MA50 (blue trend-line), which is the Bull Cycle's standard Support, is considerably lower on the 0.236 Fibonacci ($22000).
It is interesting to mention that the date range from the LMACD's bottom to the Bearish Cross on the 2015/16 Cycle, measured 49 weeks (343 days), while in 2022/23 it is 45 weeks (315 days), showing yet again remarkable signs of symmetry.
All the above data suggest that we may have a summer of consolidation ahead within the 0.382 - 0.5 Fibonacci Zone, but as Bitcoin in 2016 later broke out towards the 0.786 Fib, an end-of-the-year target near $50k is very much plausible.
But what do you think? Is this a good Accumulation Phase for BTC based on the above model in anticipation of $50000 towards 2024? Feel free to let us know in the comments section below!
-------------------------------------------------------------------------------
** Please LIKE 👍, FOLLOW ✅, SHARE 🙌 and COMMENT ✍ if you enjoy this idea! Also share your ideas and charts in the comments section below! **
-------------------------------------------------------------------------------
💸💸💸💸💸💸
👇 👇 👇 👇 👇 👇

BITCOIN will extend the rally based on the alts market cap!Bitcoin (BTCUSD) has been on a 1 month pull-back ever since it started the new Bull Cycle rally at the start of this year. We have compared the current Cycle to that of 2015-2017 numerous times and as the market fears (yet again) of a stronger correction/ major trend reversal, the Crypto Total Altcoin Market Cap (OTHERS)/ BTC ratio provides more insight.
This ratio (orange trend-line) has made a new Low just last week and has been on Lower Lows since January 2022, which was when Bitcoin closed below its 1W MA50 (blue trend-line) and kickstarted the aggressive part of the Bear Cycle.
In December 2015 the OTHERS/BTC ratio also reached its Lower Lows bottom, started in late September 2014 that was the aggressive part of that Bear Cycle. On both sequences, BTC was above the 1W MA50 but on a short-term pull-back. If the ratio starts rebounding aggressively, it would mean that BTC is right on track and most likely will follow 2016 by extending the long-term rally with the 1W MA50 as the Support.
Do you think this will be the case or this pull-back is the start of a deeper correction for BTC? Feel free to let us know in the comments section below!
-------------------------------------------------------------------------------
** Please LIKE 👍, FOLLOW ✅, SHARE 🙌 and COMMENT ✍ if you enjoy this idea! Also share your ideas and charts in the comments section below! **
-------------------------------------------------------------------------------
💸💸💸💸💸💸
👇 👇 👇 👇 👇 👇

BITCOIN 1W Ichimoku turns green = final BUY SIGNAL!!Bitcoin (BTCUSD) turned its Ichimoku Cloud green again on the 1W time-frame for the first time since July 2022. However it is the first time that it goes from red to green since December 2020 and if it wasn't for the March 2020 COVID crash, it would have been the first since November 2019!
This shows that on a cyclical basis, this is a very rare occurrence. On the previous Cycle it took place in April 2016 and it indicates that it is the major shift from bearish to bullish. Basically (if we exclude the March 2020 COVID crash which is a black swan/ huge irregularity event) when the Ichimoku turns green after the Bear Cycle's red Cloud, the price never breaks below it. Essentially it becomes BTC's Support for the Bull Cycle.
We can safely argue that as soon as BTC breaks above the red Cloud, it now has a floor to work with as a Support and traders can plan their buys accordingly, as close to the green Cloud as possible.
But what do you think? Do we have our new Support for this Cycle? Feel free to let us know in the comments section below!
-------------------------------------------------------------------------------
** Please LIKE 👍, FOLLOW ✅, SHARE 🙌 and COMMENT ✍ if you enjoy this idea! Also share your ideas and charts in the comments section below! **
-------------------------------------------------------------------------------
💸💸💸💸💸💸
👇 👇 👇 👇 👇 👇

BITCOIN Is approaching its bottom. Will you buy this?Bitcoin (BTCUSD) is trading again back towards its 1D MA100 (green trend-line) after rebounding on it a few days ago. This is a minor bearish signal on the short-term as the previous hit and pump on the 1D MA100 (March 09) delivered a massive rebound instantly.
The 1D RSI however shows that the bottom is closer than we think, if it's Higher Lows trend-line holds once more. The (a-b-c) structure of the current leg is similar to February - March. Price-wise both where on Megaphone patterns that broke for a short while to the 1D MA100. It remains to be seen if this provides Support again.
The buy confirmation will be a 1D candle close above the 1D MA50 (blue trend-line). If it does, given that the last two rallies where over +50%, we are looking at at least a $38000 target.
So are you buying this pull-back? Feel free to let us know in the comments section below!
-------------------------------------------------------------------------------
** Please LIKE 👍, FOLLOW ✅, SHARE 🙌 and COMMENT ✍ if you enjoy this idea! Also share your ideas and charts in the comments section below! **
-------------------------------------------------------------------------------
💸💸💸💸💸💸
👇 👇 👇 👇 👇 👇
