BITCOIN The break-out plan. Ignore the noise.Bitcoin (BTCUSD) has been trading within a short-term Channel Down patten since the April 14 31000 High. The recent rebound last Friday was made on the 1D MA100 (yellow trend-line), which was the level that also held and made the price rebound on the March 10 low. Technically this level can alter the current pattern dynamics as it falls in the category of macro Support level.
A daily closing below it (or better yet the 25800 Low), is a bearish break-out signal towards the -1.0 Fibonacci extension. In that case we will target the 1D MA200 (red trend-line) at 23000.
A daily closing above the 29850 High, is a bullish break-out signal towards the 2.0 Fibonacci extension. In that case we will target the 1W MA100 (green trend-line) at 33000.
Anything within the two Resistance/ Support levels is noise and is subject to high volatility. Perhaps the range within the 1D MA200 and the 4H MA200 (orange trend-line) can be scalped, using the 4H MA50 (blue trend-line) as Pivot, but noise is best to be ignored when BTC is heavily trending on the higher time-frames.
Do you agree with this? Feel free to let us know in the comments section below!
-------------------------------------------------------------------------------
** Please LIKE 👍, FOLLOW ✅, SHARE 🙌 and COMMENT ✍ if you enjoy this idea! Also share your ideas and charts in the comments section below! **
-------------------------------------------------------------------------------
💸💸💸💸💸💸
👇 👇 👇 👇 👇 👇
Bitcoinsignals

BITCOIN hit the 1W MA200 after 2 months! Stocks may show the wayBitcoin (BTCUSD) hit today the 1W MA200 (orange trend-line) for the first time since the March 13 weekly bullish break-out. Basically this is the first time that the 1W MA200 is being tested as a Support since the weekly candle of August 15 2022. If it holds, it will be confirmed most likely as a Support and accumulate more buyers for a rebound to the last standing MA level, the 1W MA100 (green trend-line). If it closes below the 1W MA200, we may see a final pull-back to the 1W MA50 (blue trend-line).
The stock market (right chart) represented by the S&P500 (SPX) on this analysis, may be an early signal to BTC's price action as it is near its own 1W MA100 (green trend-line), for 5 straight weeks. If broken, it will be a major long-term buy signal as it has been untouched since the week of August 22 2022. The longer it fails to break it, the more probable it is to make one last pull-back to its 1W MA50 (blue trend-line).
So what do you think? Will BTC hold its 1W MA200 and if so, coupled with an S&P500 break-out above its 1W MA100, will it reach $32000? Feel free to let us know in the comments section below!
-------------------------------------------------------------------------------
** Please LIKE 👍, FOLLOW ✅, SHARE 🙌 and COMMENT ✍ if you enjoy this idea! Also share your ideas and charts in the comments section below! **
-------------------------------------------------------------------------------
💸💸💸💸💸💸
👇 👇 👇 👇 👇 👇

BITCOIN A 2020 fractal calls for 25/26k before a strong rally!Bitcoin (BTCUSD) has been trading below the 1D MA50 (blue trend-line) for the 4th straight day, inside this 4 month Channel Up. We have spotted a similar Channel Up pattern from May to October 2020.
This started a rally after two conditions were met: the 1D RSI hit 35.00 and the price broke below the 1D MA100 (green trend-line) to form a bottom on the Channel's Higher Low. After the 1D MA50 broke again, it started a relentless rally.
Are you waiting for a buy near that level and if so are you expecting an aggressive rally afterwards? Feel free to let us know in the comments section below!
-------------------------------------------------------------------------------
** Please LIKE 👍, FOLLOW ✅, SHARE 🙌 and COMMENT ✍ if you enjoy this idea! Also share your ideas and charts in the comments section below! **
-------------------------------------------------------------------------------
💸💸💸💸💸💸
👇 👇 👇 👇 👇 👇

BITCOIN Huge Bullish Cross that kickstarts the Parabolic RallyBitcoin (BTCUSD) has failed to break above its 3W MA50 (blue trend-line) but the KST indicator is about to make its Bullish Cross. The previous three clear Bullish Crosses have been on July 2020, January 2016 and June 2013. All have kickstarted major Parabolic Rallies for BTC.
Since we have established that the Bear Cycle has technically ended and that we are already at the start of the new Bull Cycle, do you think that we are only a few weeks away from initiating another strong rally? Feel free to let us know in the comments section below!
-------------------------------------------------------------------------------
** Please LIKE 👍, FOLLOW ✅, SHARE 🙌 and COMMENT ✍ if you enjoy this idea! Also share your ideas and charts in the comments section below! **
-------------------------------------------------------------------------------
💸💸💸💸💸💸
👇 👇 👇 👇 👇 👇

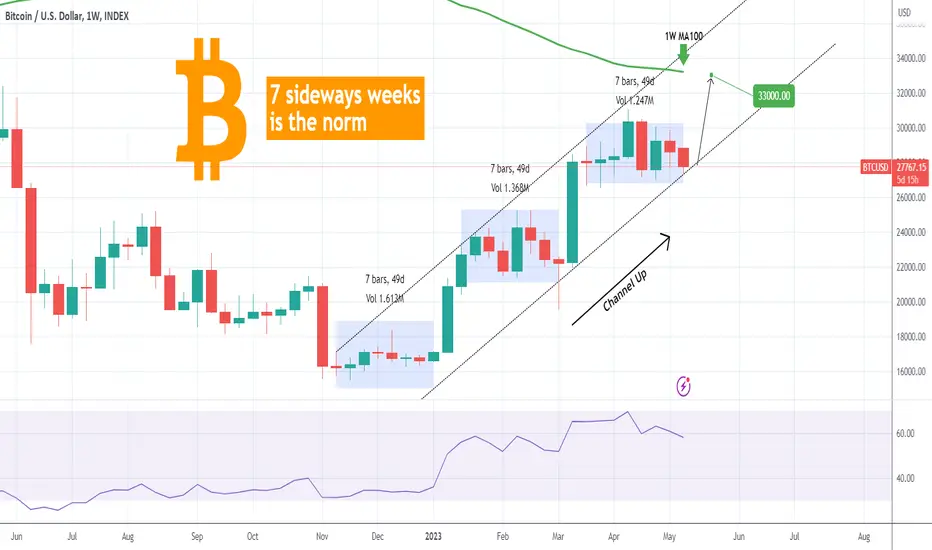
BITCOIN 7 sideways weeks is the norm. Embrace it and make profitBitcoin (BTCUSD) has been trading within a Channel Up pattern since the November FTX crash bottom. Inside this pattern, it has already seen a 7 straight week (1W) consolidation phase, two times already and currently it is about to complete the 7th week of the third consolidation phase.
This is taking place right at the bottom (Higher Lows trend-line) of the Channel Up. If the current 1W candle closes in green or with a strong upward closing inside the Channel (as March 06), then most likely we will see a strong bullish 1W candle following such as the ones on January 09 and March 13. The short-term Target is the 1W MA100, which has been holding as Resistance since May 02 2022 (green trend-line), at a projected price of $33000.
-------------------------------------------------------------------------------
** Please LIKE 👍, FOLLOW ✅, SHARE 🙌 and COMMENT ✍ if you enjoy this idea! Also share your ideas and charts in the comments section below! **
-------------------------------------------------------------------------------
💸💸💸💸💸💸
👇 👇 👇 👇 👇 👇
BITCOIN next Top can be at least $200k!Bitcoin (BTCUSD) is on a short-term pull-back and much of the crypto community casts doubts again over the recent rally and if this is indeed a new Bull Cycle or a bear market counter trend rally.
In times of short-term uncertainty we tend to rely our channel on the long-term time-frames and for BTC in particular its historic Cycles. Those are patterns that have repeated themselves over and over again, with some variations of course based on the current market conditions.
** The Fibonacci Channels **
Right now the price is above the 1W MA50 (blue trend-line), on a 5-month rally that hasn't been anything like short-term Bear Cycle rallies. The previous Cycles topped near Fibonacci trend-lines of prior Cycle Channels. For example the December 2017 Cycle Top was formed just below the bottom (Fib 0.0) of the orange Fibonacci Channel that started from the previous Cycle bottom. The November 2021 Top was formed just below the middle (Fib 0.5) of the blue Fibonacci Channel. This could be a +0.5 Fib progression and in that case the Top of the current Cycle might be just below the top (Fib 1.0) of the black Fibonacci Channel that started on the December 2018 bottom.
** The Halvings and $200k **
The 1.0 Fib at the time of (the next) Halving 4 (March 2024) will be above $200000, and as we know after each Halving, Bitcoin posts the most aggressive (parabolic) rally of the Bull Cycle. So that leads us to assume that the Top of the current Bull Cycle will be at least $200k. To give a relative sense of pathing, we have plotted the 'post Halving rallies' of the previous three Cycles on the current Channel starting on Halving 4.
Do you think that we will see $200k by 2025 Q3? Feel free to let us know in the comments section below!
-------------------------------------------------------------------------------
** Please LIKE 👍, FOLLOW ✅, SHARE 🙌 and COMMENT ✍ if you enjoy this idea! Also share your ideas and charts in the comments section below! **
-------------------------------------------------------------------------------
💸💸💸💸💸💸
👇 👇 👇 👇 👇 👇

BITCOIN If the low volume worries you, see this chart!Bitcoin (BTCUSD) has been on a strong recovery since late November, following the FTX crash but is doing so on Decreasing Volume. This is something that has gotten many market participants worry as decreasing volume during rallies make the trend fragile.
A simple look however at past Cycle bottoms is enough to provide a good understanding of the current situation. As this chart (4D time-frame) shows, there was Decreasing Volume on all previous major market bottoms, especially in times of extreme capitulation such as the March 2020 COVID crash, or the August 2015 Bitfinex crash. With the FTX crash in early November 2022 being such a capitulation even, there should be no surprise that the volume has been decreasing ever since. With BTC almost doubled since then, we can strongly claim that this is a standard Cycle bottom rally.
If we start seeing the volume rising, then it means that the market is most likely headed for the mid Cycle peak, typically before the next Halving.
In any case are you worried about this decreasing volume while the price has been rising or agree that this is common after Cycle bottoms? Feel free to let us know in the comments section below!
-------------------------------------------------------------------------------
** Please LIKE 👍, FOLLOW ✅, SHARE 🙌 and COMMENT ✍ if you enjoy this idea! Also share your ideas and charts in the comments section below! **
-------------------------------------------------------------------------------
💸💸💸💸💸💸
👇 👇 👇 👇 👇 👇

BITCOIN When you see this, it will already be TOO LATE!This is an interesting analysis on the 1W time-frame of Bitcoin (BTCUSD) against the GOLD/SPX ratio(blue trend-line). The conclusion that this comparison offers can be very valuable.
As you see, when the GOLD/SPX ratio peaks and starts pulling back, Bitcoin starts the Parabolic Rally of its Bull Cycle. At the moment the GOLD/SPX ratio is on a Channel Up similar to 2018 - 2019. When the ratio broke that Channel to the upside, it peaked as in February 2016 and started to decline. At the same time Bitcoin kick started its Parabolic Rally.
Will you be on the look-out for such a spike or when it happens it will already be too late? Feel free to let us know in the comments section below!
-------------------------------------------------------------------------------
** Please LIKE 👍, FOLLOW ✅, SHARE 🙌 and COMMENT ✍ if you enjoy this idea! Also share your ideas and charts in the comments section below! **
-------------------------------------------------------------------------------
💸💸💸💸💸💸
👇 👇 👇 👇 👇 👇

Bitcoin Roadmap (Crystal Ball Edition)This is the final version of the Bitcoin roadmap , the ball has spoken.
Next all time high will be sometime October 2026 until then you have this guide on when to sell and when to buy , this could go down as the greatest TA of all time and I think it will be.
Expect the 2022 relief rally to be triggered with the announcement of war ending sometime October 2022.
“Nobody knows what the future is except for wizards”

BITCOIN Never looked back after breaking this level!Bitcoin (BTCUSD) is above the Multiple 3 (black trend-line) of the Fibonacci MAs for the third straight 3W candle. Every time it did so, the price always hit Multiple 4 (yellow trend-line). This level is now at $43300 and rising. Do you think this is BTC's next target within a 6 month time-frame? Feel free to let us know in the comments section below!
-------------------------------------------------------------------------------
** Please LIKE 👍, FOLLOW ✅, SHARE 🙌 and COMMENT ✍ if you enjoy this idea! Also share your ideas and charts in the comments section below! **
-------------------------------------------------------------------------------
💸💸💸💸💸💸
👇 👇 👇 👇 👇 👇

The Bitcoin Event Of 2023The Next Big Bitcoin Event
Its getting to that time again the next Fib time sequence is around the corner, for months I have been going on about the next date, the last week of June 2023. Last year we managed to predict the biggest move of 2022 end of May/June 2022.
I would say I was pretty dam close and if you look at the date of that publication that was January 2022 so months before this timeframe, I already knew the outcome and it was all because of this Fib time sequence I have been using for over a year now.
When it comes to technical analysis I focus a lot on time, I think time is the key to be ahead when these macro pivots come and so far on a macro timeframe, we been successful since the start of 2022. The Fibonacci time sequence you see the main chart about is one I’m currently following closely even though is not the one, I have been following for over a year it still lines up to last week of June 2023.
If we look at the last cycle when can see that the timeframe between 0.5-0.618 happen to be a major pivot.
If we zoom in, we can see how closely 2019 its following, if we continue mirroring then its possible we see 38k top by end of June 2023 and come May 8th (0.5 Fib) we shall start seeing the pivot to the upside. Many traders are pointing to a retest of the top of previous resistance which was 25k , I think that is also possible but we would have to close above the 0.382 fib Fan to keep this rally alive , so a wick down to 25k and a close above 26k , just like it did march 6th 2023 with that massive weekly candle wick.
This date May 8th is lines up closely with the next FOMC meeting where will see what rate hike we will get if we get a pause, it would be setting up perfectly for one leg up, history shows that pauses cause short term rallies which are then followed by massive drops.
USDT dominance broke and closed above the 2/1 Gann Fann that I was watching closely which is not a good sign at all , if Bitcoin did wick to 25k then its most likely USDT would go up to the 3/1 Gann fan which is where it got rejected last time again march 6th 2023.
The bump and run that took Bitcoin out of a bear market last cycle gave us the pico top at 13.8k which was the 0.618 , this was the technical breakout target of the bump and run reversal
So this is where things getting interesting, the technical breakout target of this years bump and run that did the same thing as last cycle, took us out of a bear market is 60k , that’s right folks that’s the target of this Marco pattern.
So now to the doom and gloom the red dashed projection on the main chart. Every cycle we make a Marco double bottom , it will be a black swan event , last cycle it was covid this cycle war/banking etc many catalysts out there pick one , here it does not matter if it comes we go in heavy because we will be expecting it.
As you can see the double bottom happens before the halving event always and we are about 300days off the next which is in April 2024 so it is possible that we get the “pivot” for the crash coming last week of June 2023 if we keep on making lower lows on the daily week after week.
This year it is definitely much harder to call a direction, most of the market thinks we have plenty of time to move up but for me its 60days for the move whether is up or down it all depends for me on holding that 0.382 fan fib , we start closing under it come end of June then red projection is likely to play out , one thing for sure coming into this timeframe things are going to get crazy.

BITCOIN The astonishing symmetry with 2014/15 shows $49k in NovOn today's analysis we look into Bitcoin (BTCUSD) on the 1W time-frame and compare the current Cycle with that of 2014 - 2017. As you see there is so far an astonishing symmetry between the two, with the price currently consolidating after almost hitting the 0.5 Fibonacci retracement level three weeks ago. For the Fibonacci calculations we have used the price top and bottom as suggested by the 1W RSI, which is the backbone of the analysis. This indicates that the Cycle Top (on RSI terms) was on the week of April 12 2021 (and not Nov 08 2021) while the Cycle Bottom was on the week of June 13 2022 (and not in November 2022, which was in the aftermath of the FTX crash).
So far the three Phases have lasted almost the same time. If Phase 3 (yellow) ends this week on a 46 week duration such as November 30 2015, then on the next 1W candle we will start Phase 4 (green), which in 2016 lasted for 28 weeks and on its end hit the 0.786 Fibonacci level. As a result, this is a highly probable target, with the 0.786 Fib being at $49000 and the 28 week span ends on November 13 2023.
With the 1W RSI pulling back after hitting the 70.00 overbought level in April, do you think BTC will start a strong Phase 4 next week towards FWB:49K ? Feel free to let us know in the comments section below!
-------------------------------------------------------------------------------
** Please LIKE 👍, FOLLOW ✅, SHARE 🙌 and COMMENT ✍ if you enjoy this idea! Also share your ideas and charts in the comments section below! **
-------------------------------------------------------------------------------
💸💸💸💸💸💸
👇 👇 👇 👇 👇 👇

BTCUSD top-down analysisHello traders, this is a complete multiple timeframe analysis of this pair. We see could find significant trading opportunities as per analysis upon price action confirmation we may take this trade. Smash the like button if you find value in this analysis and drop a comment if you have any questions or let me know which pair to cover in my next analysis.

BITCOIN How the VIX will push it (along with stocks) much higherYou may be wondering what Bitcoin (BTCUSD) has to do with the S&P500 index (SPX) and the Volatility Index (VIX). Well this chart gives you the answer and sets the tone for the remainder of the year and beyond.
As you see Bitcoin (chart on the left) rebounded on the Higher Lows trend-line that started on the December 2018 Low (and only broke during the COVID crash). The S&P500 (chart in the middle) is following a similar pattern as its Higher Lows trend-line (that only broke during the U.S. - China trade war and the COVID crash) held and gave the index a push last October.
At the same time VIX (chart on the right) has been holding its Higher Lows trend-line up until this month (April). This bearish break-out implies that the index that measures the market volatility will most likely drop further indicating a decline in uncertainty and setting a risk-on tone for stocks and crypto alike. The lower the volatility, the higher risky assets such as stocks and crypto trade.
Do you think that will be the case for the rest of the year and probably beyond after this bearish break-out on VIX? Feel free to let us know in the comments section below!
-------------------------------------------------------------------------------
** Please LIKE 👍, FOLLOW ✅, SHARE 🙌 and COMMENT ✍ if you enjoy this idea! Also share your ideas and charts in the comments section below! **
-------------------------------------------------------------------------------
💸💸💸💸💸💸
👇 👇 👇 👇 👇 👇

BITCOIN Held key Cycle Support, preparing a mega break-out!Bitcoin (BTCUSD) is rebounding off the 0.5 Fibonnaci Lower Lows trend-line that provided Support numerous times during the previous Cycle but when it finally closed a 1W candle below it (June 06 2022) it started the final bearish sequence.
Currently this is very positive for the upside's chances and if BTC manages to close a 1W candle above the 0 Fib, we can see the final two bullish waes to 36000 and 43000. At the same time, the Higher Lows trend-line since the market bottom is holding, while the 1W MA50 (blue trend-line) hasn't been re-tested in a month and a half.
Do you think that hold on the 0.5 Fib was the key and we are off to the races again? Feel free to let us know in the comments section below!
-------------------------------------------------------------------------------
** Please LIKE 👍, FOLLOW ✅, SHARE 🙌 and COMMENT ✍ if you enjoy this idea! Also share your ideas and charts in the comments section below! **
-------------------------------------------------------------------------------
💸💸💸💸💸💸
👇 👇 👇 👇 👇 👇

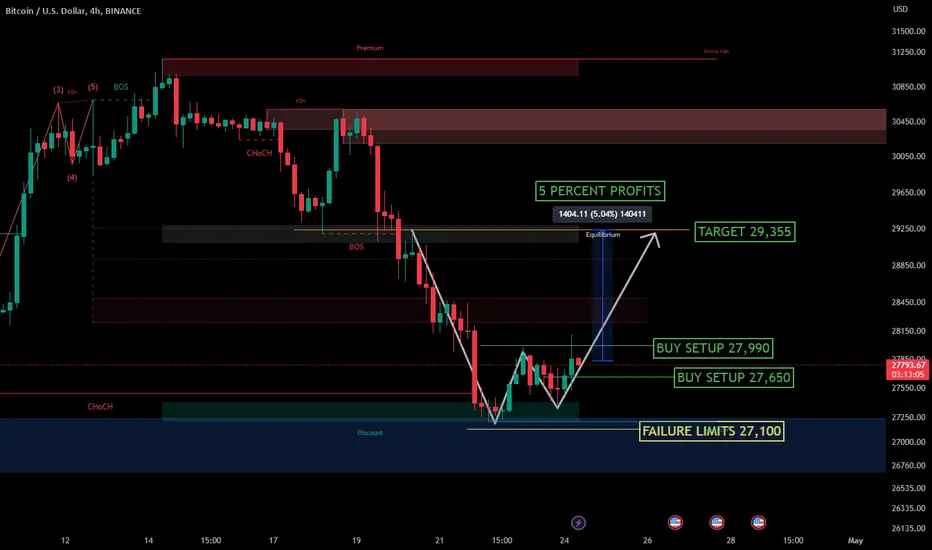
BITCOIN hit the 1D MA50 after 40 days!Bitcoin (BTCUSD) hit yesterday (and closed above it) the 1D MA50 (blue trend-line0 for the first time since March 13. At the same time it almost touched the 0.618 Fibonacci level of the Channel Up, which has been the last level of Support before the bottom of the Channel Up.
The key here are the 1D RSI and LMACD indicators. We've placed both on the same pane and as you see they both imply that we may be in a similar spot as March 07 - 10. Whether we get a macro catalyst (it was the Credit Suisse crisis then) that will pull the price back to the bottom of the Channel Up or not, that remains to be seen.
If BTC closes a 1D candle below the 1D MA50, it is possible to see that last pull-back to the bottom of the Channel Up. If not, expect a rebound from current levels. In either case, our target is 33000.
Feel free to let us know in the comments section below!
-------------------------------------------------------------------------------
** Please LIKE 👍, FOLLOW ✅, SHARE 🙌 and COMMENT ✍ if you enjoy this idea! Also share your ideas and charts in the comments section below! **
-------------------------------------------------------------------------------
💸💸💸💸💸💸
👇 👇 👇 👇 👇 👇

BTC SHORT 🔴 Bitcoin short 🔴
BTC/USDT SHORT
ENTRY PRICE- 27,600$
TP- 25,300$
SP- 28,100$
@msrcrtpto1
join premium signals
BINANCE:BTCUSDT.P

BITCOIN Cycle Phases in a very demonstrative way!post, we are looking into Cyclical phase and demonstrate them in a way like you've never seen before!
Each Cycle consists of the Bear (red), Transition (blue) and Bull (green) Phases. The Bear Phase ends at the bottom of the Cycle, where the Transition starts and typically after the price breaks above the 0.786 Fibonacci retracement level, the Bull Phase starts.
At the moment BTC is above the 1W MA50 (blue trend-line), has already started its Transition Phase and is expected to stay within it, until the 0.786 Fib breaks. Technically this may not happen before the next Halving (4), which due on May 2024. If it breaks earlier, expect the next Bull Phase (which is usually the most aggressive/ parabolic part of the Cycle) to start earlier.
Do you like this Cycle representation? Feel free to let us know in the comments section below!
P.S. The Cycles and trend-lines may get distorted and displaced based on your screen display. Adjust the axis accordingly to view the image as it is shown outside the idea.
-------------------------------------------------------------------------------
** Please LIKE 👍, FOLLOW ✅, SHARE 🙌 and COMMENT ✍ if you enjoy this idea! Also share your ideas and charts in the comments section below! **
-------------------------------------------------------------------------------
💸💸💸💸💸💸
👇 👇 👇 👇 👇 👇

[BTCUSD] BITCOIN SCALPING STRATEGYTheVision:
We see bitcoin has a short-term strategy for trade right now with a percentage profit of 5%.
#disclaimeron
Bitcoin Long Trade (High Risk)Interesting fractal appearing here on the 1hour , this is the same fractal that appeared when Bitcoin made that massive bear trap down to 19.5k.
This fractal appears in all timeframes and it is a bottoming fractal most of the time.
The higher the timeframe the bigger the move , this was the fractal that formed at 15-18k range.
Closing above the blue line within this pattern would be key here to long ,risky one no doubt.

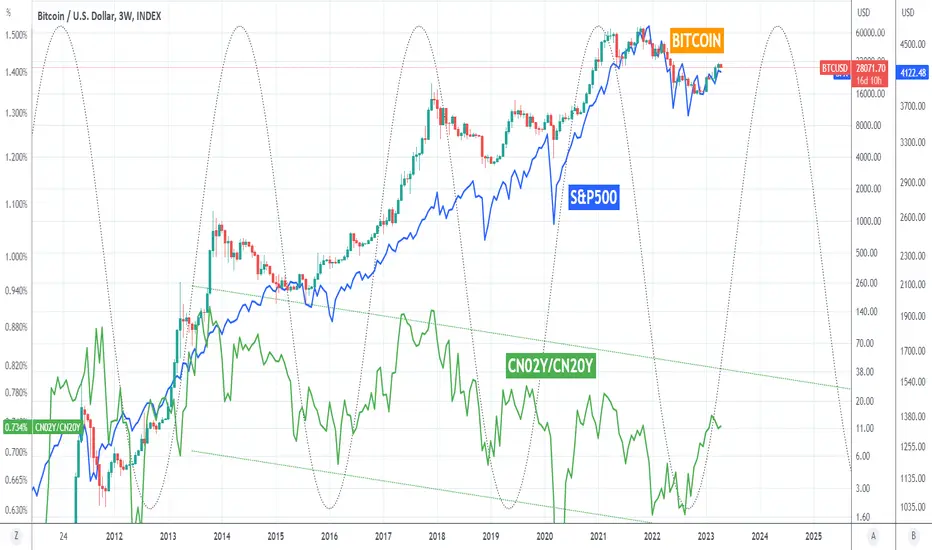
BITCOIN being pumped after China bonds macro cycle bottomIt is not the first time we look into how the Chinese bonds (with our unique CN02Y/CN20Y ratio displayed by the green trend-line) affect Bitcoin's (BTCUSD) Cycles:
It is however the first time we add stocks (S&P500 with the blue trend-line) in the mix. We can see the Cyclical behavior of the bond yields ratio as illustrated by the Sine Waves. Every time it bottoms, BTC and stocks bottom as well and start a cyclical rally. Additionally, you can see how the ratio has been on a Channel Down for the past 10 years, supporting the bullish expansion on both Bitcoin and the stock market.
Since the bond yields ratio is already rallying hard with BTC/ stocks following, do you think that this is just the beginning? Feel free to let us know in the comments section below!
-------------------------------------------------------------------------------
** Please LIKE 👍, FOLLOW ✅, SHARE 🙌 and COMMENT ✍ if you enjoy this idea! Also share your ideas and charts in the comments section below! **
-------------------------------------------------------------------------------
💸💸💸💸💸💸
👇 👇 👇 👇 👇 👇
BITCOIN The next leg up can reach $40000Bitcoin (BTCUSD) continues to follow the pattern of February - June 2019. The consolidation on the Higher Lows 1 has now been succeeded by a consolidation on Higher Lows 2. On June 10 2019 that started the final rally, roughly symmetrical to the one that took the price from Higher Lows 1 to Higher Lows 2 (+75%), to the HKEX:13900 peak.
If BTC continues to replicate this, then the current Higher Lows 2 should give way to a +48% rise that can take the price to $40000.
Is this how high the next leg up can go? Feel free to let us know in the comments section below!
-------------------------------------------------------------------------------
** Please LIKE 👍, FOLLOW ✅, SHARE 🙌 and COMMENT ✍ if you enjoy this idea! Also share your ideas and charts in the comments section below! **
-------------------------------------------------------------------------------
💸💸💸💸💸💸
👇 👇 👇 👇 👇 👇

Will Bitcoin drop to $1,000 check ithello traders what do you think on bitcoin this is on monthly chart .many are expecting it to a 100k of course the fundamentals hold the prediction when it comes to long term than the technical but still for any market to be efficient it need to balance the book what is your thought on it let me know in the comment .
