BEAR TRAPThis could be a huge bear trap setup right here just like 2019.
The SPX500 holding support nicely for now , even though we are hours away from opening yesterday close was pretty good .
If we remain in this ascending channel it would be the final flush out before the next leg.
Lets not forgot the higher timesframes are looking good ,
contracting histogram momentum to the upside .
The legendary hash ribbon buy signal with crazy hit rate.
If we break this ascending channel the 2019 playbook goes out the window and we go back to the charts see what we can find but until then , setup for a long ,could take a week to build divergence.
Bitcoinsignals

BITCOIN is about to explode as GOLD/DXY is leading the rally!This is Bitcoin (BTCUSD) on the 1W time-frame against the Gold/DXY ratio. As you see, since 2016 the Gold/DXY ratio has been a leading indicator to BTC's trend on the long-term, filtering out what's needed.
In the last two Cycles, the ratio bottomed out first before BTC, broke above its Bear Cycle Support and posted a Bull Flag before BTC and topped before BTC. At the moment the ratio just broke above its Bull Flag, while BTC is rising too and will have a crucial week, attempting its first 1W candle closing above the 1W MA50 (blue trend-line).
We have claimed for weeks on our channel that Bitcoin is currently in the same symmetrical level it was in April 2019. A closing above the 1W MA50 would validate this and set a short-term target on the Bear Cycle Support around $29000 and then pursue our longer term targets.
Do think that the Gold/DXY ratio is the leading indicator for Bitcoin's new rally? Feel free to let us know in the comments section below!
-------------------------------------------------------------------------------
** Please LIKE 👍, FOLLOW ✅, SHARE 🙌 and COMMENT ✍ if you enjoy this idea! Also share your ideas and charts in the comments section below! **
-------------------------------------------------------------------------------
💸💸💸💸💸💸
👇 👇 👇 👇 👇 👇

Bitcoin- Back above support. I'm not bullish thoughAfter the recent high at 25k, bitcoin has started to drop and last week it also fell below the support level in the 21k area.
However, this was a short-lived spike and now the price is back above again.
Although technically this could be an indication of reversal, with the problems from the financial market, I don't expect much continuation to the upside.
A new drop under 21.500 would put strong selling pressure on the price and 18k support zone could be bears target.
I'm looking to sell

CME gap closedCME gap now has been closed , next area im looking at would be 18k , that breaks things going to get crazy.
Most likely we will be a boring market rest of month , dont expect any major crashes till end of june 2023

BITCOIN Huge Inverse H&S bottoms and targets $41300!Bitcoin (BTCUSD) hit its 1D MA200 (orange trend-line) for the first time since January 13, which was half-way through the first rally of the new Bull Cycle. The long-term pattern since the November 21 2022 bottom can be seen as a big Inverse Head and Shoulders (IH&S) that has started to form the Right Shoulder. The short-term Resistance is the 1D MA50 (blue trend-line) and the pattern's core Resistance is 25250, which has rejected two tops already (August 15 and February 16, 21).
Right now the price hit the Bear Cycle's Lower Highs trend-line, which broke upwards on January 20 and confirmed the new Bull Cycle. Along with the 1D MA200 they form a formidable Support Cluster, with the IH&S neckline being a little lower at 18150. This is also where the Higher Lows trend-line that started on the November 21 bottom is located at. That is the second and final Support Cluster. The 1D RSI is below the oversold barrier of 30.00 and has a Support at 20.50. Being also on Higher Highs, this is a Triangle pattern.
The technical target on the IH&S is the Fibonacci 2.0 extension, measured from the Head of the pattern to its Resistance (+63.17%). That gives a $41300 Target.
Are you long on this one? Feel free to let us know in the comments section below!
-------------------------------------------------------------------------------
** Please LIKE 👍, FOLLOW ✅, SHARE 🙌 and COMMENT ✍ if you enjoy this idea! Also share your ideas and charts in the comments section below! **
-------------------------------------------------------------------------------
💸💸💸💸💸💸
👇 👇 👇 👇 👇 👇

BITCOIN Can this wick keep the 2019 fractal alive?Bitcoin (BTCUSD) is not having the best 3 week stretch as it broke below its 2 month Channel Up. The April 2019 fractal, that has drawn widespread comparisons with the current price action recently, broke its Channel Up on a 1D candle wick, hit the Support made off the 1st Low and rebounded. Once the MACD formed a Bullish Cross, the next bullish wave started.
Today's pattern (on 2D) has the Support of the 1st Low at 20500, a little above the MA50 (blue trend-line). Is this the last resort keeping the the 2019 fractal alive or totally irrelevant in your opinion? Feel free to let us know in the comments section below!
-------------------------------------------------------------------------------
** Please LIKE 👍, FOLLOW ✅, SHARE 🙌 and COMMENT ✍ if you enjoy this idea! Also share your ideas and charts in the comments section below! **
-------------------------------------------------------------------------------
💸💸💸💸💸💸
👇 👇 👇 👇 👇 👇

BITCOIN Hidden Inverse Head & Shoulders pattern points to $165k!As Bitcoin (BTCUSD) is battling to break its 1W MA50 and extend the rally of the new Bull Cycle, as all previous Cycles did, we looked at the 1W time-frame from a different angle and present to you an outlook that may have gone overlooked.
As you see, every BTC Cycle Bottom can be viewed as the Head of a giant Inverse Head and Shoulders (IH&S) pattern. The first two Cycles topped on the 3.0 Fibonacci extension counting from the 0.786 retracement level of the previous Cycle's top-to-bottom. The most recent Cycle topped on the 2.0 Fibonacci extension.
As you see an uncanny constant on all Cycles so far is that the first High coming out of the Bear Cycle (that gives a pull-back that breaks below the 1W supertrend indicator) has always reached (or almost) the 0.786 Fib of the previous Cycle's Top. Assuming that is the completion of the Right Shoulder of the IH&S pattern, we measure the Fibs from the bottom and end up with the 3.0 Fib extension Top on the first two Cycles and the 2.0 Fib Top on the third (previous) Cycle.
A repeat of the moderate 2019 - 2021 Cycle to the 2.0 Fib extension gives as a projected Top for the current Bull Cycle at $165000! Do you agree that this is realistic in the next 2 years? Feel free to let us know in the comments section below!
-------------------------------------------------------------------------------
** Please LIKE 👍, FOLLOW ✅, SHARE 🙌 and COMMENT ✍ if you enjoy this idea! Also share your ideas and charts in the comments section below! **
-------------------------------------------------------------------------------
💸💸💸💸💸💸
👇 👇 👇 👇 👇 👇

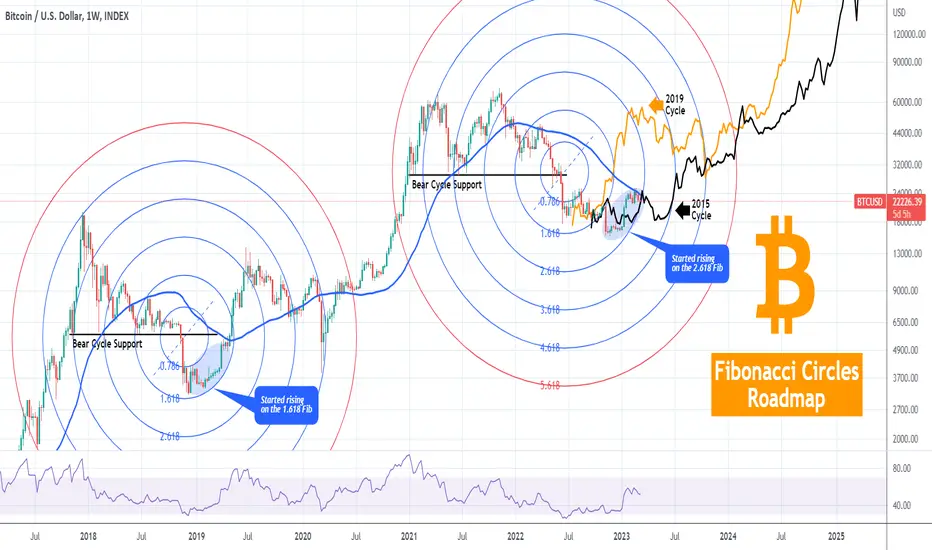
BITCOIN A Fibonacci Circles Roadmap you've never seen before!This is a unique representation of the Bitcoin (BTCUSD) Cycles using the Fibonacci Circles, a tool than certainly prints a very interesting Roadmap relative to the previous historic Cycles. The chart focuses on the last two Cycles but for a more complete projection we also incorporate 2015 - 2017.
Each Cycle's epicenter is located on the candle that breaks and closes below the horizontal Bear Cycle Support. The 2022 Bear Cycle bottomed on the 2.618 Fib extension while the 2018 Bear Cycle started rising on the 1.618 Fib. It is no coincidence that the current struggle on the 1W MA50 (blue trend-line) is done exactly on the 2.618 Fib as in April 2019, the same 1W MA50 struggle was done on the edge of Fib 1.618. The symmetricity between the Cycles is striking indeed. In that regard, the current Bull Cycle appears to be more similar with the 2015 -2017 Bull Cycle as its 1W MA50 struggling was also made on the 2.618 Fib. That Cycle didn't really start rising before hitting Fib 3.618 as you can see on the chart below:
We have plotted both of those two past Cycles on the current Bull Cycle, based on which Fib they bottomed. As you can see the representation offers valuable insight as to how the current Cycle may evolve. It is very likely to see a pull-back to Fibonacci 3.618 before the 1W MA50 finally breaks and starts the real Bull Cycle rally.
Do you think that's a realistic scenario or the next Cycle Fib will be breached at a much higher (than the current) level? Feel free to let us know in the comments section below!
-------------------------------------------------------------------------------
** Please LIKE 👍, FOLLOW ✅, SHARE 🙌 and COMMENT ✍ if you enjoy this idea! Also share your ideas and charts in the comments section below! **
-------------------------------------------------------------------------------
💸💸💸💸💸💸
👇 👇 👇 👇 👇 👇
BITCOIN Moment of truth to confirm or dismiss the 2019 fractal!There has been tons of talk about Bitcoin's (BTCUSD) similarity of the current bottom reversal with the 2019 one. A lot of comparisons have been made, we've started doing that since November, but the time has come that BTC either confirms or dismisses the 2019 fractal.
As you see on the left chart (2023) the consolidation within the Bullish Megaphone that Bitcoin has been trading in for the whole month of December is naturally creating an RSI Bearish Divergence due to the aggressive January rally. We can see the very same formations in 2019 (right chart), with the RSI supported by a Higher Lows trend-line. The time-frames are different (3D against 2D) to account for the fundamental noise and serve better the purpose of comparison.
The market has now no other choice but to make its move by either validating the 2019 fractal by breaking above the orange trend-line or negating it and end the comparison discussions once and for all.
What do you think the market has in store for us? Feel free to let us know in the comments section below!
-------------------------------------------------------------------------------
** Please LIKE 👍, FOLLOW ✅, SHARE 🙌 and COMMENT ✍ if you enjoy this idea! Also share your ideas and charts in the comments section below! **
-------------------------------------------------------------------------------
💸💸💸💸💸💸
👇 👇 👇 👇 👇 👇

WATCH THIS before BUYING BitcoinEnjoy the video. Have a good week.
☝️Disclaimer: ALL ideas here are for EDUCATIONAL and MARKETING purposes only, not a financial advice, NOT A SIGNAL. I share my view on the market and search for like-minded traders. YOUR TRADES ARE YOUR COMPLETE RESPONSIBILITY. Everything here should be treated as trading in a simulated environment.

BITCOIN The Channel Up is holding perfectly. $26300 next Target.Bitcoin (BTCUSD) completed a strong drop yesterday on session's close but that technically reached the bottom (Higher Lows trend-line) of its 1.5 month Channel Up pattern. As with the previous Higher Low drop, the price completed a -12% decline. The 4H RSI is replicating a similar pattern to that previous drop and broke below the 30.00 oversold barrier as it did on February 09.
** Death Cross and rise to $26300 **
A slightly more drop is possible to make a perfect touch on the Channel's bottom but if you see the 4H RSI rising, that would be a sign of buying accumulation at the bottom. On February 14, a 4H Death Cross sealed the bottom and was the last Buy Signal before the +18.25% rally to the Channel's top (Higher Highs trend-line). We are probably half a day before a new 4H Death Cross, thus we are already buying in expectation of a new +18.25% Higher High rise. Our medium-term Target is 26300.
** The importance of the 1W MA50 **
However we will keep an eye on the 1W MA50 (red trend-line) which is key for Bitcoin on the long-term. If the price fails to close a 1W candle above it, much like it did in mid-February, we will book the profit earlier and consider a pattern change.
-------------------------------------------------------------------------------
** Please LIKE 👍, FOLLOW ✅, SHARE 🙌 and COMMENT ✍ if you enjoy this idea! Also share your ideas and charts in the comments section below! **
-------------------------------------------------------------------------------
💸💸💸💸💸💸
👇 👇 👇 👇 👇 👇

Bitcoin IdeaBitcoin Idea | BTCUSDT | BTCUSD
✅ ✅ Risk warning, disclaimer: the above is a personal market judgment and analysis based on published information and historical chart data on The trading view,
And only some of these analyzes are my actual real trades.
I hope Traders consider I am Not responsible for your trades and investment decision.

BITCOIN - resistance on month- key level of the monthly candlestick
- Opening weekly candlestick today
- A good time to enter the trade
if you like the idea, please "Like" it. This is the best "Thanks!" for the author 😊 P.S. Always do your own analysis before a trade. Put a stop loss. Fix profits in installments. Withdraw profits in fiat and please yourself and your friends.

BITCOIN Limited by the weekly candle body Resistance.Many have been focusing in the past days at the inability of Bitcoin (BTCUSD) to close above the 1W MA50 (blue trend-line). Surely that is essential for maintaining the pace of the January - February rally and as we've analyzed recently, it draws comparisons with the past Cycles where they were testing their own 1W MA50.
** Resistance/ Support levels based on the 1W candle closing **
Another, overlooked for sure, aspect on the 1W time-frame the Resistance/ Support levels enforced by the 1W (weekly) candle closings. As you see on this chart, BTC not only failed to close (despite breaking it) above the 1W MA50 in the previous 2 weeks but also failed to close those candles above the 24360 Resistance which has been formed since the weekly candle of July 18 2022. As you see no candle closed above that Resistance level in July - August and the recent failures certainly show its importance. The same can be said about the 1W candle body Support at 18750, which held all weekly closings above it from June until the FTX crash.
** The Vortex Indicator **
As a result, a weekly close above 24360 will achieve a double bullish break-out as not only will it close above the 1W MA50 for the first time since April 25 2022 but also above the most important horizontal Resistance on the 1W time-frame. In order to keep things into a long-term perspective, we have added on this analysis the Vortex Indicator (VI), widely used in previous years, that has been on a Bullish Cross since mid-January. This shows that the new Bull Cycle has started and is still in its early stages.
** Projection **
It appears that even though they are not absolute, the Fibonacci retracement levels will play some part as Resistance levels in this new rally. Once BTC makes this double bullish break-out, we have the 1W M100 (green trend-line) as the next pressure level, hence potential Target and if the second part of the rally is as strong as January, it can make contact with the 1W MA100 around the 0.5 Fibonacci level, which is roughly at $32650.
So what do think? Is this 1W candle body Resistance the level to break? Feel free to let us know in the comments section below!
-------------------------------------------------------------------------------
** Please LIKE 👍, FOLLOW ✅, SHARE 🙌 and COMMENT ✍ if you enjoy this idea! **
-------------------------------------------------------------------------------
💸💸💸💸💸💸
👇 👇 👇 👇 👇 👇

Bump and long
So we forming a bump and run on a 4hour , inside a massive ascending channel and coming out of marco bump and run .
clock is ticking

BITCOIN 1 year left until the next Halving! Start to DCA!As we left February behind, few realize that there is only 1 year left for Bitcoin (BTCUSD) before the next Halving (no4) as it will experience this supply shock event in March 2024! This 1W time-frame, is a simple illustration of why it is still a good idea to start Dollar Cost Averaging (DCA).
** Similarities with past Cycles. 1W MA50 test **
We see a lot of similarities with past cyclical positioning on this date, particularly with the previous two Cycles. As you see 371 days (53 weeks) before their Halving events, both Cycle 3 on April 29 2019 and Cycle 2 on June 29 2015 were already on the 1W MA50 (blue trend-line) attempting to break it, but at the time failing to. This is exactly where BTC is at right now. This symmetry is uncanny. Needless to say that it doesn't hold on Cycle 1, which was much more aggressive, hence shorter.
** The 0.618 Fibonacci at the time of the Halving **
It is equally interesting to see that at the time of each Halving, the price was on or marginally above the 0.618 Fibonacci retracement level from the Cycle's bottom. In November 12 2012 it was at $12 (marginally above Fib 0.618), in July 04 2016 it was at $690 (little above Fib 0.618) while in May 04 2020 it was at $10000 (exactly on Fib 0.618). This model suggest that if Bitcoin is trading again at least on its 0.618 Fib at the time of Halving 4 (March 2024), then it will be around $40000. Whether it breaks this level earlier and then retreats back to it, this projection doesn't associate with, it simply suggests where it could be at the time of Halving 4.
Do you think we will be at $40k then by March 2024? Feel free to let us know in the comments section below!
Please LIKE 👍, FOLLOW ✅, SHARE 🙌 and COMMENT ✍ if you enjoy this analysis!

Long Trade Bitcoin Straight forward triangle here , wait for 4hour to close above resistance line , with a breakout in volume aswell.
Stop loss- 23100
4h RSI coiling up and creating divergence.

BITCOIN Breakthrough Fibonacci Grid mapping the new Cycle!This is a unique analysis of Bitcoin displayed on a grid pattern made of the Fibonacci retracement levels (black trend-lines) applied from the top of the previous Bull Cycle to the bottom of the Bear Cycle and the Fibonacci extension levels (blue trend-lines) applied on the Lower Lows and Lower Highs of the Bear Cycle.
Using the Symmetrical Pivots as the new Resistance levels/ gaps to be filled, we have mapped a potential course using those as targets on Bitcoin's way to reach its $69000 All Time High by Halving 4 (March 2024).
Can that be useful in identifying potential volatility zones and mapping a course on this Bull Cycle that has just started? Feel free to let us know in the comments section below!
-------------------------------------------------------------------------------
** Please LIKE 👍, FOLLOW ✅, SHARE 🙌 and COMMENT ✍ if you enjoy this idea! Also share your ideas and charts in the comments section below! **
-------------------------------------------------------------------------------
💸💸💸💸💸💸
👇 👇 👇 👇 👇 👇

BITCOIN The Fear & Greed Index prompts to an immediate rally!On this chart, Bitcoin (BTCUSD) is shown on the 1W time-frame using the Fear & Greed Indicator (F&GI). A month ago it broke above 50, which is the neutral level between Fear and Greed. Since then it has stabilized sideways around 55 as the market is split with some being greedy for further rise while others waiting for a good pull-back to enter.
Historically however, every time the F&GI broke above 50, the Cycle bottom was in and BTC was at the beginning of an aggressive rally. In both of the previous 2 Cycles, the immediate target before a mid-Cycle pull-back was the 0.786 Fibonacci (green flag). This level on the current Cycle is at $50000!
Do you think this will be next? Feel free to let us know in the comments section below!
-------------------------------------------------------------------------------
** Please LIKE 👍, FOLLOW ✅, SHARE 🙌 and COMMENT ✍ if you enjoy this idea! Also share your ideas and charts in the comments section below! **
-------------------------------------------------------------------------------
💸💸💸💸💸💸
👇 👇 👇 👇 👇 👇

Bitcoing reached yet another DAILY DEMAND. Still long.Hey traders,
After recent shifts in the BTC structure, I've posted my thoughts of what structure might develop next. Please check linked ideas you can find on the chart for more context.
Right now looking for deeper mitigation and then continuation long.
The protected low (point of invalidation) is in the chart as well.
Any questions are welcomed.
Keep it strong!

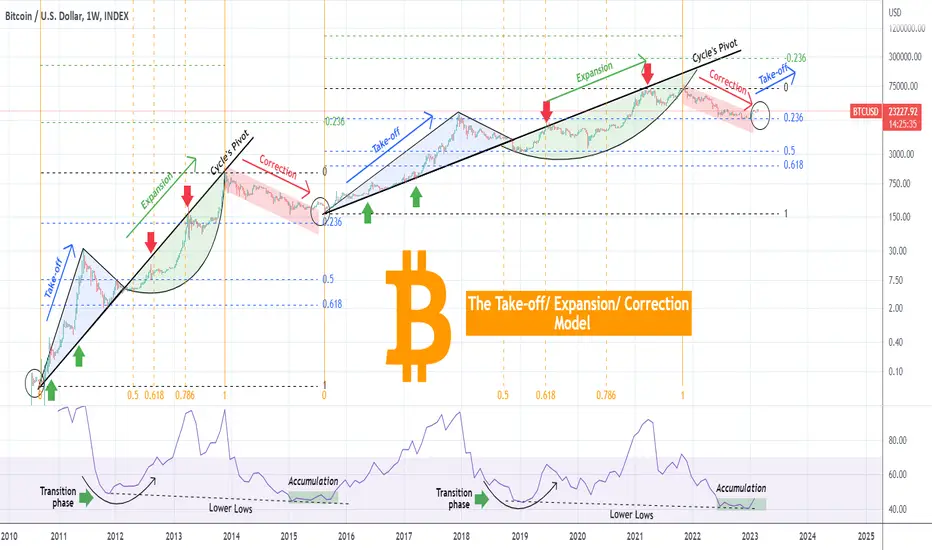
BITCOIN Three Ph-Model started a new mega Cycle. $280k possible?This is a very radical approach to Bitcoin's (BTCUSD) Cycle Theory as it expands on the notion that BTC has so far had only two (mega) Cycles instead of the traditional view of four (smaller ones), which is an idea we have analyzed quite a few times in the past. Radical but as the analysis shows not unrealistic, since each Cycle shares common parameters with the other one that haven't been broken.
** The Pivot line and the Three Phases **
As this 1W chart shows, each Cycle has a Pivot trend-line, which is the essence of the model as it is the piece that is holding together the three different Phases. Those (mega) Cycles start with the Take-off phase (blue Triangle), a rally which is the most aggressive part of the Cycle. The Pivot line is the Support during the Take-off Phase.
Then with the 1W RSI curving, it transitions to the Expansion phase (green Arc), which is also rally but less aggressive that eventually forms the top of the Cycle. The Pivot line is the Resistance during the Expansion phase.
The third and final phase starts after the Cycle top, the Correction phase (red Channel Down), which is the pull-back of those tow rally phases that finds Support on the 0.236 Fibonacci retracement level. Towards the end of Correction phase, the 1W RSI almost flattens as it turns sideways at the lowest level of this three-phase Cycle. This is the Accumulation period where investors start buying Bitcoin again on those low prices.
** Fibonacci levels **
Apart from the horizontal Fibonacci levels, the most important of which is the 0.236 Fib that offers Support on the Correction phase, we have incorporated the Time Fibs that assist at providing a better perspective as to which part of the Cycle we could approximately be at. As you see, between Fib 0.5 - 0.618, the Expansion phase's first rally starts and after Fib 0.786 the final rally of the Expansion phase takes place.
Based on this model, Bitcoin is on Level Zero (circle) which is the starting point of the Take-off phase, meaning that we are starting the Third ever Mega Cycle.
As for what the top of this new Take-off phase might be? The December 2017 top of that Take-off phase was marginally above the -0.236 Fibonacci extension of the Cycle before it. The new -0.236 Fib is around $280000.
Do you agree? What are your thoughts on that? Feel free to let us know in the comments section below!
-------------------------------------------------------------------------------
** Please LIKE 👍, FOLLOW ✅, SHARE 🙌 and COMMENT ✍ if you enjoy this idea! Also share your ideas and charts in the comments section below! **
-------------------------------------------------------------------------------
💸💸💸💸💸💸
👇 👇 👇 👇 👇 👇
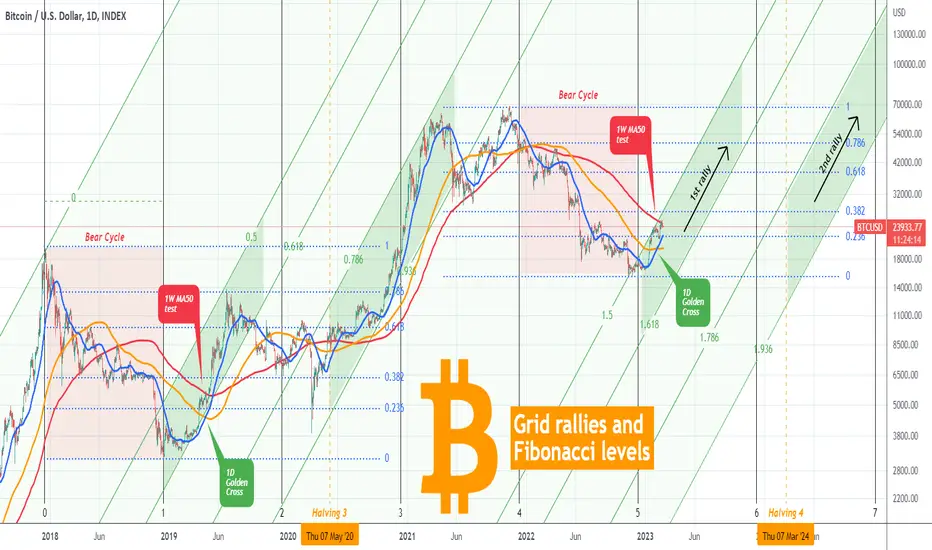
BITCOIN Radical Grid Fibonacci analysis you've never seen beforeAs Bitcoin (BTCUSD) has taken a short-term paus on its early 2023 rally on the 1W MA50 (red trend-line), following the first Golden Cross on the 1D time-frame since May 2020, we naturally go back to the start of the previous Bull Cycle in 2019 to see how it behaved on this important stress test.
** The 2019 Bull Cycle **
As you see, BTC also took a sideways pause on its 1W MA50 in April 2019, also after a 1D Golden Cross, while being above the 0.236 Fibonacci retracement level (blue dotted trend-lines) of its Cycle High. So far the current Cycle with 2019 are identical.
** The Channel Fibonacci levels **
We decided to take this symmetry a step forward in order to get a better understanding of how the new Cycle may play out. We have applied the Fibonacci Channel (green trend-line) starting of course from the December 2017 High. As you see, the Cycle's 1st rally, which is what we are experiencing now, firmly traded within the 0.5 - 0.618 Channel Fibonacci levels (green) before getting rejected on the 0.786 horizontal Fib (blue). The Cycle's 2nd rally, which was the final and most aggressive part of the Bull Cycle, was within the 0.786 - 0.936 Channel Fibs (green).
** The Time Fibonacci levels **
Besides the Channel and horizontal Fibs, we have incorporated the Time Fibs (black vertical lines). Starting from the top of the previous Bear Cycle (December 2017) and ending at its bottom (December 2018), we see that it has more or less classified each part of the Cycle and even caught pretty well the next Bear Cycle, roughly within Time Fib 4.0 - 5.0.
Based on that model, the new Cycle's 1st rally should be within Time Fib 5.0 - 6.0 and the 2nd rally some time after Time Fib 6.0. It is widely known that the Halving events (supply shock for Bitcoin) is what officially start the final rallies. In 2020 that was in May and the next one (Halving 4) will be in March 2024.
** Conclusion **
Based on the above parameters put together, we are now experiencing Bitcoin's 1st rally of the new Bull Cycle, within Channel Fibs 1.5 - 1.618. The 2nd rally should start fundamentally after March 2024 (Halving 4), but technically it can do so if the price closes a 1D (or even better 1W) candle above horizontal Fib 0.786. By Time Fib 7.0, the market should have made a new All Time High (i.e. be above $69000) and by Time Fib 8.0 already place the new Cycle Top.
Do you agree with the projections suggested by this Fibonacci Grid Model? Feel free to let us know in the comments section below!
-------------------------------------------------------------------------------
** Please LIKE 👍, FOLLOW ✅, SHARE 🙌 and COMMENT ✍ if you enjoy this idea! Also share your ideas and charts in the comments section below! This is best way to keep it relevant, support us, keep the content here free and allow the idea to reach as many people as possible. **
-------------------------------------------------------------------------------
💸💸💸💸💸💸
👇 👇 👇 👇 👇 👇