BITCOIN It's blue-print is Gold and it is a bullish one.Bitcoin (BTCUSD) is displayed on this 1W chart alongside Gold (XAUUSD) by the black trend-line. The text will be short as the chart is pretty much self-explanatory.
Every time Gold breaks its Lower Highs trend-line, BTC is past its bottom and well into its Bull Cycle, starting an aggressive rally. Right now Gold is dangerously close to that Lower Highs trend-line, while Bitcoin is already posting an impressive rally this first month of the year.
If Gold breaks its trend-line again, will you take it as an additional signal that the new BTC Bull Cycle has officially started? Feel free to let me know in the comments section below!
-------------------------------------------------------------------------------
** Please LIKE 👍, FOLLOW ✅, SHARE 🙌 and COMMENT ✍ if you enjoy this idea! Also share your ideas and charts in the comments section below! This is best way to keep it relevant, support me, keep the content here free and allow the idea to reach as many people as possible. **
-------------------------------------------------------------------------------
💸💸💸💸💸💸
👇 👇 👇 👇 👇 👇
Bitcoinsignals

Bitcoin bounced just as expected, & Possible scenarios.$BTC bounced off the support just as expected and reached my first TP (take profit) at $23,800.
$BTC rejected hard and dumped very fast after reached the first TP unfortunately though, which was honestly unexpected.
After this current rejection, I have charted possible bearish scenarios, as well as the bullish scenarios of course.
I am still going to hold my long, but I will be cautious and might hedge a short, we will see.
$BTC is in for volatile times, personally I would not use high leverage during the volatility.
FOLLOW ME for accurate FREE Crypto analysis/signals!

BTC/USDT BINANCE Strong magnet pull from previous large support areas in the past.
Would be nice to tp @ 30k , and maybe correct from there.
Is the a relief rally or mini bull run.
A lot of opinions from both bulls and bears.
I stay in the middle perspective and see how we can learn from both sides.
These are only my opinions and isn't financial advice.
DYOR!
Thanks Like , Comment, and Follow for more ideas.

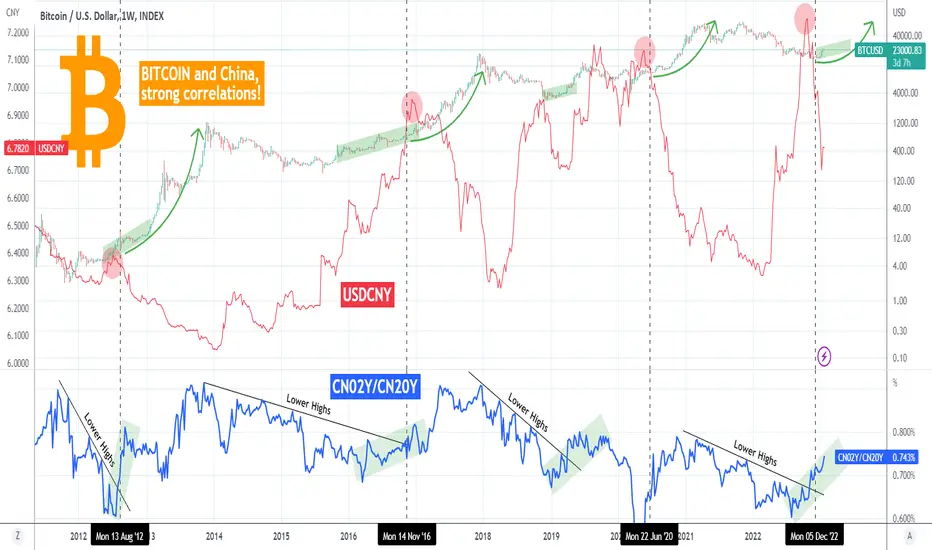
BITCOIN Yuan and China bond yields point to a mega rally!This is not the first time we emphasized the strong correlation of Bitcoin (BTCUSD) with Yuan (USDCNY) and the Chinese Bond Yields (CN02Y and CN20Y). We made an analysis right in the aftermath of the FTX crash, indicating why those indicators have all aligned, paving the way for BTC's new Bull Cycle.
As you see that happened and this time we incorporate the element of CN02Y/CN20Y. This shows that every time the ratio's Lower Highs broke in the past, Bitcoin started the first phase of the Bull Cycle. For shorter or longer periods, this was achieved within a Channel Up (green). Right now we have started the new one.
Adding the fact that every time the USDCNY topped and dropped as aggressively as it has been doing since October 24, Bitcoin has started the most aggressive part of the Bull Cycle, the parabolic rally.
This mix is incredibly bullish for Bitcoin technically and it prompts to a mega rally next, the likes of which we may have not seen in the past. Do you agree? Feel free to let me know in the comments section below!
-------------------------------------------------------------------------------
** Please LIKE 👍, FOLLOW ✅, SHARE 🙌 and COMMENT ✍ if you enjoy this idea! Also share your ideas and charts in the comments section below! This is best way to keep it relevant, support me, keep the content here free and allow the idea to reach as many people as possible. **
-------------------------------------------------------------------------------
💸💸💸💸💸💸
👇 👇 👇 👇 👇 👇
Bitcoin- It's imperative for bulls to keep 21k intactSince the beginning of the year, Bitcoin has entered a strong recovery move, and although I'm not so optimistic and don't see a sustained rise for the next 6 months or so, for me, as a speculator, doesn't matter much if the price of BTC will be 100k or 10k in the next 6 months. All that matter is where BTC's price will be next week.
And all I know is that, at this moment, the old 21k resistance should act as support now.
As I said, the price is very well sustained at this moment and, as long as we are above 21k, bulls hold the upper hand.
That being said, buying dips could be a good strategy if we target 25k and set a stop loss under 21k

Short Term Bitcoin longThe chart for $BTC is showing me many bull flags.
From the chart shown above, you can see a local breakout, Moving Average support is holding $BTC, and that RSI has lowered.
I have done much more analysis to back my long belief, special indicators of mine indicating it will go up among other fundamental and technical analysis.
Keep in mind $BTC is volatile these days so I advise being very careful and vigilant!
STOP LOSS: $22,180
TP1: $23,400
TP2: $23,600
TP3: $23,800
TP3: :$24,000
You may wonder, "Why have you not shared all your TA and other analysis?"
Well simply because the Fundamental side of it is quite long, and honestly I do not like showing all my TA tricks publicly on TradingView.
I also unfortunately cannot tell you where to go to see all my tips and tricks because TradingView will label it as self advertising lol.

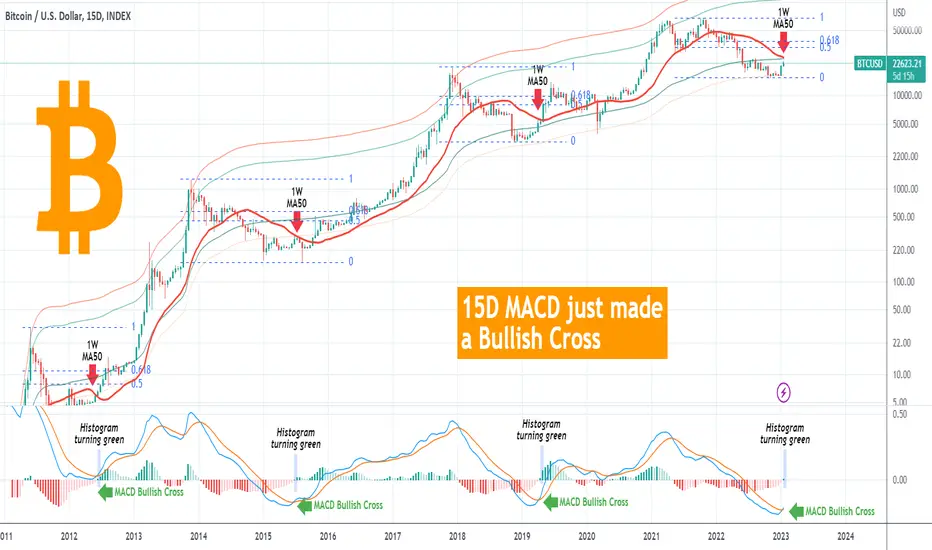
BITCOIN This is the Bullish Cross that will take it to $33kBitcoin (BTCUSD) just made a hugely important and unique Bullish Cross on its LMACD. Those who follow us regularly over the years, know that we like looking into assets (and Bitcoin in particular) from different time-frames that provide a more spherical overview of the market and the direction. This time we analyze the 15D chart as it just formed a Bullish Cross on its LMACD indicator.
This is a very rare pattern which below the 0.00 (LMACD) level has always formed straight after a Bear Cycle Bottom. Even during Bitcoin's first Cycle (2011/12) and the March 2020 COVID crash, the Bullish Cross was formed marginally above the 0.00 level.
Now the 1W MA50 (red trend-line) comes into the spotlight, as it is the Resistance to beat. Every 1W MA50 break following a 15D LMACD Bullish Cross, hit at least the 0.5 Fibonacci retracement level in a maximum of two weeks. We can make a case about the 0.618 Fib as well, which failed to get hit only marginally on October 28 2015.
As a result, with the 1W MA50 currently at 25615, we can expect another sharp 2-4 week rally once BTC breaks it, that will target at least the 0.5 Fib at $32900 with a riskier extension being the 0.618 Fib at $38900.
What do you think? Has this 15D LMACD Bullish Cross shaken your last bearish bias and if so, will you buy the 1W MA50 break-out confirmation? Feel free to let me know in the comments section below!
-------------------------------------------------------------------------------
** Please LIKE 👍, FOLLOW ✅, SHARE 🙌 and COMMENT ✍ if you enjoy this idea! Also share your ideas and charts in the comments section below! This is best way to keep it relevant, support me, keep the content here free and allow the idea to reach as many people as possible. **
-------------------------------------------------------------------------------
💸💸💸💸💸💸
👇 👇 👇 👇 👇 👇
BITCOIN Transition from a Wedge to an Inverse H&S showing 33.5k?Bitcoin (BTCUSD) is up +40% since the start of the year and did so by breaking above its former Falling Wedge pattern that was holding since the June 18 2022 Low. On this 1D time-frame, we see that there is a high probability of the Wedge break-out to transition BTC into the next pattern that could be an Inverse Head and Shoulders (IH&S).
Such patterns are technically market bottom formations and initiate sharp recoveries. Right now the price is forming the Right Shoulder and could range within it as it did on the Left Shoulder. The rise after the completion of the Head until Saturday's High is around +44%. After BTC breaks above its Right Shoulder, we can measure another +44% to find out the target of the IH&S pattern. At the moment that is a little over $33500.
By the time it reaches that level, it may coincide with a test of the all important 1W MA100 (green trend-line), which has been the last long-term Support that Bitcoin broke on May 06 2022.
If you are looking for confirmation of this move, keep an eye on the potential 1D Golden Cross (blue 1D MA50 crossing above the orange 1D MA200) and a break above the 1W MA50 (red trend-line), which has been untouched since April 05 2022.
So what do you think? Will we hit $33.5k that fast after the Inverse Head and Shoulders break? Feel free to let me know in the comments section below!
-------------------------------------------------------------------------------
** Please LIKE 👍, FOLLOW ✅, SHARE 🙌 and COMMENT ✍ if you enjoy this idea! Also share your ideas and charts in the comments section below! This is best way to keep it relevant, support me, keep the content here free and allow the idea to reach as many people as possible. **
-------------------------------------------------------------------------------
💸💸💸💸💸💸
👇 👇 👇 👇 👇 👇

BITCOIN ahead of 1st 1W Death Cross in history! End of rally?Bitcoin (BTCUSD) has started 2023 with a relentless +40% rally, completing a +50% rise from the November Low. But perhaps the biggest technical development of the upcoming days is the emergence of the Death Cross formation on the 1W time-frame. This is when the 1W MA50 (blue trend-line) crosses below the 1W MA200 (orange trend-line) and on Bitcoin in particular this will be the first such pattern in history.
It is inevitable and it will be formed in the next or 2 weeks maximum. Being a technically bearish formation, will it affect the price negatively and restore the bearish trend long-term? Well we need a examine a few more parameters in order to determine this.
** Up by 50% **
Like we said, BTC is up +50% from its November Low. Throughout in history, every time the price rose by +50% or more after hitting the 1W MA200, it was a Cycle bottom, with the exception of the January - March 2015 rise.
** The RSI > 60.000 factor **
The one condition however that when fulfilled, always indicates that the Cycle bottom is in, is when the 1W RSI breaks above 60.000 after hitting the 1W MA50. We can see that typically, those take place at the same time. The January 2020 break doesn't fall into that category as, not only did it take a once in 100 years event to crash the price (COVID lockdowns March 2020) but also BTC wasn't on a rally rebounding on the 1W MA200 (previous condition we set). As a result, the RSI > 60.000 is a Market Bottom rule.
** Where are we now? **
At the moment, the 1W RSI is at 56.520 and the 1W MA50 around 25620. As mentioned, we are in a peculiar spot, largely uncharted territory for Bitcoin ahead of this inevitable 1W Death Cross, as in addition this time the rebound is being done way below the 1W MA200 and not on it. However, a simultaneous RSI 60.000/ 1W MA50 break, being at more than +50% from the Low, checks all the boxes for being past a Cycle Bottom, effectively starting the 1st rally of the new Bull Cycle.
Do you think the 1W Death Cross has the power to eventually invalidate the Bull Cycle? Feel free to let me know in the comments section below!
-------------------------------------------------------------------------------
** Please LIKE 👍, FOLLOW ✅, SHARE 🙌 and COMMENT ✍ if you enjoy this idea! Also share your ideas and charts in the comments section below! This is best way to keep it relevant, support me, keep the content here free and allow the idea to reach as many people as possible. **
-------------------------------------------------------------------------------
💸💸💸💸💸💸
👇 👇 👇 👇 👇 👇

Bitcoin- Still bullish potential on short termLast week, Bitcoin has also broken above 21k resistance and accelerated to 23.5.
The bullish momentum for Bitcoin and all the crypto market is intact and we can have a rise to 25k zone resistance.
At this moment 21k offers support and dips in this zone should be considered good buying opportunities

Elliot showing good signsAnother update on $BTC/$USDT coming into this you can expect either a rise to mid $23k or jiggle and go upward of $24.5k and or in those times drop down and potentially hit lows of $19k~ in most likely March April. Not advice finacial or otherwise! Feel free to discuss!

BITCOIN 33k seems inevitable next. This pattern always delivers.We talked yesterday about how beautifully Bitcoin's (BTCUSD) Adam and Even (A&E) pattern delivered a textbook short-term target at 21650:
We looked into such past occurrences more and discovered even more interesting clues for the immediate future. As this analysis shows, every Bear Cycle bottom has been formed on an A&E pattern (even the first Cycle in 2011 but on the current analysis we look into the 2014/15, 2018/19 and 2022/23 Cycles).
Following the A&E pattern and break above the 1D MA200 (orange trend-line), if no unexpected black swan event takes place (such as the FTX crash in November or the Bitfinex crash in August 2015), BTC can start a relentless rally, the first of this Bull Cycle, and if supported by the 1D MA50 (blue trend-line) can reach at least as high as the 0.5 Fibonacci retracement level as in October 2015 and May 2019.
Right now the 0.5 Fib is exactly at 32900. In 2015 it took the price 114 days and in 2019 82 days from the completion of the A&E pattern before reaching the 0.5 Fib. If we take the maximum 114 day extension as a projection, we can expect it to hit 33k by early May.
Do you think that is a realistic immediate target? Feel free to let me know in the comments section below!
-------------------------------------------------------------------------------
** Please LIKE 👍, FOLLOW ✅, SHARE 🙌 and COMMENT ✍ if you enjoy this idea! Also share your ideas and charts in the comments section below! This is best way to keep it relevant, support me, keep the content here free and allow the idea to reach as many people as possible. **
-------------------------------------------------------------------------------
💸💸💸💸💸💸
👇 👇 👇 👇 👇 👇

BTCUSD💥1H -TIMEFRAME ANALYSISBTCUSD💥1H-TIMEFRAME ANALYSIS
💗Hello ladies and gentlemen
This is my new idea for 💥BITCOIN
I hope my idea is clear
Support me by like and share thank you
Stay Safe💯💲💲💲
Good luck💰😍

BITCOIN's Adam & Even was spot on! What to look for next.Bitcoin's (BTCUSD) rise last week took many by surprise but what few noticed is that it basically made the theory into practice. The application of the Adam and Even (A&E) pattern that started forming since the November FTX crash went under the radar but was spot on with its target.
As you see Wednesday's peak wasn't just a consequence of the 21500 Resistance that was formed by the November 05 top but also completed a +18.00% rise from the December 14 High, which was a proportional rise (18%) from the November 21 Low. Like we said, the application couldn't have been more precise!
So what to look for right now? Well BTC is now sideways and about to test the 4H MA50 (blue trend-line) for the first time since January 06. A break can seek the 4H MA200 as its last Support. You should look for confirmations that will either lead to that correction or the extension of the rally.
First keep an eye on the 4H MACD. A Bullish Cross will be a signal to buy into round 2 of the rally. The 4H RSI has a clear Higher Lows trend-line as its Support and a Lower Highs trend-line is leading it there. A break above the Lower Highs earlier, will again be a buy signal.
-------------------------------------------------------------------------------
** Please LIKE 👍, FOLLOW ✅, SHARE 🙌 and COMMENT ✍ if you enjoy this idea! Also share your ideas and charts in the comments section below! This is best way to keep it relevant, support me, keep the content here free and allow the idea to reach as many people as possible. **
-------------------------------------------------------------------------------
💸💸💸💸💸💸
👇 👇 👇 👇 👇 👇

Bitcoin under wedge's support. High probability correctionAfter it soared last week, Bitcoin started to consolidate and although tried new highs, couldn't keep gains, and the price action was contained in a small rising wedge.
Yesterday the cryptocurrency has broken and rising support trend line and this could be an indication of a correction.
For a short term trade, I'm looking to sell rallies

BITCOIN The Bollinger Bands delivered when no-one expected!Exactly 2 months ago right after the FTX aftermath, we posted an alternative analysis using a not so popular indicator, the Bollinger Bands Width (BBW):
For a broader perspective, that was in combination with the Fib MAs as the MA350 (green trend-line) offered Support. As this held and the BBW rebounded, we mentioned then (which was a time of fear and panic in the market) that this was a sign of a bottom formation, similar to all prior Cycles (indicated by the circles).
The BBW delivered this beautifully and now Bitcoin has broken all the Bear Cycle Resistances and has technically entered its new Bull Cycle.
This time we add a few extra elements to the BBW. Number (2) is where the BBW starts to rise and picks, which officially starts the first rally of the Cycle. This means that you should keep an (very) close eye to the BBW in the next few weeks, as a potential surge will be the 2nd best buy entry that the new Bull Cycle will offer.
Are you waiting for this or any other signal to buy or are have you already in? Feel free to let me know in the comments section below!
-------------------------------------------------------------------------------
** Please LIKE 👍, FOLLOW ✅, SHARE 🙌 and COMMENT ✍ if you enjoy this idea! Also share your ideas and charts in the comments section below! This is best way to keep it relevant, support me, keep the content here free and allow the idea to reach as many people as possible. **
-------------------------------------------------------------------------------
💸💸💸💸💸💸
👇 👇 👇 👇 👇 👇

Bitcoin- Temporary top in place?After the strong rise from last week and the top made on Sunday, Bitcoin started to consolidate.
The price action from the last 3 days is a rising wedge and this pattern can be the signal for a correction.
On the other hand, a clear break above 21500 could lead to a new up acceleration.
Anyway, from my speculative point of view, only a buy at 19k zone would make sense

BITCOIN Three mega rally indicators flashing green all at once!This is not the first time we look at Bitcoin (BTCUSD) on the 3D chart , but it is the first time that three major trend indicators all give a big long-term buy signal at the same time:
1) The Super Trend indicator, which we have used extensively to maintain perspective during the Bear Cycle, just waved a green flag for the first time since December 2021.
2) The price broke inside the Ichimoku Cloud for the first time since December 27 2021.
3) The Mayer Multiple broke above its MA period for the first time since November 2021.
The last times all those indicators aligned their buy parameters at the same time was at the end of Bear Cycle bottom sequences, right before the first rally of the new Bull Cycle started: January 04 2012, July 09 2015, April 04 2019 (note Mayer MA data don't data before September 2012)).
This mix of green flashes make up a strong buy signal for the long-term and the real question now is how aggressive this new first rally of the new Bull Cycle will be. Will it be as aggressive as April - June 2019 or February - August 2012 or less aggressive as August - November 2015?
Feel free to let me know in the comments section below!
-------------------------------------------------------------------------------
** Please LIKE 👍, FOLLOW ✅, SHARE 🙌 and COMMENT ✍ if you enjoy this idea! Also share your ideas and charts in the comments section below! This is best way to keep it relevant, support me, keep the content here free and allow the idea to reach as many people as possible. **
-------------------------------------------------------------------------------
💸💸💸💸💸💸
👇 👇 👇 👇 👇 👇

BITCOIN rhymes perfectly with previous Cycle bottoms. 25k next!Bitcoin (BTCUSD) on Friday above its 1D MA200 (orange trend-line) for the first time since December 31 2021, which is the level we have rendered all this time as the one that will start the new Bull Cycle. On this analysis on the 1D time-frame, we compare BTC's current Cycle bottom to those of 2018/19 and 2014/15.
As you see, during those Bottoms, when the price broke above the 1D MA200, it quickly hit the 1W MA50 (red trend-line) within 3-4 weeks, always having the 1D MA50 (blue trend-line) as Support. On the April 02 2019 1D MA200 break-out in particular, the 1D RSI hit the 89.00 level before retracing, just as it did today. These RSI retracements don't indicate trend reversals, just a re-balancing of the enormous buying pressure.
It is interesting to add that on both previous bottoms, the 1W MA50 was hit on a Resistance level (red zone) made by a previous Lower High during the Bear Cycle. This time the strongest candidate for this level appears to be 25300 (August 15 2022 Lower High).
What could happen after that? Well, as long as the 1D MA50 supports, Bitcoin can continue the rally past the 1W MA50, as it happened in May-June 2019. A break below the 1D MA50 though, could deliver one last major pull-back to the 19k-20k or even 17k supply zones, similar to what happened on August 2015.
Feel free to let me know in the comments section below!
-------------------------------------------------------------------------------
** Please LIKE 👍, FOLLOW ✅, SHARE 🙌 and COMMENT ✍ if you enjoy this idea! Also share your ideas and charts in the comments section below! This is best way to keep it relevant, support me, keep the content here free and allow the idea to reach as many people as possible. **
-------------------------------------------------------------------------------
💸💸💸💸💸💸
👇 👇 👇 👇 👇 👇

Bitcoin- New leg up- probable, FOMO- not advisableBitcoin reversed around 30% from November's low with more than 20% made this year, and I already see a lot of people calling for a bottom.
Indeed, this is a strong reversal, but calling for a bottom is a little early and, in my opinion, the economy is not out of the woods, by far.
Nevertheless, in short term, I'm strongly bullish and I expect a new leg up.
Yesterday, Bitcoin had an intraday correction and this could be it and a break above 21 could again accelerate gains to 23k.
However, from a speculator's point of view, a buy here is not making sense from a risk perspective
In conclusion, dips under 20k should be considered good buying opportunities, with a stop loss under 18k and a take profit around 23k

Bitcoin- Traders should be careful with buy trades nowPretty quickly my target of 21k was reached and, as explained on Monday's post, my trade closed in TP with 1:4 R:R.
My optimism from now on is very reserved though... Indeed, we have a higher low in place and Bitcoin is well above 18k support, however, the last 3 days are marked by an almost 20% rise and a correction could follow soon.
Technically speaking, above 21k is the resistance zone and from this zone, a correction could start.
Looking at a 1-hour chart we can see a small consolidation that resembles a small pennant, so a new high is not out of the question, but, as I said, if you are not scalping the market, in my opinion, is not worth the risk of a buy trade.
In conclusion, I will look to buy around 19k and if is not dropping there it can go "to the moon" without me:)

Bitcoin- 21k is callingHello traders,
As I was saying since the beginning of the year, I expect a rise from Btc in the first part of 2023.
Yesterday BtcUsd has broken above important 18k and now this level should act as support.
Buying dips in this zone could have a 1:4 R:R
Read my complete reasoning and my personal trade in Monday's post:

Financial Wave. BitcoinBitcoin.
After yesterday's rise of Bitcoin, our global markup changed from bearish to bullish. This is a good sign for BTC, maybe crypto winter is over, and a powerful rally awaits us soon. The short-term targets have also changed.
👉Our priority scenario in Bitcoin is the growth in wave 5 to 19699$. Before the growth, we allow a pullback in wave 4, but not below $17957, if the price goes lower, our scenario will change.
