BITCOIN / TETHERUSBitcoin has reached order areas as we have analyzed beforehand and this is probably its turning point and with the power that God willing to climb to previous peaks
Bitcoinsignals
BITCOIN The Double Bottom effect on Cycles. Huge rally starting?Bitcoin (BTCUSD) made a Low two days ago and today we are seeing a strong rebound on the biggest 1D candle (so far) since July 27. Based on the Cyclical Double-Bottom Effect, we can argue that this low is a hit on the Double Bottom zone of the June 18 market Bottom. What is that effect? Well it appears to be not just a Theory but a pragmatic phenomenon that has been seen on every Cycle bottom on Bitcoin's past three Cycles.
On this 1D chart, you can see the current Cycle on top of the previous ones for a more effective illustration of the Double-Bottom effect. The range of the Double-Bottom is the green zone. Cycle 1 is displayed with the black trend-line making the 2011 Double Bottom, Cycle 2 with the blue trend-line making the 2015 Double Bottom and Cycle 3 in the orange trend-line making the 2019 Double Bottom.
As it is shown, the Double Bottoms are fairly structured in the same way on each of the past Cycles and straight after each one was formed, a strong rally followed. The past cycles have been adapted in order to fit the Green Range, which is formulated by the current Cycle. Still, the bullish trend following each Double Bottom is obvious. This study isn't designed to show the time-length, but rather the bullish move that follows.
You can view each Double Bottom plotted on top of each other, with the current Cycle being the green trend-line, in the chart below:
So what do you think? Has the market double bottomed and if so, based on the above, are we about to witness a strong multi-month rally as the new Bull Cycle is starting? Feel free to share your work and let me know in the comments section below!
--------------------------------------------------------------------------------------------------------
Please like, subscribe and share your ideas and charts with the community!
--------------------------------------------------------------------------------------------------------

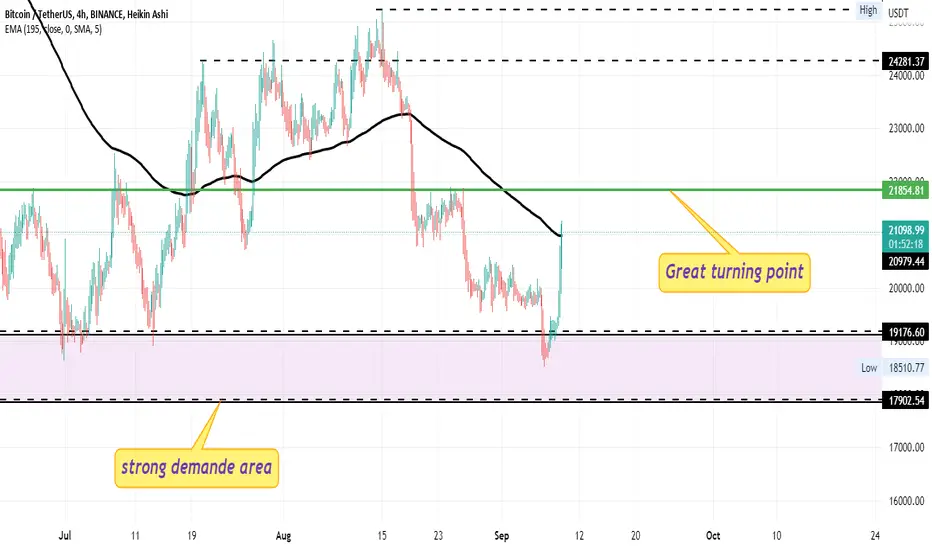
Bitcoin- Was the recent break a false one? Will it rise to 25k?Since the recent high at 25k and the break under the rising wedge, Bitcoin has fallen, but the drop is in steps, with tight lows, and is drawing a falling wedge.
All this for me suggests no selling power at this moment and bullish accumulation on levels.
The recent drop under 19500 support can very well be a false one and a break back above would confirm this outlook and give scope to continuation to at least 22k.
In the longer term, the price can even rise to 25k and swing traders can have a 1:4 R: R on their trades considering a stop loss under the recent low.

Bitcoin analysis and signalHey dear traders!
A trade signal for Bitcoin , in short term.
I will let you know the opening and closing times of my Trade.
in case of canceling this setup, I will quickly inform you in the comments.
---------------------------------------------------------
Bitcoin . BTCUSD
Please write any advice or suggestions.
Dear friends, request any cryptocurrency pair, currencies pair for forex, and any index that you want to be analyzed and ask any questions.
Thanks for your attention

BTC Long! - Support Needs to Hold for Double BottomBYBIT:BTCUSDT
BTC looking like printing possible Double Bottom. $17,600 needs to hold though.
Possible fake out to $16,400 for aggressive reversal.
However, if it's a Bearish Retest of $17,600 downside targets I am looking at are $16,400, $12,000, $10,000 "zones". Have a trading plan so that you can react and wait for entries at areas of value for quality trades.
If you liked this idea or if you have your own opinion about it, write in the comments.
The information and publications are not meant to be, and do not constitute, financial, investment, trading, or other types of advice or recommendations.

There is nothing else to say .There is nothing else to say .
We keep on doing the same things as last cycles , nothing has changed.
As i type this TA Bitcoin is hovering over the last golden ratio band just like last cycle after capitulation. This is by far the most boring part of the Bitcoin cycle , it seems like nothing is happening for so long but don't be fooled for a second because coming first week of October 2022 we will start the rally and Chainlink will lead.
Here are a few important TAs this year.
The most important one of all this year
The entire market is calling for a Bitcoin crash and a stock market crash , everyone is calling lower , everyone is expecting lower and what is most likely to happen regardless of all the "marco environment" news , war news , energy prices news , inflation news ,
is a rally to the upside....
or is everyone going to be right , is it going to be that easy playing the market and it crashes 50% and everyone wins?
Just think about it for a second what does every previous stock market crash have in common? Its simple , nobody expected it , your telling me that the entire market is a expecting lower prices and for once the market is going to be rational and go down with the herd?
Reality will set in for most when Bitcoin breaks 30k this year.

BITCOIN extends its bearish trend. Our options on the short-termBitcoin (BTCUSD) had yet another strong 4H red candle, consistent to the past two hard selling sequences since the August 15 High. Today's post is an extension to the short-term analysis we made a few days back.
** The selling patterns **
As mentioned, the time-frame here is the 4H (4hours). As you see, since the price broke above the former Triangle, it failed to stay above the 4H MA50 (blue trend-line) and eventually yesterday made that strong 4H sell-off. The common characteristic with the previous two selling patterns that were within the Triangle, is that it did so when the price broke above the Higher Lows trend-line (bold dotted lines) that was supporting until then.
** Fibonacci targets **
The target yesterday was once again the 1.618 Fibonacci extension as with the previous two sequences. If a new Higher Lows trend-line emerges, then in line with the previous sequences, we should be expecting an upwards consolidation that could reach the 1.236 Fib.
** The former Lower Highs trend-line supporting **
What's really interesting is that since BTC broke above the former Triangle, its Lower Highs trend-line has been tested twice (including yesterday) and held. Can that turn into a Support and provide a new trend? Well this is the short-term and we have to keep looking into it and the every-day changes on indicators continuously. If that former Lower Highs line breaks, expect another flash crash, this time to test the ultimate Support level of the 1W MA300 (yellow trend-line).
** Neutral zone, Break-out Buy and a very consistent RSI **
We consider the range within the 4H MA50 and the 4H MA100 (green trend-line) as neutral space, thus a 'no-trade zone'. On the other hand, consider buying if the price closes above the MA100 and target the 4H MA200 (orange trend-line).
Among the fuss, just check how well-structured the 4H RSI has been, with a clear Higher Lows line providing a solid buy entry and a Resistance providing a sell.
So do you think Bitcoin is up for yet another Higher Lows consolidation until it breaks downwards again or an MA100 break will save the day? Feel free to share your work and let me know in the comments section below!
--------------------------------------------------------------------------------------------------------
Please like, subscribe and share your ideas and charts with the community!
--------------------------------------------------------------------------------------------------------

Bitcoin- Dive after overnight spike up?Like EurUsd, Gold, and other assets, Bitcoin also had an overnight spike. However, this was anemic and very short-lived and after rising above the 20k zone we find Btc trading again at the 19700 zone at the time of writing.
As I said in my yesterday's analysis, I expect a break of 19500 support and a dive to the support given by the previous low.
Negation of this outlook comes with a daily close above 20.500 resistance.

BITCOIN Bullish Cross on MACD similar to the 2018/19 bottomBitcoin (BTCUSD) is about to form a Bullish Cross on the MACD (1D time-frame) as it trades below both the 1D MA50 (blue trend-line) and the 1D MA100 (green trend-line). The last time it did a similar formation on those levels while Bitcoin was recovering from a market low was on February 07 2019, during the December 2018 - March 2019 Cycle Bottom formation.
What followed was an instant price rebound which around 10 days it broke above both the 1D MA50 and 1D MA100 and a little after 2 weeks it tested the Bottom Fractal's Resistance. Once BTC broke above that Resistance it instantly broke above the 1D MA200 (orange trend-line) also and the Q2 2019 rally, the first of the previous Bull Cycle was already well underway.
At the moment it appears that we are exactly on that kick-start point, supported on the 12° angle Higher Lows trend-line, with the Supertrend indicator flashing red. Do you think that this emerging MACD Bullish Cross, can repeat the post February 2019 sequence? Feel free to share your work and let me know in the comments section below!
--------------------------------------------------------------------------------------------------------
Please like, subscribe and share your ideas and charts with the community!
--------------------------------------------------------------------------------------------------------

Bitcoin needs to decideThere are 8 days now with Bitcoin trading in a tight range of around 5% so the main cryptocurrency should decide its future direction sooner rather than later.
At this moment the levels of support and resistance are very clear at 19500 and 20500 respectively.
A break to the upside would expose the 22500 resistance and a break under 19500 would expose the recent low under 18k.
In my personal opinion, there is a higher probability of a down break with both strong USD and weak indices not being in a favor of an up move.

Making a million - stage 2!To make sure the project has order, it would be wise to dedicate a page for each stage of the project. Stage 2 is now in action: trading within a range of 600-1,500 USD. Accordingly, I will provide my TA on this page with entry and exit points until I move to the next stage. Let's start!

Making a million - swing trading and scalping!The goal of the project is to make 1,000,000 USD from 320 USD on futures. Using trading strategies the project will show mechanisms and nuances of the real intraday and medium-term trading in maximising opportunities and making profit. Place your bets, gentlemen! )
Foreword
I received an email from one of my exchange accounts, which frankly speaking I have completely forgotten about, that 320 USD in commission has been credited to my account by my broker. I have not worked with this broker for a long time due to personal preferences, however, I decided not to withdraw such an insignificant amount and instead turn it into a million dollars by trading it on futures.
What is my incentive?
I made my fortune a long time ago in stocks and forex. When trading futures, I used 1:20 leverage and a hefty deposit, which offered a moderate risk. The incentive in this case for me is to make a million dollars using 1:100 leverage and a small deposit. The risk in this instance is much greater and the amount is less - this is my interest! I also continue to trade my main assets in my other accounts using a similar strategy, but with minimal risk and trading long term.
Trading strategy
My trading style is swing trading. However, in the accumulation and distribution phases I will resort to scalping using 15M. My forecast of price movement is based on various patterns and analysis of trend, candles, volumes, figures and divergences. I confirm my entry and exit points using signals from numerous indicators and oscillators.
The probability of an making error, however, may still be present. Whatever one may say - it is still a market with a degree of uncertainty! Therefore, a careful risk management policy will prevail.
Trading criteria
Leverage =1:100
Stop Out = 50.00%
Main instrument = BTC / USD.
Alternative secondary instruments: Forex, Metals, Oil , Indices,
Timeframes = 15M - 1D
Project management
Technical analyses (TA) will be published under the heading "Making a million". In my TA, I will publish strategies with entry and exit points and keep records of Profit & Loss (PNL). Weekly statement of my balance - will be provided on this page on Sundays. If you are interested in keeping up with the progress, then consider adding this page to your favorites!
The plan for deposit's growth is divided into 15 stages:
1. 320 - 600 USD
2. 600 - 1,500 USD
3. 1,500 - 3,000 USD
4. 3,000 - 6,000 USD
5. 6,000 - 10,000 USD
6. 10,000 - 15,000 USD
7. 15,000 - 25,000 USD
8. 25,000 - 41,000 USD
9. 41,000 - 65,000 USD
10. 65,000 - 100,000 USD
11. 100,000 - 150,000 USD
12. 150,000 - 250,000 USD
13. 250,000 - 400,000 USD
14. 400,000 - 600,000 USD
15. 600,000 USD - 1,000,000 USD
Goal's achievement
I cannot predict how long exactly it is going to take to achieve my goal as a lot will depend on the dynamics and volatility of the market for the selected instruments. To get to a successful outcome, balanced decisions with minimal risks would need to be made. Therefore, there is no reason to rush.
Your participation in the project
I invite you to take part in this project in terms of observers or users! It should be quite an educative rally. It would be good to get your feedback including ideas and comments about "Making a million" project. I am in favour of running a forum format in which you can discuss mutual topics adhering to professional etiquette.
Please note
By providing my technical analysis in my articles, I do not encourage anyone to trade according to my strategies, because risk management and leverage are individual in every single case. Please be aware!
A kind request
Please do not publish any charts or technical analysis on this specific page. This page was created solely for the purpose of the project' presentation and its weekly reporting.
Contacts
I will much appreciate if you do send any PMs! I'm a trader, not an oracle. In my individual articles, however, I will be glad to receive your comments and support! Please be constructive when making your argument to keep it more productive for everyone.
My official content - is on this site!
Profitable trades to you and good luck in trading!
Though I am not aware, it is possible that someone else has already done or is doing a similar project. In any instance, it does not matter. I am doing a personal project the way I see fit and that's the beauty of it!
Start of trading: 10 May 2022 ‐ insignificant trading
Deposit amount: 319.94 USD
An idea for the project: 17 July 2022
______________
3 August 2022 = 968.50 USD (start date of online project and active trading)

BITCOIN Broke above the Triangle. Short-term set-ups to considerBitcoin (BTCUSD) broke above the August Triangle but still got rejected on the 4H MA50 (blue trend-line). This leaves us, on the short-term at least, inside neutral ground and it would be best to consider the following break-out set-ups for short-term trading.
Even in the event of a break above the 4H MA50, we still have to consider the important Resistance of the 4H MA100 (green trend-line), which rejected the price on August 18 and practically caused the first important sell-off since June. As a result, we consider the space between the 4H MA50 and the 4H MA100 as a no-trade zone. A break above the 4H MA100, would be a bullish break-out signal, targeting the 4H MA200 (orange trend-line).
On the other hand, a break below the Lower Lows trend-line of the former Triangle, would be a bearish break-out signal targeting the -0.5 Fibonacci extension.
Notice how so far the former Lower Highs of the Triangle stopped the September 02 sell candle and turned the price action sideways on a Higher Lows trend-line (black dots) similar to August 20 - 26. At the same time, the 4H RSI has been supported on Higher Lows but rejected on a horizontal Resistance, forming an Ascending Triangle.
Which short-term set-up do you think is more likely to prevail? Feel free to share your work and let me know in the comments section below!
--------------------------------------------------------------------------------------------------------
Please like, subscribe and share your ideas and charts with the community!
--------------------------------------------------------------------------------------------------------

DeGRAM | BITCOIN short Bitcoin formed a box after sell off.
Notice how price action is moving: extension, pause, and extension.
We expect further bearish move and break the box then retest the main support
-------------------
Share your opinion in the comments and support the idea with like. Thanks for your support!

Long Trade (BTC)God dam its like the end of the world right now in crypto , great time to long.
Everyone eye balling 12k ,all the elliott wave counts now go down to 12k apparently , haven't seen such bearish scenes since the covid crash , everyone is so sure 12k is on the table.
So we long here .
hash ribbon has spoken , cycle is repeating so far , this level breaks we make new lows it will be officially start on doing something it hasn't done before.

BITCOIN Short-term outlook doesn't look promising. Unless...This analysis is on Bitcoin (BTCUSD) on the 4H time-frame where we're looking on its short-term perspective. As you see since the August 15 High and the rejection on the 1D MA100 (red trend-line), the trend has been bearish and using the Fibonacci Channel with its extensions, better grasps the movement.
The price has been closing below the 4H MA50 (blue trend-line) since August 16 and the 4H MA200 (orange trend-line) since August 18. Every major drop (black arrows) was preceded by a Channel Up/ Bear Flag pattern, where sellers accumulated. It appears that we are in such a Flag currently that is about to break downwards. On top of that, BTC failed to break above the Lower Highs trend-line tha started on the August 15 High and last time that happened (August 26), the new drop happened. We are though very close to the Channel's Bottom (Lower Lows trend-line), which broke momentarily on Aug 28, so a new drop may target the -0.5 Fibonacci extension.
On the bull side, the 4H RSI has been on Higher Lows since August 19, also printing an Inverse Head and Shoulders pattern. A candle close above the 4H MA50 should be enough to accumulate buyers into targeting the 4H MA200 (orange trend-line). On the longer-term, only a weekly closing above the 1D MA100 seems capable to restore the bullish trend.
Also, consider this Higher Lows zone since June 30, illustrated by the dashed lines on the chart below (I didn't include this on the main chart to make it less messy):
Which direction do you think Bitcoin will follow? Break above the 1D MA50 or new drop? Feel free to share your work and let me know in the comments section below!
--------------------------------------------------------------------------------------------------------
Please like, subscribe and share your ideas and charts with the community!
--------------------------------------------------------------------------------------------------------

Bitcoin- Stuck in rangeAfter the Sundayțs low at 19500, Bitcoin has entered in a range between 19500 and 20500.
Yesterday, a new atempt of breaking down was quickly reversed and now the price is just under resistance again.
Considering the force of the reversal we can expect a break of resistance and acceleration to the next important level at around 22k
On the other hand, a break down would expose the previous low under 18k.
At this moment I m bullish Bitcoin and I m looking to buy dips against 19500

BITCOIN Recovering the 1D MA100 is key for $30000 as in 2019The trading set-up on Bitcoin (BTCUSD) since the June 18 low looks a lot like the price action that followed the December 15 2018 Bottom of that Bear Cycle. There is no need to overanalyze this as a simple comparison of the two charts of 2022 and 2019 would suffice.
As you see in 2019 when the price broke below the 1D MA50 (blue trend-line), it entered the final stage of Accumulation inside a Channel Down before the first rally of the new Bull Cycle. The pull-back was contained above the 0.786 Fibonacci retracement level. Once the price broke above the 1D MA50 but more clearly above the 1D MA100 (green trend-line), there was considerable buying accumulation that in just over one month broke also above the 1D MA200 (orange trend-line) to reach the 2.0 Fibonacci extension. This Fib is on today's set-up around 32700. The 1D MACD patterns so far are fairly similar. One more Bullish Cross on the MACD may confirm the bias to break above the 1D MA50 initially.
Do you think that as long as the 0.786 Fib holds and the 1D MA100 breaks, BTC can reach 32700? Feel free to share your work and let me know in the comments section below!
--------------------------------------------------------------------------------------------------------
Please like, subscribe and share your ideas and charts with the community!
--------------------------------------------------------------------------------------------------------

Updated BLX possible Bitcoin bottom indicationsAs mentioned previously, the last two bear market lows are the only time that the weekly RSI has closed in oversold. The RSI and Stoch RSI structures at that point, and leading out, are the same. And this all appears to align with the most recent breakdown into oversold just a couple of months back, in June. We can also note a pullback after RSI rallied out of oversold in the previous occurrences. This would be the likely stage we are in if the chart continues to follow those previous bear markets. The orange line is the weekly 200 MA. The green line is the weekly 50 MA and the blue line is the weekly 100 MA. The 50 has crossed below the 100 in the previous two bear markets AFTER price has bottomed. We appear to be a week away from that same cross right now which means that IF the chart continues to follow the previous two bear markets, then we shouldn't see a low below the June 2022 swing low. Finally, we can note that the hash ribbons indicator at the bottom of the screen has flashed the recovery lime green bubble after flashing the grey capitulation bubble.
So, while past results don't guarantee the same in the future, there are a lot of similarities in the same areas. We will see if they play out the same way this time or not.

DeGRAM | BTC longBitcoin is consolidating at the support level of $20 000.
The market is likely to pullback and retest the local resistance zone.
We expect a retest of the resistance level or a sideways move .
-------------------
Share your opinion in the comments and support the idea with like. Thanks for your support!

BTC weakening I haven't posted on here for quite a while, so I decided to update you on BTC.
We can appreciate that BTC has been forming bearish flags throughout this bear market. These are typical distribution patterns where traders take profit and bottom pickers gamble based on thin assumptions.
We can see that every time BTC broke out these formations it resulted in a strong volatile move to the downside. We also have similarities in how every time BTC recovered above the 52 MA, the loss of it would validate the pattern providing resistance and points of entry for shorts.
BTC had a mild reaction based on the last inflation data that had found resistance at the Anchored VWAP of the bottom of 2018. VWAP are level of interest where institutions look for liquidity in either sides (Supply and Demand). Institution and big funds to enter or unload their bags need a high amount of liquidity in order to fill their orders or pass their assets to you, otherwise they would create a strong reaction in the market or simply lose money in the spread created. VWAP is volume weighted average price so track the price average weighted for its volume suggesting areas where the price has strong volume.
BTC at the moment has clearly broke out the formation, however this time it seems there is less gasoline on fire. We have a very important level to keep our eyes on which is the previous 2017 peak. This level proved to be a strong support. At the same time the price have been overstretched to the downside which is clearly shown in the oscillators.
I would be cautious at this point as strong volatility may enter in both sides at this 18800. The pure target of the formation is down to 11k which is a strong possibility now. However pay attention at the data at 18800 as things may reverse quickly.
Short term I expect a retest to the broken support of the formation before a continuation to test the 18800 support.
At the moment I am staying on the sidelines waiting for a strong candle signal which either confirm the downtrend and show a potential reversal.
In my community we have recognised the warning signs early and we are out since 24000 avoiding a 17% drawdown of the last drop.
Just always remember to use sound risk management...DCA can be powerful long term (5 to 10 year) but short term will destroy your capital as I believe we don t have infinate fund and you will find yourself in a strong losing position. DCA is best at the beginning of a bull trend rather then in a bear market.
FOLLOW ME, SHARE, LIKE AND COMMENT

BITCOIN Will the pivot line hold again?Bitcoin (BTCUSD) has completed nine days below the 1D MA50 (blue trend-line) as it failed to capitalize on last week's slow rise and got rejected on Friday just before breaking it following Powell's comments on the Fed's outlook.
This downtrend has started on August 15, after the price got rejected exactly on the 1D MA100 (green trend-line). The last time we saw a similar rejection was on March 02. BTC also suffered a short-term pull-back, before rebounding again to the 1D MA200 (orange trend-line) and eventually starting the new selling sequence.
A key during the Nov 2021 - March 2022 phase was the Pivot trend-line (1) which at first was a perfect Resistance but then on the shorter-term turned into a Support, which gave the critical bounce to the 1D MA100 and the 1D MA200.
We have an identical trend-line (2) since March that has been acting as a Resistance since July 20 and after breaking, has held so far twice, with the first bounce giving the 1D MA100 test. If it holds, there are high chances of starting a new rebound towards the 1D MA200. If not, the fractal model is invalidated and should put the 1W MA300 to test.
Notice also that the Ichimoku Cloud is now on green territory. When that happened on March 25, Bitcoin had already started the rebound to the 1D MA200.
So do you think the Pivot trend-line will hold? Feel free to share your work and let me know in the comments section below!
--------------------------------------------------------------------------------------------------------
Please like, subscribe and share your ideas and charts with the community!
--------------------------------------------------------------------------------------------------------

BITCOIN Cyclical 1D MA200 model shows bottom & bullish break-outBitcoin (BTCUSD) tends to have a constant cyclical behavior, repeating certain aspects over and over again during each Cycle. The model that I will quickly analyze on today's post is no different and it involves the 1D MA200 (orange trend-line).
** Similar dips and break-out durations **
On this 1W time-frame, you can see that during the past two Cycles, the price dipped -65% (Jan 12 2015) and -63% (December 10 2018) after the last rejection on the 1D MA200, before making the Bottom of the Bear Cycle. Also, the times from the rejections until the price broke again above the 1D MA200 are comparable, as it respectively took 33 weeks (231 days) to break above it on June 29 2015 and 36 weeks (252 days) on the April 01 2019 1W candle.
As you see, those are roughly identical numbers and continue to hold during the current Cycle as well, as the drop from the last 1D MA200 rejection (March 28 2022 candle) to the June 13 2022 Low, has also been -63%, making it a bottom according to the model. If this process is fulfilled, then the price will break above the 1D MA200 again by the week of December 05 2022 the latest.
** Williams Alligator showing the Bottom is in **
An additional indicator that brings value to this model, is the Williams Alligator used on a 3W time-frame here. As shown during the past two Cycles, the market Bottom was made right when the green trend-line (lips) crossed below the blue trend-line (jaw). Similarly when the green trend-line crossed back above the blue, BTC had already started rising into the new Bull Cycle and that was an indication that the first rally of the Cycle made its top.
So do you think that this model will be repeated once more, meaning that the market has already bottomed and Bitcoin will break above the 1D MA200 by the week of December 05 2022 the latest? Feel free to share your work and let me know in the comments section below!
P.S. Because the chart has the added element of the Williams Alligator plotted and pinned to scale Z, it is not constant and may appear distorted based on your screen's/ browser dimensions. The original looks like this below, so if yours doesn't, adjust the vertical/ horizontal axis in order to make it look like this and better understand what is illustrated:
--------------------------------------------------------------------------------------------------------
Please like, subscribe and share your ideas and charts with the community!
--------------------------------------------------------------------------------------------------------
