Bitcoin forecast and ideaPlease write any advice or suggestions.
Dear friends, request any cryptocurrency pair, currencies pair for forex, and any index that you want to be analyzed and ask any questions.
Thanks for your attention
Bitcoinsignals

Start of BTC BULL Season
Yesterday i.e. 13-7-2022, PI-CYCLE BOTTOM indicator plotted the FIRST BULL signal of BULL PHASE of this season.
In 2015, 1st PI-CYCLE BOTTOM yielded in around 11798% ($166.45 to $19804.25) gain.
In 2018, 2nd PI-CYCLE BOTTOM yielded in around 2108% ($3124.51 to $68997.75) gain.
In 2022, 3rd PI-CYCLE BOTTOM signal has flashed. (kindly share your views in comments below on how much gain can we get this time).
/////////////////
////////////////
With the FLASH of Pi BUY signal, we have closed 80% of positions size on all SHORT TRADES opened in november 2021 (20% runner still intact with strict SL).
////////////////
////////////////
Our TRADE SETUP for this BULL SEASON (position size allocation):
Pi BUY signal = 15% (ENTRY TAKEN)
H BUY signal = 15% (ENTRY PENDING as Signal yet to FLASH)
D BUY signal = 15% (ENTRY PENDING as Signal yet to FLASH)
HG BUY signal = 15% (ENTRY PENDING as Signal yet to FLASH)
HR BUY signal = 15% (ENTRY PENDING as Signal yet to FLASH)
Emergency fund = 25%
Out of our 5 trade setups, we have opened 1 long position. Rest 4 signals are yet to come, will be updated as soon as they FLASH.

BTCUSD Miner Capitulation ended! Best Buy but eyes on the USD.Two days ago the Hash Ribbon on the well-known indicator flashed a buy signal, technically ending the Miner Capitulation! What does this mean for Bitcoin (BTCUSD)? Well historically, Miner Capitulation periods have occurred on absolute market bottoms (or lows during uptrends), providing the most attractive buy entries. The 'blue' buy signal on this indicator practically marks the end of this period, which gives the most optimal entry for a long-term investor.
With the price being within the Buy Zone that comes all the way from the previous Bear Cycle bottom, still on Higher Lows, continuing to imitate the December - March 2019 bottom formation process, we may be in a spot similar to Jan 12 2019, when the price broke below its 1D MA50 (blue trend-line) after having marginally broken above it previously, stayed below for 2-3 weeks but when it recovered it again, it didn't break it for months, starting the first rally into the new Bull Cycle. BTC is again currently below the 1D MA50 after trading above it for the majority of August. A break above it again, could be the last we see for months, initiating the new rally.
The only objection we have against this pattern getting repeated, is the U.S. Dollar Index (DXY) displayed by the green trend-line, which has been rising aggressively since mid August and is something that isn't consistent with Bitcoin rallies. Technically, BTC doesn't rise when the USD rises as well. Check the recent history where all major bottoms (Dec 2019 and March 2020) have coincided with the USD trading at least sideways.
Do you think however that the Miners Capitulation ending can provide a boost strong enough on its own regardless of the rising USD? Feel free to share your work and let me know in the comments section below!
--------------------------------------------------------------------------------------------------------
Please like, subscribe and share your ideas and charts with the community!
--------------------------------------------------------------------------------------------------------


BITCOIN Will the historic Growth Support come to the rescue?Since the rejection on the 1D MA100 five days ago, Bitcoin (BTCUSD) has been on a short-term pull-back which got accelerated yesterday. We covered the short-term outlook with an urgent update yesterday:
For long-term traders and investors, the scene is a little different and is best illustrated on the 1W time-frame. This shows the price breaking below the 1W MA200 (orange trend-line) but still considerably above the 1W MA300 (red trend-line), which was the level that provided the support and immense rebound in March 2020 during the COVID asset-wide collapse.
What is perhaps more relevant than ever now, is BTC's Historic Growth Zone (blue) which has held on the mid-June low and is about to be put up to test again. That Support Zone has started back on the August 2015 low, the first after the 2014 Bear Cycle. Respecting this level, means that we are still inside the ultimate Buy Zone and therefore at the start of a new Bull Cycle.
At the same time the 1W RSI is (naturally) pulling back a notch and seems to be consistent with the April 2015 and January 2019 pull-backs, which where right before the start of the first rallies of the new Bull Cycles.
So what do you think? Will the historic Growth Support come to the rescue once again or not? Feel free to share your work and let me know in the comments section below!
--------------------------------------------------------------------------------------------------------
Please like, subscribe and share your ideas and charts with the community!
--------------------------------------------------------------------------------------------------------

Bitcoin's 12-year history of weekly oversold RSIFor what it's worth, every time Bitcoin's weekly RSI has reached oversold it has marked the bottom of the bear market and ushered in a new bull market. The weekly RSI has only reached oversold twice before - January 2015 and December 2018. So, it's a rare occurrence signaling that either the cycle top is in this time, or we've still got a new ATH coming. Do with this info what you wish.
The orange line is the weekly 200 MA.

BITCOIN Critical test for this uptrend. CAUTION needed.Bitcoin (BTCUSD) was rejected on Monday on the 1D MA100 (green trend-line) with the selling accelerating today as the price broke below the 1D MA50 (blue trend-line) for the first time since July 27. This is a critical test for this uptrend as the very stable Channel Up that started after the June 18 Low, is approaching its Higher Lows (bottom) trend-line).
** An identical Channel Up **
The 1D RSI shows that we are testing the symmetrical Support Zone of another Channel Up, that of January 24 - May 04, similar in structure with the current one. As you see as long as that Support Zone held, the price was contained within the former Channel Up. In fact that Channel was also rejected at first on the 1D MA100 and fell below the 1D MA50 (twice also) but recovered and hit the 1D MA200 (orange trend-line) where the eventual rejection started to the June 18 Low.
** 1D MA200 or 1W MA300? **
As a result, the RSI shows the limits where trading inside the current Channel Up can be prolonged. A break above the Higher Highs (top) trend-line of the Channel could be enough to hit the 1D MA200 but a break below can be extremely alarming as not only the long-term Support of the 1W MA300 (red trend-line) may be tested but if failed, even a downside extension to the 1.5 Fibonacci extension level is possible, which is exactly the first level hit when the former Channel Up broke.
What scenario do you think is more probable? Feel free to share your work and let me know in the comments section below!
--------------------------------------------------------------------------------------------------------
Please like, subscribe and share your ideas and charts with the community!
--------------------------------------------------------------------------------------------------------

Predicting The Next Bitcoin CrashThis year I predicted Bitcoin capitulation as early as late January. I knew that Mid to end of may was a big event.
Was it perfect timing , not really but we did get crash Mid May followed by capitulation shortly after so was off by just 3weeks it is pretty damn close.
Now for the next date I believe I will be even more accurate and predict the second capitulation. Bitcoin every cycle has two capitulations ,without fail we have created a double bottom every time.
Without fail every time we have come back down and retested the bottom .
Today I will reveal the next major Bitcoin marco event and that date is 26th June 2023 to 17 July 2023.
Why these dates? well let's take a look , a lot of things line up with this timeframe :,
1.Bottom of the weekly regression band as you can see is 13.8k during this timeframe , if this did play out it would hit right at the bottom of the green band just like the covid crash.
2. 13.8k (red dashed line) this area has major confluence with the 0.618 of the last cycle .
3. We have this orange trendline lining up for bitcoin like past cycles , what's interesting about this trendline is the first area lines up with the last pullback before the cycle top in 2017 and 2021.
The second area is the first capitulation like the last cycle (red) and the third I'm predicting will be bitcoin's second capitulation phase.
4. Really Powerful FIb time sequence , this sequence has predicted lets just say “big” moves.
The key here is finding out when the second capitulation will happen , last time it was the Covid crash , I remember when price was at 10.5k just before the crash and thinking well at this point we might not get a second capitulation and then bang there you have it Bitcoin capitulated and it just keeps on lining up with world events , so expect something big to happen in the world for the next.
So at this point you can see that my target for the second capitulation in fact won't make it a double bottom next year but a lower low. This has happened once before in 2015
price did go 3% lower on the second capitulation.
The fact is that the Dow Jones is inside a rising wedge
If this rising wedge breaks the chance of a 50% stock market crash is very high, if this did happen then Bitcoin price would be pushed much lower for the second capitulation this cycle , it would make history they would call the end of Bitcoin and that is the moment you go all in , if this unfolds you know what comes next.
I go over Dow Jones potential crash in this TA below
Which now leaves me to last piece of the puzzle which fits if Bitcoin has a relief rally like 2019 i will explain this theory with the Mayer Multiple bands
Every cycle bottom Bitcoin has come down to the last band and this year we did just that , touched it just like the covid crash it was just another piece of evidence that we bottomed.
So if my capitulation target is 13.8k then the bottom of the band July 2023 must be around 13.8k and if you just make a projection you can see that it is possible that the last band curves in for this date! But Bitcoin would have to put in some sort of rally.
So far the band is starting to curve nicely and maybe a run up to 0.5 Fib would make that projection happen, which brings me to the last point , are we going to get a rally up to one of these levels if so it would be setting up for the second crash.
Last cycle we ran up to the 618 as I showed above in the picture on point 2. This cycle who knows maybe we don't even have a rally but if we did it would most likely start in October.
You can check out that TA , I have a very strong fib date in October 2022 and if a rally does start from this month expect massive momentum for at least 142days , which would put the end of the rally mid February 2023.
Most of the traders are expecting capitulation this year or start of January 2023 but the next big move is July 2023. If I get this right I would be predicting two big crashes back to back and the crazy thing is I have the next 4 dates.
Honestly I don't know what will happen on this date this early normally 90days before I can tell what it will be , either capitulation , a top or a massive pivot of momentum but I will put this out anyways.

Bitcoin forecast and ideaPlease write any advice or suggestions.
Dear friends, request any cryptocurrency pair, currencies pair for forex, and any index that you want to be analyzed and ask any questions.
Thanks for your attention

BITCOIN This 3D RSI rejection is far from ideal. CAUTION needed!Bitcoin (BTCUSD) is trading today on the fourth straight red 1D candle and even though the pull-back is insignificant so far, there is a certain pattern on the 3D time-frame that is worrying.
As you see, the 3D RSI hit last week the Lower Highs trend-line that started on January 07 2021 and defined this whole Bear Cycle. This week, we see that 3D RSI turning lower as the test turned out to be a rejection. This has also happened on March 26 2022 and November 06 2021, which marked the last two Highs of the market.
Based also on the 3D MACD, which has been steadily rising since June 30, this pattern resembles the bottom sequence and subsequent first rise of the recovery phase during the previous Bear Cycle of 2019. As shown, the 3D RSI had a rejection exactly on the same level as today's one, while the 3D MACD was rising. As with today, the rejection came before hitting the 3D MA50 (blue trend-line) and took place on the 0.382 Fibonacci retracement level (counting from the top of the last collapse, essentially the 3D Death Cross).
The resulting pull-back found Support on the Higher Lows trend-line and the 0.236 Fibonacci level and after some more consolidation both the RSI Lower Highs and the 3D MA50 broke and a very strong rally took place. Now, the fundamentals behind that rally were different and a 3D MA50 break-out doesn't have to necessarily follow 2019 into such a strong rally. But still it will be evidence of the new Bull Cycle.
If you are a short-term trader though, that 3D RSI rejection tells you to proceed to the next days with caution and look for that more confident lower buy. Do you agree? Feel free to share your work and let me know in the comments section below!
--------------------------------------------------------------------------------------------------------
Please like, subscribe and share your ideas and charts with the community!
--------------------------------------------------------------------------------------------------------

BITCOIN monthly is making a huge shift to the upsideThis is a simple Bitcoin (BTCUSD) analysis on the 1M (monthly) time-frame, using two powerful indicators that are often overlooked. Those are the Aroon Oscillator and the Vortex Indicator. The chart illustrated the Fibonacci MAs to give a sense of the long-term Support Zones, a level where we clearly are at now.
As you see, every time the Aroon Osc turns sideways following a huge downfall, the Cycle bottoms. We are now sideways since June and that is typically the market accumulation phase. Once the Aroon shifts upwards even slightly, the first rally of the Bull Cycle will have already began.
At the same time, the Vortex Indicator has already made its first Cross since April. Once the lines cross again, it will be an indication that the accumulation phase is over and the rally will begin, which is consistent with all prior Bear Cycle bottoms.
That wraps it up on this short BTC update. Remember that sometimes, it is useful to keep a long-term perspective, especially in the crypto market. And that currently tells us that most likely we won't get a better opportunity to accumulate for the new Bull Cycle. Do you agree? Feel free to share your work and let me know in the comments section below!
--------------------------------------------------------------------------------------------------------
Please like, subscribe and share your ideas and charts with the community!
--------------------------------------------------------------------------------------------------------

Bitcoin forecast and IdeaPlease write any advice or suggestions.
Dear friends, request any cryptocurrency pair, currencies pair for forex, and any index that you want to be analyzed and ask any questions.
Thanks for your attention

BTCUSD [BITCOIN USDT]Bitcoin Analysis:
After price drop to strong level of support 24172 level we see bulls take the control and push price to upside toward the strong key level of resistance also hit 25k high where 200EMA restest on Weekly timeframe and in short time frame candle close below 25k and also respect its resistance trend line 24936.
What next in #bitcoin?
Price of bitcoin retest its 200 EMA on weekly time frame and close below the trend line in short timeframe this show bearish market structure also important bearish chart pattern triple top formation show some kind of selling pressure in bitcoin. Also evening star candle stick show bearish sign.
ENTRY SHORT 24800$
TAKE PROFIT 24509$
TAKE PROFIT 24131$
TAKE PROFIT 23667$
STOP LOSS 25300$

BITCOIN hit its 1D MA100 for the firsts time since April!Bitcoin (BTCUSD) has been trading within a sustainable Channel Up every since the June 18 Low and today hit the 1D MA100 (green trend-line) for the first time since April 21 2022. The trend looks strong considering that the MACD on the 1W time-frame is on a Bullish Cross, however if you are a short/ medium-term trader you should be skeptical of these levels.
The reason isn't just the fact that the 1D MA100 is a Resistance but as you see, the last 1W MACD Bullish Cross (March 30) was formed on a market top and failed to deliver a sustainable rise. As a result, we should be looking for a break above the November 10 2021 Lower Highs trend-line (started after the market's All Time High), which would be a bullish break-out signal towards the 1D MA200 (orange trend-line).
On the long-term, only a break above the 1D MA200 can call for a long-term trend reversal to bullish, as the MA200 was the one that rejected BTC on the March 28 High. Also on the long-term, it would be useful to consider the importance of the 0.382 - 0.5 - 0.618 Fibonacci retracement levels, when the 1D MA200 breaks, as the highest volatility of this Bear Cycle has been seen within those levels.
Feel free to share your work and comment below!
--------------------------------------------------------------------------------------------------------
Please like, subscribe and share your ideas and charts with the community!
--------------------------------------------------------------------------------------------------------

DeGRAM | BITCOIN short Bitcoin could not go up and made a double top at the resistance level $25 000.
The market is still moving in ascending channel
We expect a retest of the support level or sideways move .
-------------------
Share your opinion in the comments and support the idea with like. Thanks for your support!

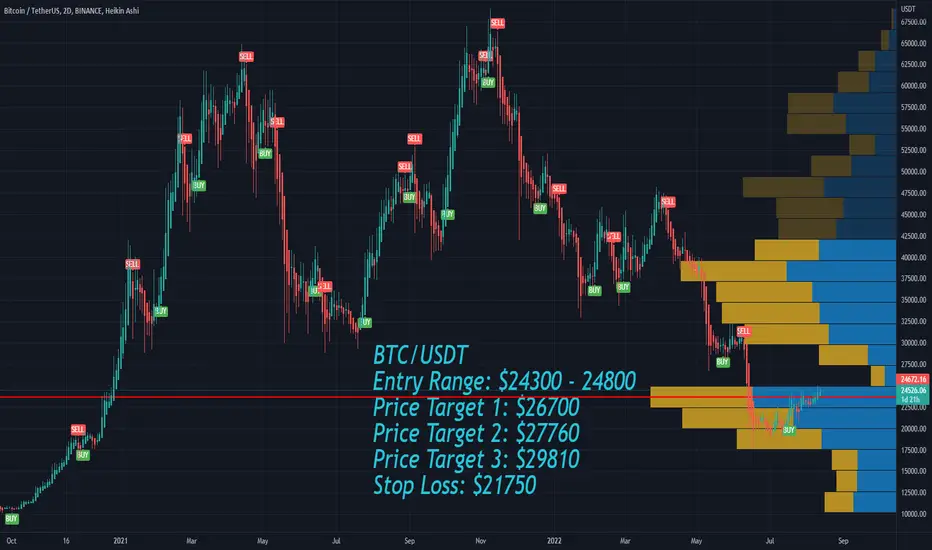
BTC Bitcoin Entry Range, Take Profit and Stop LossBTC/USDT
Entry Range: $24300 - 24800
Price Target 1: $26700
Price Target 2: $27760
Price Target 3: $29810
Stop Loss: $21750
BITCOIN Radical Cycle Comparison gives the next Top around 140k!This is not the first time I use the fractals of the previous Cycles under a certain rules of parameters in order to make a projection. This is by far the best methodology to make long-term projections on Bitcoin (BTCUSD) as its cyclical behavior has been extremely consistent over the years.
This time is no different and the dynamic under which I compare the Cycles is a Lower Highs zone. As you see if we start all Cycles from their market Bottom on the same straight (Support) line, they all make their Top on the same Lower Highs zone. As a result I've used all past Cycle models (July 2010 - October 2011 = Black, November 2011 - January 2015 = Blue, February 2015 - December 2018 = Green, January 2019 - June 2022 = Orange), and fit them under this Lower Highs zone to expand the model with an average projection. If we then take all those new projections and start them on the actual price action (time-frame on 1W) starting from the June 2022 Low, we can get a fair estimation.
It is interesting to see that with the expection of the first (black) Cycle which was the most aggressive, the remaining three all give an estimated top within 115 - 140k! The first Cycle (black), being quicker, rising to the Lower Highs zone much higher, gives the next Top around 230k but it is unlikely to get that aggressive price action again.
Again, those are just projections based on Bitcoin's 10+ year price action and a certain set of parameters. The future trend doesn't have to follow any of those but all of them bundled together do make a fair average projection indeed.
So where do you personally have the next Cycle Top at? Do you think this model can offer a good projection? Feel free to share your work and let me know in the comments section below!
P.S. Because the chart has these bar projections (different colors) plotted and not constant, it may appear distorted based on your screen's/ browser dimensions. The original looks like this below, so if yours doesn't, adjust the vertical/ horizontal axis in order to make it look like this and better understand what is illustrated:
--------------------------------------------------------------------------------------------------------
Please like, subscribe and share your ideas and charts with the community!
--------------------------------------------------------------------------------------------------------

Will Bitcoin drop again?Since the mid of July, Bitcoin started to recover and in the past two weeks, it managed to stay above 22k important support.
However, looking at the chart is clear that bulls do not have the power to pass above the 25k zone and that the last rise is not impulsive.
A new leg down is probable at this moment and a break of 22k would expose 20k with extension in the previous low.
Only a daily close above 25 would change my bearish opinion.

BITCOIN Failed to close 3rd green week but positive signs remainLast week, Bitcoin (BTCUSD) marginally failed to close its 3rd straight bullish 1W (weekly) candle, a feat that hasn't been achieved since the November 08 2021 weekly candle. This isn't ideal as BTC's last big rally (late July - late November 2021) started off with three straight (strong as well) green weeks. Despite this however, there is a growing number of positive indicators showing that this could be a sustainable accumulation period, preceding the start of a rally and the new Bull Cycle.
** The positives **
First and foremost, the price succeeded at closing above the 1W MA200 (orange trend-line) for the 2nd straight week. As you see on the chart below, this is essential during Cycle bottom formations and every time the price held above this level in past Cycles, it lead to a rally eventually:
Secondly, the 1W MACD just formed a Bullish Cross, the first since late March 2022. Now of course that last pattern led to a new sell-off and Lower Low eventually but was much closer to both the 1D MA200 (yellow trend-line) and the 1W MA50 (blue trend-line), where the price got rejected. Now those levels are around 33223 and 40625 respectively, so there is much more room to grow before we can discuss about a rejection/ pull-back.
Among all the above, we shouldn't forget to acknowledge the fact that Bitcoin has kept the 1W MA300 (red trend-line), which is the basic Support of the Cycle. As you see, on the snapshot above, that was the level that supported the market during the March 2020 COVID (black-swan) event. If it held that huge psychological test, there is on reason not to believe that it won't hold this time as well.
** Some hurdles **
We see the biggest Resistance levels, on the short-term at least, on the Fibonacci patterns drawn. The Fib Channel that is illustrated has kept the price closing below its 0.5 Fibonacci retracement level on 3 straight weekly candles. Similarly, on the horizontal axis, the price has failed to close (broke it on the July 25 candle but failed to close above it) above the 0.236 Fib retracement level (orange) also for 3 straight weeks. It is apparent that this Fib cluster forms a strong Resistance, at least on the short-term. Breaking above it, opens the way for the 0.382 Fib, potentially testing as well the 1D MA200.
Rejection on the 0.236 Fib can result in short-term selling back to the June Support, on a similar Double Bottom scenario as in July 2021 and February 2022. Do you think this would still be enough to support the market and start the new rally in September/ October? Feel free to share your work and let me know in the comments section below!
--------------------------------------------------------------------------------------------------------
Please like, subscribe and share your ideas and charts with the community!
--------------------------------------------------------------------------------------------------------

ETHUSD setting up for an uprise? ETHUSD has formed a bullish market structure after the breakout from the weekly resistance. Weekly support turned as resistance and back to back double doji is formed with higher high and higer low.
According to our analysis ETHUSD is setting up for a bullish move.
Thank you for visiting this idea. Press the like button if you find value in this analysis :)

BITCOIN BTCUSD Analysissee picture for analysis.
Option 1)
Waiting for price to enter daily demand and wait for 30min/1hr conf buy setups.
OR
Option 2)
Looking for buys now with following the 4hr trend and entering trades on 15min/30min/1hr.

BITCOIN formed a MACD Bearish Cross. Time to prove Bear is over?Bitcoin (BTCUSD) has made a confirmed Bearish Cross on MACD on the 1D time-frame. Every such formation within 2022 has so far been extremely bearish, marking a top to a subsequent aggressive price fall. It may be above the 1D MA50 (blue trend-line) and still within a Channel Up but we've seen similar patterns leading to MACD Bearish Crosses, followed by price falls.
Currently BTC has failed to break even the 0.236 Fibonacci retracement level where it was rejected exactly on July 30 and the 1D MA200 (orange trend-line), which is intact since December 31 2021, is on the 0.5 Fib level, a strong Resistance.
Do you think it is time for Bitcoin to finally invalidate a MACD Bearish Cross and prove that the Bear Cycle is indeed over? Feel free to share your work and let me know in the comments section below!
--------------------------------------------------------------------------------------------------------
Please like, subscribe and share your ideas and charts with the community!
--------------------------------------------------------------------------------------------------------

BITCOIN following Apple's 2008/09 Bear Fractal. Bottom is in!This is Bitcoin (BTCUSD) on the right along with Apple (AAPL) on the left chart on a very interesting comparison on the 1W time-frame. I will keep it short as the picture is quite self-explanatory.
As you see, Bitcoin's 2021/22 Bear Cycle has been very similar so far to Apple's 2008/09 Bear Cycle during the Housing Crisis. Following a rough Double Top (1 & 3) they both dropped below the 1W MA50 (blue trend-line) and started slowing down only after breaking the 1W MA200 (orange trend-line) but at the same time keeping the 1W MA300 (red trend-line) intact. Both turned their 1W RSI into oversold territory exactly when they broke below the 1W MA200 and recovered above their MA (yellow trend-line).
That is where BTC is at currently. For Apple that RSI MA break was the start of a three month consolidation before the parabolic rally that took the stock into the new age of growth of the past 13 years. For comparison purposes I've plotted that same Apple recovery pattern on Bitcoin to give us a rough idea of an estimate. It doesn't have to follow that sequence of course but it makes an interesting projection. Perhaps the most useful conclusion we can draw from the whole comparison is that, assuming investor psychology doesn't differ among different asset classes, with history showing that psychological models in extreme market conditions tend to stay the same, Bitcoin has strong probabilities of already having priced its bottom.
What is your opinion on this comparison? Feel free to share your work and let me know in the comments section below!
--------------------------------------------------------------------------------------------------------
Please like, subscribe and share your ideas and charts with the community!
--------------------------------------------------------------------------------------------------------
