Maybe your biggest risk is your biggest chance !!!Bitcoin will reach $130k with a slight price correction.
my previous analysis in last year !!
Give me some energy !!
✨We spend hours finding potential opportunities and writing useful ideas, we would be happy if you support us.
Best regards CobraVanguard.💚
_ _ _ _ __ _ _ _ _ _ _ _ _ _ _ _ _ _ _ _ _ _ _ _ _ _ _ _ _ _ _ _
✅Thank you, and for more ideas, hit ❤️Like❤️ and 🌟Follow🌟!
⚠️Things can change...
The markets are always changing and even with all these signals, the market changes tend to be strong and fast!!
Bitcoinsignals

Bitcoin’s Pump to NEW ATH($109,845) Ends in High-Volume ReversalBitcoin ( BINANCE:BTCUSDT ) moved towards the targets as I expected in my previous idea , although it faced pump and dump moves in reaching the targets .
Bitcoin managed to create a new New All-Time High(ATH=$109,845) but immediately began to decline on high volume .
Bitcoin is trading in the Resistance zone($109,588-$105,860) and near the Resistance lines , Monthly Resistance(2) .
In terms of Elliott Wave theory , Bitcoin was able to complete main wave 5 .
I expect Bitcoin to fall to at least $102,200 AFTER breaking the Support zone($105,100-$104,140) , and the possibility of further declines is very high .
Also, on the 1-hour timeframe of the USDT.D% ( CRYPTOCAP:USDT.D ) chart, a bullish and regressive Falling Wedge pattern is visible , with its upper line broken.
Do you think Bitcoin can finally create a NEW All-Time High(ATH) Again!?
Note: If Bitcoin touches $110,100, we should expect a pump.
Please respect each other's ideas and express them politely if you agree or disagree.
Bitcoin Analyze (BTCUSDT), 1-hour time frame.
Be sure to follow the updated ideas.
Do not forget to put a Stop loss for your positions (For every position you want to open).
Please follow your strategy and updates; this is just my Idea, and I will gladly see your ideas in this post.
Please do not forget the ✅' like '✅ button 🙏😊 & Share it with your friends; thanks, and Trade safe.

BITCOIN made new ATH but still much time left before a Cycle topBitcoin (BTCUSD) is about to enter the final week of May, with the month mostly likely to close on a strong green candle, the 2nd straight. Though it made yesterday a new All Time High (ATH) above 109k and many are already talking about a bearish reversal, this chart shows that there is still plenty of time left before the current Bull Cycle tops.
If fact a simple measurement of the Bottom to Bottom and Bottom to Top ranges of the last 3 Cycles is enough to present all the evidence that are needed for this case.
As you can see, the previous 2 Bull Cycles lasted for 35 months (1065 days) from Bottom to Top. Similarly, the Bottom to Bottom (Bear Cycle to Bear Cycle) measurement has been 47 months (1430 days).
This amazing symmetry suggest that BTC is more likely than not to repeat this feat on the current Cycle as well. A 35 month range from Top to Top indicates that the Bull Cycle is expected to peak on October 2025, while a 47 month Bottom to Bottom range indicates that the next Bear Cycle should bottom in October 2026! As far as a potential price top is concerned, various of the previous analyses we've conducted show that $200k is a fair maximum, but the current study focuses on the timing of profit taking and not specific price levels.
So are you willing to book your profits by this October? Feel free to let us know in the comments section below!
-------------------------------------------------------------------------------
** Please LIKE 👍, FOLLOW ✅, SHARE 🙌 and COMMENT ✍ if you enjoy this idea! Also share your ideas and charts in the comments section below! This is best way to keep it relevant, support us, keep the content here free and allow the idea to reach as many people as possible. **
-------------------------------------------------------------------------------
💸💸💸💸💸💸
👇 👇 👇 👇 👇 👇

BTC/USD Facing Key Resistance – Watch for Daily Close ConfirmatiBitcoin is currently testing a critical resistance zone between 107,150 and 107,800, which has previously acted as a strong supply area. For the bullish trend to continue, we need to see a daily close above this resistance range.
Until a confirmed breakout occurs, the price is vulnerable to a pullback toward the rising trendline, which has been supporting the uptrend since April.
📌 Key Points:
Strong horizontal resistance at 107,150–107,800
Rising wedge structure could signal exhaustion
A daily candle close above 107,800 is required for further upside continuation
Failure to break this resistance increases the probability of a correction toward the ascending trendline support
This is a critical area to monitor for both breakout traders and those looking for potential short-term reversal setups.

BITCOIN Ultimate Cycle Zones breakdown! See when to sell!Bitcoin (BTCUSD) is extending its amazing rebound on its 1W MA50 (blue trend-line), having recovered all of the losses sustained following the U.S. - Chine Trade War. Based on this Cycle's pattern, this 1W MA50 rebound is technically the new Bullish Leg, essentially its 4th of this Cycle.
Among all this, we managed to identify another cyclical pattern, separating the Cycle in terms of Activity Zones:
Naturally its very bottom is what we call the 'Best Buy Zone' (green), where BTC's earliest and most optimal buy opportunities existed. That ranges within the 0.0 and 1.0 Fibonacci levels.
Above that it's the 'Final Buy Zone' (yellow) where in relative efficieny terms, the last long-term buy opportunities existed. That Zone consists of the 1.0 and 2.0 Fibonacci levels.
Third in line is the 'First TP Zone' (orange) where long-term investors who seek lower risk, can start taking profit on their positions. The range on that is the 2.0 - 3.0 Fibonacci levels.
Lastly it's the 'Fina TP Zone' (red) where obviously it is the last opportunity (and with the greatest return but also elevated risk) to take profits before the Cycle prices its Top. This consists of the 3.0 - 4.0 Fibonacci range.
As you may have noticed, each Zone has a .618 interval (highlighted in blue). Zone 1 has the 0.618 Fib, Zone 2 the 1.618 Fib, Zone 3 the 2.618 Fib and one 4 the 3.618 Fib. This is where (so far) the price has made a first consolidation - correction after the start of the new Bullish Leg and before it gets completed at the top Fib. The last such consolidation was from mid December 2024 to late January 2025 and as you see those tend to be significant marks.
This model shows that the current Bullish Leg should prepare us for the Final TP Zone and its first stop is the 3.0 Fib at $135k. This is the bottom of the Final TP Zone and the first region that long-term investors should consider taking profits. The key 3.618 Fib extension is at $210k and in our opinion is the absolute max level we should look to sell all positions as chronologically Cycle wise the trend falls there towards the end of the year, which is where all Cycles topped. A 4.0 Fib test is highly unlikely to take place within this Cycle, unless macroeconomic fundamentals (extreme adoption and/or monetary intervention) kick in and that sits at $280k.
But what do you think? Do you agree with this Zones break-down and if yes are you considering taking profits at 135000? Feel free to let us know in the comments section below!
-------------------------------------------------------------------------------
** Please LIKE 👍, FOLLOW ✅, SHARE 🙌 and COMMENT ✍ if you enjoy this idea! Also share your ideas and charts in the comments section below! This is best way to keep it relevant, support us, keep the content here free and allow the idea to reach as many people as possible. **
-------------------------------------------------------------------------------
💸💸💸💸💸💸
👇 👇 👇 👇 👇 👇

Bitcoin vs Resistance Zones | Fake Breakdown Below the Channel!Bitcoin ( BINANCE:BTCUSDT ) has been moving up and down with high momentum over the past 24 hours and finally fell below the lower line of the ascending channel . Is this break of the lower line of the ascending channel valid?
Bitcoin is trading near the Resistance zone($105,100-$104,140) , Cumulative Short Liquidation Leverage($104,478-$103,941) . Since the volume of breaking of the lower line of the ascending channel is NOT high, the probability of a fake break is very high (in my opinion).
In terms of Elliott Wave theory , the structure of the main wave 4 seems to be an Expanding Flat(ABC/3-3-5) . The main wave 5 could lead to the formation of a new All-Time High(ATH ).
One of the reasons why I think we saw a Fake Break below the lower line of the ascending channel is that I think the S&P500 Index ( SP:SPX ) will trend upward , and given the high correlation between Bitcoin and S&P500 Index these days, we can expect Bitcoin to increase .
I expect Bitcoin to start rising again AFTER breaking the Resistance zone($105,100-$104,140) and touch the targets I have indicated on the chart.
Note: If Bitcoin touches $101,800, we can expect more dumps.
Please respect each other's ideas and express them politely if you agree or disagree.
Bitcoin Analyze (BTCUSDT), 1-hour time frame.
Be sure to follow the updated ideas.
Do not forget to put a Stop loss for your positions (For every position you want to open).
Please follow your strategy and updates; this is just my Idea, and I will gladly see your ideas in this post.
Please do not forget the ✅' like '✅ button 🙏😊 & Share it with your friends; thanks, and Trade safe.

BITCOIN This Cycle's peak zone is $150k - $200k.Bitcoin (BTCUSD) is extending its gains week after week since the April 07 bottom on the 1W MA50, which as we've analyzed extensively its a new Higher Low launchpad for the new (current) Bullish Leg, the way it's been consistently doing on the Higher Lows trend-line since the start of this Bull Cycle.
It's in fact the very same Higher Lows trend-line it had during both previous Cycles, which ended up peaking on the Logarithmic Growth Curve's (LGC) top 2 zones (red), breaking also above the 2 SD above band (orange) of the Mayer Multiple Bands (MMB).
This time the price has 'only' broken above the 1 SD MMB (grey), while having breached into just the lower pink LGC zone. This highlights the theory of Diminishing Returns but at the same time also shows the strong upside potential of the market while subject to these conditions.
So assuming it won't hit by the end of this Cycle the 2 SD MMB nor the top 2 zones of the LGC, the bad case scenario seems to be topping the lower pink LGC zone and the good case scenario topping the upper pink LGC zone. Those two give a profit taking range of 150 - 200k respectively and based on the Sine Waves, we should peak around October 2025.
Is that your profit taking zone as well for this Cycle? Feel free to let us know in the comments section below!
-------------------------------------------------------------------------------
** Please LIKE 👍, FOLLOW ✅, SHARE 🙌 and COMMENT ✍ if you enjoy this idea! Also share your ideas and charts in the comments section below! This is best way to keep it relevant, support us, keep the content here free and allow the idea to reach as many people as possible. **
-------------------------------------------------------------------------------
💸💸💸💸💸💸
👇 👇 👇 👇 👇 👇

BITCOIN forming 1st 1D Golden Cross in 7 months! New ATH ahead??Bitcoin (BTCUSD) is about to form its first Golden Cross on the 1D time-frame in 7 months (since October 27 2024). This comes with the price very close to its $109k All Time High (ATH), following a relentless rebound and recovery from the Trade War correction.
Within the Bull Cycle's 2.5-year Channel Up, all 1D Golden Crosses have delivered higher prices instantly and the minimum % rise one has given before a new 1D MA50 (blue trend-line) pull-back, has been +33.11%.
This gives us an immediate Target of $135000 and is very much in line with a number of previous projections that the date show within this Target Region. Notice also how on all 3 last 1D Golden Crosses, a 1W MACD Bullish Cross precedes it. Basically that is the double confirmation of the medium-term bullish extension.
So do you think this 1D Golden Cross is such a strong buy signal and if yes, is $135k the bare minimum Target short-term? Feel free to let us know in the comments section below!
-------------------------------------------------------------------------------
** Please LIKE 👍, FOLLOW ✅, SHARE 🙌 and COMMENT ✍ if you enjoy this idea! Also share your ideas and charts in the comments section below! This is best way to keep it relevant, support us, keep the content here free and allow the idea to reach as many people as possible. **
-------------------------------------------------------------------------------
💸💸💸💸💸💸
👇 👇 👇 👇 👇 👇

BITCOIN Stairway to 134k.Bitcoin (BTCUSD) is unfolding a very interesting pattern since its April 07 bottom. That was at $74500 and since that level, it has been consistently targeting all 10k intervals above it: From 74k to 84k, 94k and is now on 104k.
Once it hit all those levels, the price consolidated, forming a very structured Channel Up. Now, the Channel Up may not hold forever but this consistency gives us the idea that it can continue targeting all those levels above it: 114k, 124k, 134k. If this pattern continues to hold for as much time as it has since the bottom, then we may see $134k by late June/ early July.
Do you think it is possible to stay this consistent for that long? Feel free to let us know in the comments section below!
-------------------------------------------------------------------------------
** Please LIKE 👍, FOLLOW ✅, SHARE 🙌 and COMMENT ✍ if you enjoy this idea! Also share your ideas and charts in the comments section below! This is best way to keep it relevant, support us, keep the content here free and allow the idea to reach as many people as possible. **
-------------------------------------------------------------------------------
💸💸💸💸💸💸
👇 👇 👇 👇 👇 👇

Bitcoin at PRZ! Is This the Calm Before a Drop?As I expected in yesterday's idea , Bitcoin ( BINANCE:BTCUSDT ) started to rise from near the Support line and hit the Target .
Bitcoin is trading near the Potential Reversal Zone(PRZ) , the upper line of the ascending channel(minor) , and the Resistance line .
In terms of Elliott Wave theory , it seems that Bitcoin has successfully completed the microwave B of the main wave 4 in the ascending channel(minor). A break of the lower line of the ascending channel(minor) could be a sign of the completion of this wave. The corrective structure of the main wave 4 so far could be a Zigzag(ABC/5-3-5) .
I expect Bitcoin to drop to at least $100,923 AFTER breaking the lower line of the ascending channel(minor) and breaking the Support line, the next target could be the lower line of the ascending channel(major) .
Cumulative Short Liquidation Leverage: $106,943-$105,913
Cumulative Short Liquidation Leverage: $105,525-$104,500
Cumulative Long Liquidation Leverage: $100,763-$99,774
Note: If Bitcoin goes above $105,300, we can expect more pumps.
Note: If Bitcoin touches $99,400, we should expect further declines.
Please respect each other's ideas and express them politely if you agree or disagree.
Bitcoin Analyze (BTCUSDT), 1-hour time frame.
Be sure to follow the updated ideas.
Do not forget to put a Stop loss for your positions (For every position you want to open).
Please follow your strategy and updates; this is just my Idea, and I will gladly see your ideas in this post.
Please do not forget the ✅' like'✅ button 🙏😊 & Share it with your friends; thanks, and Trade safe.

BITCOIN 's 'Final 6 months rally' kickstarts the Altseason!This isn't the first time we show you this chart but it couldn't be more relevant than today. We have established on previous analyses how Bitcoin (BTCUSD) has most likely started the final rally of its Cycle, historically the parabolic rally of the last 6 months of the Bull Cycle that ends with its Top.
The addition of today's analysis is that with Bitcoin Dominance (orange trend-line) approaching its 8-year Lower Highs trend-line, this 'Final 6 months rally' of BTC is what technically also starts the Altseason. This is when lower cap coins see massive gains compared to the high cap ones.
At the same time, we get one more confirmation of why a $150k BTC Target is realistic, as by the end of 2025, this price would still be on the 0.618 Fibonacci level of the 8-year Fib Channel Up, a rather 'bad case' scenario based on this pattern.
So what do you think? Will BTC's Final 6 months rally spark a massive Altseason too? Feel free to let us know in the comments section below!
-------------------------------------------------------------------------------
** Please LIKE 👍, FOLLOW ✅, SHARE 🙌 and COMMENT ✍ if you enjoy this idea! Also share your ideas and charts in the comments section below! This is best way to keep it relevant, support us, keep the content here free and allow the idea to reach as many people as possible. **
-------------------------------------------------------------------------------
💸💸💸💸💸💸
👇 👇 👇 👇 👇 👇

BITCOIN making the FINAL PUSH! Only 6 months of BULL left!Bitcoin (BTCUSD) has had n astonishing symmetry among its Cycles in the past 11 years, as all three of the Bear Cycles have had identical durations (13 and 12 months twice) as well as the two Bull Cycles (both 35 months).
As a result, there is no reason to assume otherwise for the current Bull Cycle as well, which if it also lasts for 35 months, it will peak in October 2025. This means that BTC might 'only' have another 6 months of Bull Cycle ahead of it but that's not bad news as historically this phase tends to be the most aggressive part.
Even if it's not, various studies we've done before point out that a price around $150k would be more than fair and practically a 'pessimistic' scenario for the Cycle High.
Do you think that will be the case? Feel free to let us know in the comments section below!
-------------------------------------------------------------------------------
** Please LIKE 👍, FOLLOW ✅, SHARE 🙌 and COMMENT ✍ if you enjoy this idea! Also share your ideas and charts in the comments section below! This is best way to keep it relevant, support us, keep the content here free and allow the idea to reach as many people as possible. **
-------------------------------------------------------------------------------
💸💸💸💸💸💸
👇 👇 👇 👇 👇 👇

Bitcoin’s Path to ATH: Final Wave or Just a Pause? Bitcoin ( BINANCE:BTCUSDT ) pumped about +2% after the " The United States has dropped its tariffs on Chinese goods to 30%, down from a brutal 145%, while China is slashing its own duties on US imports to just 10%, temporarily, for the next 90 days. " news, but then started to decline again. Do you think Bitcoin can see the new All-Time High(ATH)?
Bitcoin is moving near the Support zone($102,200-$101,680) and Support line .
In terms of Elliott wave theory , Bitcoin appears to have completed microwave 3 of the main wave 5 and is currently completing microwave 4 of the main wave 5 .
Given the momentum of the decline a few hours ago , I expect Bitcoin to either touch the previous low or create a new low in the 1-hour timeframe .
I expect Bitcoin to attack the Support zone($102,200-$101,680) once again and possibly touch the Support line and then attack towards the Resistance zone($109,588-$105,865) with the two scenarios I outlined on the chart .
Cumulative Short Liquidation Leverage: $106,943-$105,913
Cumulative Short Liquidation Leverage: $105,313-$104,787
Cumulative Long Liquidation Leverage: $102,198-$101,697
Note: If Bitcoin can move above $104,500 without correction, we can expect more pumping.
Note: If Bitcoin falls below $101,500, we can expect more declines.
Please respect each other's ideas and express them politely if you agree or disagree.
Bitcoin Analyze (BTCUSDT), 1-hour time frame.
Be sure to follow the updated ideas.
Do not forget to put a Stop loss for your positions (For every position you want to open).
Please follow your strategy and updates; this is just my Idea, and I will gladly see your ideas in this post.
Please do not forget the ✅' like '✅ button 🙏😊 & Share it with your friends; thanks, and Trade safe.

BITCOIN on similar spot as before the U.S. elections! 155k next?Bitcoin (BTCUSD) broke last week above the Lower Highs trend-line of its December 2024 High and so far on the current 1W candle, it's consolidating on it.
This is the exact same price action we saw on the October 21 2024 1W candle, which after breaking above that Lower Highs trend-line at the time, it spend 2 weeks consolidating on it before the November 05 U.S. election result started a relentless 7 week rally just below the 2.0 Fibonacci extension.
Note that on both fractals, the Lower Highs break-out and then re-test, took place on the 0.786 Fibonacci retracement level. If BTC manages to close above it at all times, we will have a strong case to expect again a Bullish extension as last December. The symmetrical level just below the 2.0 Fib ext in today's terms is $155000.
Do you think that will be next after a short-term consolidation? Feel free to let us know in the comments section below!
-------------------------------------------------------------------------------
** Please LIKE 👍, FOLLOW ✅, SHARE 🙌 and COMMENT ✍ if you enjoy this idea! Also share your ideas and charts in the comments section below! This is best way to keep it relevant, support us, keep the content here free and allow the idea to reach as many people as possible. **
-------------------------------------------------------------------------------
💸💸💸💸💸💸
👇 👇 👇 👇 👇 👇

BITCOIN about to test its ATH following HUGE U.S. - China deal!Bitcoin (BTCUSD) is marching towards the $109000 Resistance, which is its All Time High (ATH), following the U.S. - China trade agreement 3 hours ago. This can be a huge fundamental boost to the bullish trend as technically, every time the Resistance level broke during this Bull Cycle, the break-out that followed was extremely aggressive.
On October 2 2023, the Resistance test resulted into a strong break-out, which completed a +96.18% rise from the bottom before a 1D MA100 (green trend-line) pull-back. At the same time of the Resistance break-out, we had a 1D MA50/100 Bullish Cross and a 1W MACD Bullish Cross.
The October 29 2024 Resistance test on the other hand was initially unsuccessful and made a 5 day rejection back near the 1D MA50 (blue trend-line) before the next successful test. Again the rise was more than +96.18%.
As a result, we are expecting to see at least $145k by July (+96.18%) once the Resistance breaks.
Do you think that is a realistic time-frame for $145000? Feel free to let us know in the comments section below!
-------------------------------------------------------------------------------
** Please LIKE 👍, FOLLOW ✅, SHARE 🙌 and COMMENT ✍ if you enjoy this idea! Also share your ideas and charts in the comments section below! This is best way to keep it relevant, support us, keep the content here free and allow the idea to reach as many people as possible. **
-------------------------------------------------------------------------------
💸💸💸💸💸💸
👇 👇 👇 👇 👇 👇

Bitcoin Breaks Wedge! Correction Coming Before Next Leg? After Trump said in the press conference, " Better go out and buy stocks now ." The SPX500 index started pumping , and as I said in the ideas of the last few days, Bitcoin ( BINANCE:BTCUSDT )'s correlation with this index has increased. Bitcoin also started pumping.
Yesterday's Bitcoin pump succeeded in failing the Ascending Broadening Wedge Pattern , generally, if the reversal pattern fails, it will play a continuation role .
Bitcoin is moving between the Support zone($100,270-$97,700) and the Resistance zone($109,588-$105,865) . The question is whether Bitcoin will touch the Support zone($100,270-$97,700) again and move towards the Resistance zone($109,588-$105,865) or will it continue its upward trend.
In terms of Elliott Wave theory , it seems that Bitcoin has completed microwave 3 of the main wave 5 . We can expect an even Time Correction on Saturday and Sunday when trading volume is low . There is also a possibility that microwave 4 of the main wave 5 in Cumulative Long Liquidation Leverage($101,838-$101,432) will be completed.
One of the reasons I think we should wait for a correction is the USDT.D% ( CRYPTOCAP:USDT.D ) chart, which we used as a guide in previous ideas .
USDT.D% has reached Monthly Support(1) and a Heavy Support zone(4.73%-4.50%) , which I believe is unlikely to be broken within in first attack , and I expect an increase to the Fibonacci lines on the chart.
I expect Bitcoin to start rising again after a correction .
Cumulative Short Liquidation Leverage: $105,114-$104,100
Note: If Bitcoin touches $97,500, we should expect further declines.
Please respect each other's ideas and express them politely if you agree or disagree.
Bitcoin Analyze (BTCUSDT), 2-hour time frame.
Be sure to follow the updated ideas.
Do not forget to put a Stop loss for your positions (For every position you want to open).
Please follow your strategy and updates; this is just my Idea, and I will gladly see your ideas in this post.
Please do not forget the ✅' like'✅ button 🙏😊 & Share it with your friends; thanks, and Trade safe.

This Low Cap Alt will 20-50x (CULT DAO)This crypto cycle has been brutal for alts. There have been massive shakeouts over and over, a relentless onslaught of rug pulls and scams, and the "Pump.fun" casino on Solana that’s drained billions of retail liquidity and transferred it to the few.
The few always seem to win, and the many always seem to lose. Today, if you’re reading this, it might all change.
CULT DAO could easily 20-50x from now until October 2025. Let’s take a look at the MACD divergence.
### Technical Divergence
For 750 days, this bullish divergence has been forming on the histogram MACD. Every new low on price has formed a higher low on the MACD.
Let’s take a look at a case study of what happens when we get this form of divergence.
I traded this exact same pattern in 2022 that resulted in a nearly 425% move. The play function doesn’t work because they rebranded, and that ticker is no longer valid, but you can scroll to the bottom in my comments on that TA and see the move. I’ll post it under this as well.
As you can see, we got that 425% move. Currently, CULT DAO is showing exactly the same histogram divergence.
Here are some examples of zigzag impulses on low-cap alts. You tend not to get 5 waves; instead, you get this zigzag pattern. This is what I predict CULT DAO will do since it’s only a 5 million market cap.
We can also see in the chart that the 0.618 time Fibonacci level hits at the end of October 2025, which is exactly where I think the altcoin market will top. Check out previous TA on that.
This is only scratching the surface of what is to come for CULT DAO. I have presented to you the technical reason why a big move is stirring and why, at the apex of these divergences, the stars align, and you have the catalyst present itself, and boom—the explosive move comes all at once, and it will be extremely volatile because of its low market cap.
### Let’s Start with the Tokenomics
Every time someone sells or buys CULT DAO on Uniswap, there is a 0.40% tax that goes to a treasury. The top 50 stakers get to pass proposals that fund projects/investments. The idea is to remove the centralized component of funding a project.
121 projects have been funded over the last three years with 3 million dollars.
- Total CULT Funded: 479,751,081,214 CULT
- Total ETH Funded: 1,573 ETH
- Proposals Funded: 121
- Total USD Funded: $3,289,596
- Total ETH Burned: 303 ETH
Allocating these funds has been a learning process over the last three years, but every failure has been necessary in preparing the DAO for what’s to come next.
### The Big Catalyst
The creator of CULT DAO has been working on a blockchain that will function on a custom gas token—that’s right, and that custom token will be CULT DAO. You heard correctly.
Every transaction, every deployment on the blockchain will require the CULT DAO token as gas to execute. The implications are massive. There are multiple dApps that are currently being constructed on the Modulus blockchain.
A privacy-first zkEVM blockchain like Modulus means a scalable, Ethereum-compatible blockchain that prioritizes user privacy through zero-knowledge proofs, allowing optional private transactions while maintaining decentralization.
Modulus is a privacy-first zkEVM blockchain and is scheduled to release this year between April and August 2025. I hope now you’re starting to see the picture.
### CULT DAO and ETH Liquidity Pools
So, why does the price of CULT go down if there is currently very little volume? Well, CULT DAO and ETH liquidity pools are tied together, so if the ETH price goes down, so does CULT. In turn, if ETH goes up, so does CULT.
You can see that CULT is nearly at a 1:1 ratio with ETH for now, coming in at a 0.91 ratio.
In other words, if my thesis is correct about ETH and it goes to 15,000 dollars, the price of CULT would be as follows:
- ETH at $10,000:
CULT Price: $0.000005008 (4x increase).
Market Cap: $21.38M (4x increase).
- ETH at $15,000:
CULT Price: $0.000007512 (6x increase).
Market Cap: $32.08M (6x increase).
That’s right—if nobody even bought CULT, not one dollar, the base liquidity increase of ETH would bring the market cap to possibly 32 million, in other words, if you were thinking of buying ETH, why don’t you just buy CULT DAO?
You can buy ETH now; from this price, 15,000 is 7x, or you can buy CULT DAO, get 6x plus whatever extra volume is coming in. It seems like a logical play, really.
Everything you’ve seen so far is why I believe this MACD histogram divergence has been forming for 750 days. As I said, the stars will align at the apex, and the explosion will come.
### Unruggable and No Whales Controlling Supply
As you can see from the bubble map, the largest wallet that is not an exchange has a cluster total of 0.7%. The rest of the clusters you see in the image are basically exchange wallets, which are the red and dark green circles mostly.
Liquidity is also locked for over 200 years.
- Burned Supply = 1.29664T
- Circulating Supply (including staked) = 4.27T
- Staked Supply = 1.07599T
- Remaining Tradable Supply (excluding burned and staked) = 4.27T - 1.29664T - 1.07599T ≈ 1.89737T
So, no whales, and it’s not possible to rug because liquidity is locked.
### Modulus Blockchain Liquidity Injection
The average liquidity injection for DAOs in ZK would be anything from 200,000 to 10 million. Let’s assume it’s a $1M injection that is split 50/50 between CULT and ETH, a common practice for Uniswap-style pools.
- CULT Amount in Pool: At the current price of $0.000001252, $500,000 buys ~399.36B CULT ($500,000 ÷ $0.000001252).
It would increase the price to a 10 million market cap overnight.
### Conclusion
- Liquidity is locked for 200 years
- No whales
- Not possible to rug
- Mainnet launching this year
- ETH pools tied to CULT
- MACD histogram divergence
The target I have for CULT is just based on Fibonacci levels. Honestly, it’s unpredictable what will happen, how high it will go, or the impact the Modulus chain will have. 120 million is my low-end estimate; the macro Fibonacci is much higher.
The last extension puts it at a 1.4 billion market cap and 266x from where we are now.
This is where you want to be for the upcoming alt season—right here, down 98% with this massive divergence and all these factors that come into play. Just the mainnet launch and ETH going to 10,000 basically sends this to a 30-50 million market cap.
Cult DAO and Satoshi Nakamoto share a common ethos of decentralization and anti-centralization. We need to embrace this notion and bring back the power to the many. If CULT DAO hits 1.4 billion dollars, the treasury funds would be in the millions; we fund our own future.
moduluszk.io
cultdao.io
cultdao.io
coinmarketcap.com

BITCOIN Monthly RSI Heatmap reveals ultimate Cycle Sell Zone!Bitcoin (BTCUSD) has resumed the long-term bullish trend and as of the writing of this analysis, it is about to test the $100k key psychological level. Now that the Bull Cycle is entering its final stage (most likely for the next 6 months at most), it is time to see potential exit levels as close to the expected Top as possible.
There is no better long-term indicator to assist us on this than the 1M RSI, which historically offers a great level to Sell when it enters the 0.786 - 1.0 Fibonacci range of its Channel Down. Currently it is still considerably distanced from that Zone, so the upside potential despite the recent break-out, is huge.
The Sine Waves indicate that in symmetrical terms, the Cycle Top should be priced around November 2025 (previous ones on November 2021, December 2017, December 2013). The closer the 1M RSI is to this date when it enters the 0.786 - 1.0 Fib Zone, the better as the higher the price will most likely be.
Based on this Cycle's Channel Up (blue), a fair Cycle Top range would be $150k - $200k. Would you agree? Feel free to let us know in the comments section below!
-------------------------------------------------------------------------------
** Please LIKE 👍, FOLLOW ✅, SHARE 🙌 and COMMENT ✍ if you enjoy this idea! Also share your ideas and charts in the comments section below! This is best way to keep it relevant, support us, keep the content here free and allow the idea to reach as many people as possible. **
-------------------------------------------------------------------------------
💸💸💸💸💸💸
👇 👇 👇 👇 👇 👇

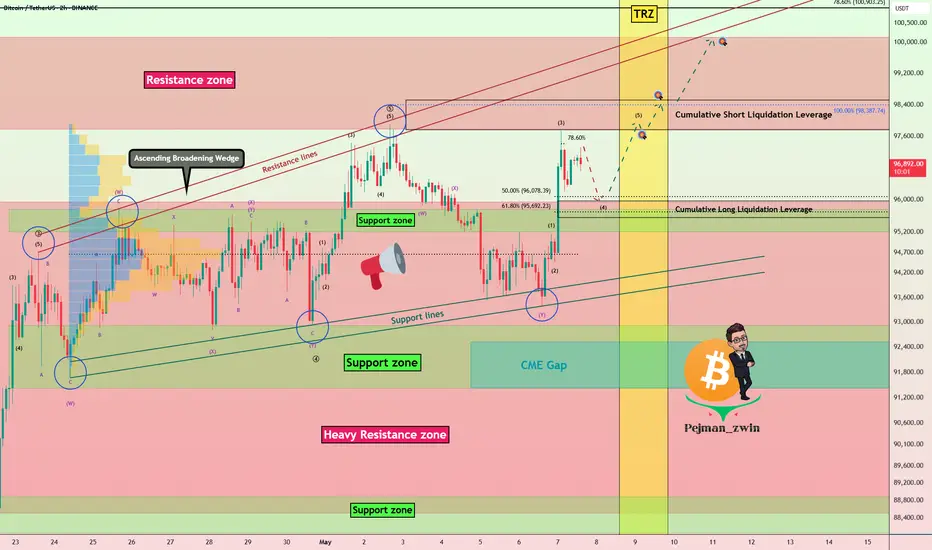
Bitcoin Breaks Heavy Resistance Zone— But Can It Hold?Bitcoin ( BINANCE:BTCUSDT ) started to rise yesterday as the S&P 500 Index ( FOREXCOM:SPX500 ) opened and it seems like it can break the Heavy Resistance zone($95,950-$88,500 ) this time, but there are still concerns from a technical analysis , so please stay tuned for this analysis .
Bitcoin is moving near the Resistance zone($100,200-$97,700) and has broken through the Heavy Resistance zone($95,950-$88,500) with good momentum .
In terms of Elliott wave theory , it seems that Bitcoin has completed microwave 3 near the Resistance zone($100,200-$97,700) and we should wait for the completion of microwave 4 . The microwave 4 can be considered a pullback to the Heavy Resistance zone($95,950-$88,500 ).
I expect Bitcoin to drop to at least $96,000 and is likely to touch the Support zone($95,760-$95,200) and start rising again, since microwave 3 was with high momentum , it is possible that microwave 5 will even be truncated . The targets I have indicated on the chart can be the target of a long position .
If you are looking for a Bitcoin reversal, you can focus on the Time Reversal Zone(TRZ) . The next major pivot will likely be within this time zone .
It seems reasonable to open a Long position near the Support zone($95,760-$95,200) , and it can give us a good Risk-To-Reward . What do you think?
----------------------------------------------------
My concerns for Bitcoin's continued bullish trend:
Because Bitcoin's correlation with US stock market indices , especially the SPX500 , is higher than in previous weeks, my analysis is that there is a re-correction in the SPX500 index , which could prevent Bitcoin from continuing its upward trend .
The Ascending Broadening Wedge pattern is likely to complete, which could cause Bitcoin to fall further if the lower lines of this pattern are broken.
If tensions between Pakistan and India increase, it could prevent Bitcoin from growing further.
----------------------------------------------------
Also, Today, the Federal Funds Rate is scheduled to be announced.
Let’s take a look at how this decision — along with Powell’s speech — might impact Bitcoin . Be cautious with your positions during the announcement and Powell’s remarks, as markets may become volatile.
Holding the rate steady is a signal of monetary policy stability, which could give risk assets like Bitcoin some breathing room in the short term.
Given recent U.S. economic data, markets are mainly focused on Powell’s tone during the press conference. If he adopts a dovish stance (hinting at potential rate cuts), this could support Bitcoin’s upward momentum.
However, if Powell emphasizes that rates will remain elevated for an extended period, we might see a temporary wave of selling pressure in the market.
Stay alert and manage your risk wisely — high-impact events like this can lead to sharp moves in crypto.
----------------------------------------------------
Cumulative Short Liquidation Leverage: $98,511-$97,774
Cumulative Long Liquidation Leverage: $95,966-$95,550
Note: If Bitcoin falls below $94,400, we can expect further declines.
Please respect each other's ideas and express them politely if you agree or disagree.
Bitcoin Analyze (BTCUSDT), 2-hour time frame.
Be sure to follow the updated ideas.
Do not forget to put a Stop loss for your positions (For every position you want to open).
Please follow your strategy and updates; this is just my Idea, and I will gladly see your ideas in this post.
Please do not forget the ✅' like '✅ button 🙏😊 & Share it with your friends; thanks, and Trade safe.
"Bitcoin Analysis" (Update)The price has reached the 0.78 Fibonacci level, and as you can see, there is a low probability that this level will be broken. I expect that, from a technical perspective, the price will form a double top here and then decline to the Fibonacci levels. After reaching the support levels, I anticipate a strong push to GETTEX:98K . Additionally, the tensions from the India-Pakistan conflict could drive the price downward.
Stay Awesome , CobraVanguard

BITCOIN Mirror fractal from the past calls for massive rally!Bitcoin (BTCUSD) appears to be repeating almost the exact same price action as mid-late 2020 as it has broken above the Pivot trend-line that separates the recent distribution from the 2nd Accumulation phase and has successfully re-tested it while the MA50 (blue trend-line) is holding as Support.
If the latter continues to hold, then it might fuel a massive rally similar to October 2020 - April 2021. As you can see both fractals started of with a 1st Accumulation Phase (blue Rectangle) being supported always by their respective MA200 (orange trend-line), which led to the eventual Distribution Phase (red Arc). Even their RSI sequences are identical.
Is this another pattern supporting that BTC will reach at least $150k next? Feel free to let us know in the comments section below!
-------------------------------------------------------------------------------
** Please LIKE 👍, FOLLOW ✅, SHARE 🙌 and COMMENT ✍ if you enjoy this idea! Also share your ideas and charts in the comments section below! This is best way to keep it relevant, support us, keep the content here free and allow the idea to reach as many people as possible. **
-------------------------------------------------------------------------------
💸💸💸💸💸💸
👇 👇 👇 👇 👇 👇

Bitcoin Still Stuck in Resistance – Eyes on CME Gaps & USDT.D%Bitcoin ( BINANCE:BTCUSDT ) touched $92,830(first target) and started to rise as I expected in the previous idea . Overall, Bitcoin has been moving in a range for about 12 days .
Note : In general, trading in a range market is more difficult than in a trending market . If your performance in a range market is not good, it is better not to trade until the trend is clear (this is just a suggestion).
Bitcoin is currently trading at a Heavy Resistance zone($95,950-$88,500) and has failed to break through it, and it seems like Bitcoin needs more momentum to break through this zone. Do you think Bitcoin will finally break through the Heavy Resistance zone($95,950-$88,500)?
In terms of Elliott Wave theory , it appears that Bitcoin has completed a five-wave impulsive and we should expect Corrective waves .
The analytical conditions of the Bitcoin chart have been a bit ambiguous in the past few days, so it's better to take a look at the USDT.D% ( CRYPTOCAP:USDT.D ) chart to increase the accuracy of Bitcoin analysis .
USDT.D% failed to break the Support zone(5.13%-4.95%) after several attacks. It currently appears to be forming an Ascending Broadening Wedge Pattern . It appears that USDT.D% needs to complete this pattern to break the support zone, and if this pattern fails , we should expect further increases =Bitcoin crash .
I expect Bitcoin to decline to the Support zone($92,910-$91,414) , 21_SMA(Weekly) and Cumulative Long Liquidation Leverage($93,359-$92,296) and probably fill the CME Gap($92,525-$91,415) this time and then start to rise and prepare to break the Heavy Resistance zone($95,950-$88,500) and fill the CME Gap($97,680-$96,455) .
Cumulative Short Liquidation Leverage: $98,989-$97,924
Note: If Bitcoin breaks below the Support zone($92,910-$91,414), we should expect further declines.
Please respect each other's ideas and express them politely if you agree or disagree.
Bitcoin Analyze (BTCUSDT), 1-hour time frame.
Be sure to follow the updated ideas.
Do not forget to put a Stop loss for your positions (For every position you want to open).
Please follow your strategy and updates; this is just my Idea, and I will gladly see your ideas in this post.
Please do not forget the ✅' like '✅ button 🙏😊 & Share it with your friends; thanks, and Trade safe.

BITCOIN Climbing the Fibonacci Staircase..Bitcoin (BTCUSD) has come into the Fed Rate Decision week stronger that ever, having staged an impressive rebound from the early-April Low. The consolidation of the last few days is of course a market reaction in anticipation of the big interest rate news.
Regardless of that, the Channel Up that is the underlying pattern from the start of this Bull Cycle has been filling on an impressive symmetrical scale all .382 Fibonacci extensions one by one. The most recent has been the 4.382 and naturally the next in line is the 5.382 Fibonacci extension.
Since the last one (4.382) was almost hit before the price pull-back, it would be more fitting to assume the next peak slightly below the 5.382 Fib ext as well as $170000.
This may very well be the final High i.e. the Cycle's Top before the next Bear Cycle begins, depending on the time it hits it.
Do you think that would be the case? Feel free to let us know in the comments section below!
-------------------------------------------------------------------------------
** Please LIKE 👍, FOLLOW ✅, SHARE 🙌 and COMMENT ✍ if you enjoy this idea! Also share your ideas and charts in the comments section below! This is best way to keep it relevant, support us, keep the content here free and allow the idea to reach as many people as possible. **
-------------------------------------------------------------------------------
💸💸💸💸💸💸
👇 👇 👇 👇 👇 👇
