Bitcoin strong spot 22600Bitcoin had a strong spot at 22600 and now Bitcoin has resumed a bullish trend.
Bitcoinsignals

BITCOIN starting a recovery similar to post COVID.Bitcoin (BTCUSD) has been trading within a very structured Channel Up following the June 19 Low. Both charts are on the 12H time-frame, which illustrates remarkable similarities between the current pattern of 2022 and that of late 2019/ early 2020 following the COVID bottom.
As you see at the moment, the price has turned the 12H MA50 (blue trend-line) into a Support, with the 12H MA200 right above, posing as the Resistance. The 1W RSI has just crossed above its MA (yellow trend-line) putting us potentially in the exact same position as late April 2020. As you see, BTC was also within a Channel Up at the time that eventually broke above the 12H MA200.
However due to the instant recovery on the March 13 2020 bottom and the price jump attributed to the expectation that the trillions of USD printed will keep the economy moving from the lockdowns, that Channel Up was formed much higher than the current one, which is technically a Bear Cycle bottom. Typically their transition is slower. I have plotted the 2020 recovery sequence on today's price action in order to make one possible projection.
As you see, many aspects on the two patterns are similar: both had their MA50 and MA200 cross three times before the bottom, both got rejected on the 0.786 Fibonacci, their Lower Lows were roughly on a -35° angle and both rebounded on the 1W MA300 (red trend-line).
Do you think we will have a similar recovery to that of post COVID? Feel free to share your work and let me know in the comments section below!
--------------------------------------------------------------------------------------------------------
Please like, subscribe and share your ideas and charts with the community!
--------------------------------------------------------------------------------------------------------

Is The Bottom In?There is a lot of evidence that we have bottomed and I will be presenting all here in this TA.
1. Every cycle bottom we form a triangle formation that eventually breaks to the upside, as you can see in the charts it happened last two times and this time we did the same and have currently broken to the upside.
2. The Mayer Multiple extreme levels! , I go over this in the TA below how Bitcoin was in extreme lows. We even bounced off the last Mayer band like previous cycles .
3.The LMACD was in the same place as the last two cycles and lined up perfectly with the weekly springboard which I cover here .
4. Bitcoin Super Cycle indicator flashed the cycle bottom and before anyone asks this is not a lagging indicator it is real time and happened to see it flash the bottom live while I was on the candle .
5.USDT dominance , this one is really important .
As you can see this channel USDT dominance is in , and can pinpoint tops and bottoms . The fact is we hit an extreme on the channel and stockistic has printed bearish divergence on the weekly.
6.Funding rate has finally made a lower higher , since the start of the year funding rate has been making lower lows as of 30th of June we finally got a lower higher , here is a link to the graph ibb.co
7. All major CME gaps closed .
That last swing low the 30th of June which created the lower high on the funding rate , closed the gap at 18.4k .
8.Crypto Market cap excluding Bitcoin
This chart has formed a hard bottom, finding strong support previous all time high , creating weekly springboard and also creating weekly bullish divergence on the stockistic at the lower level which you can see leads to big rallys.
Price has currently created a W formation on the daily which has a technical target of 25k if completed .
Price on the 4h looks good , creating an ascending channel and above MTF VWAP .
Conclusion
1.Cycle bottom Triangle patterns
2.Mayer Multiple Extremes
3.LMACD same as last two cycle lows
4.Bitcoin Super cycle indicator flashes bottom
5.USDT dominance hit top of channel
6.Funding rate lower high
7.All Major CME gaps closed
8.Crypto Market Cap excluding Bitcoin bottom
So as you can see there alot of signs pointing to a market bottom, time shall tell in a few months.

Bitcoin- "The Good, The Bad and The Ugly"... ScenariosHi traders, in this post I will share my 3 scenarios on BTC, because, even if I bought BTC and some other coins, I was only slightly bullish to begin with, and this optimism is fading with every hour.
The Good scenario:
- This is very obvious for everybody (or at least 90%) from TV see it: BTC will hold above 22k, will rise, the bear market is over and all will hold hands, sing "Kumbaya" and meet "to da mun" to drink beer
The bad scenario:
- BTC will break 22k, will go under 20k, reverse again, hover around 20k with spikes up and down for who knows how long and only market makers and speculators will make money (not so sure about the second)
The Ugly scenario:
- BTC will break 22k but, instead of holding and hovering around 20k, will make a new low and will have another aggressive leg down, probably in the 12-13k zone and will see from there
And... although, as I said, I'm in a buy trade at this moment, I'm almost sure it will not be the "Good scenario"

Bitcoin Scalping Signal for Day Trading🖥️ We have determined there is a 65% chance Bitcoin will Fall from our current entry point.
📉 SHORT BTC - Entry Price : $23,220 📉
💵 Length of trade: we are expecting BTC to hit a $250 scalp, with a high end of $600, and a minimum expectation of $200.
🕰️ Duration of trade: we are expecting this to occur within 4 hours of this signal, with a maximum duration of 6 hours .
We would ideally like to exit this trade prior to U.S. markets opening. But if the SP & Dow appear to open negative then we wouldn't mind holding it. Also, if European market close poorly, then that could help indicate the US markets might not be strong.

BITCOIN correlation with Nasdaq on market bottoms.Rally imminentThis is a simple long-term analysis on the 1M (monthly) time-frame, comparing Bitcoin (BTCUSD) to Nasdaq (NDX), with a focus on their market bottoms. On the left chart I have Bitcoin's price action with Nasdaq on top of it (green candles) and on the right, Nasdaq alone. Both have their respective RSI sequences below them.
As you see, BTC has been (naturally) following closely the tech index over its years, being a technological breakthrough itself. What's even more interesting, is that during every BTC Bear Cycle, Nasdaq only pulled back later (and some times much later) into the Cycle. This somewhat validates our belief that the true top during BTC's current Cycle has been in April 2021 and not November 2021, which coincidentally was when the Nasdaq topped and started correcting.
On July's monthly candle, we saw a strong reaction on both assets. Note that this is the first 1M green candle after three straight monthly losses. Nasdaq in particular hadn't seen this since December 2018. So right now the two seem to be in sync and the positive news for Bitcoin come from the NDX's long-term behavior. As you see on the right chart, July's rebound came after June made a (near) bottom on the 1M MA50 (blue trend-line). Such rebounds following near hits on the 1M MA50 have been the ultimate buy entries on Nasdaq since the recovery started after the 2008/09 Housing Crisis (more specifically since July 2010). As a result it is much more likely that this is the start of a new long-term rally on the tech index. With its correlation with Bitcoin being so tight at the moment, this is more likely to be the start of the new Bull Cycle as well.
Last but not least, notice that both on BTC's and NDX's 1M RSI sequences, the price is currently retesting the prior Support as a Resistance. A break above it is technically a very bullish sign.
So do you think that the Nasdaq can now drag Bitcoin to a new powerful rally? Feel free to share your work and let me know in the comments section below!
P.S. Because the chart on the left has two assets together, it may appear distorted based on your screen's/ browser dimensions. The original looks like this below, so if yours doesn't, adjust the vertical axis in order to make it look like this and better understand what is illustrated:
--------------------------------------------------------------------------------------------------------
Please like, subscribe and share your ideas and charts with the community!
--------------------------------------------------------------------------------------------------------

Pain Before Relief Rally This chart right here was one of the reasons I have been right on the money all of 2022 , I always take a look at it before going in for any trade.
There is a high chance this bounce ends when we hit this white trendline for USDT, the last two touch points are major Bitcoin events.
First touch was an all time high in November 2021 and second was April 5th 2022 which was a very important pivot down and even made a TA on it .
So using the last three cycle bottoms as data we can have a potential timeframe on when this bounce can end.
If we take a look here at the daily you can see we are currently repeating very similar patterns like past cycles , so according to this we will top out sometime mid August and then begin a retrace that will scare everyone, this also fits with USDT hitting the white trendline about that timeframe.
At this point Bitcoin will most likely be at around 29k closing the CME Gap , once that's filled the big bull trap will start and a retracement down the 0.618 at 22.5k will most likely happen.So a red september is likely , nearly all the Bitcoin Septembers have been red so it also fits nicely.
If this does happen , expect mass fear , FUD , 10k calls, mass short positions etc but then come October 2022 is when the relief rally starts for real. The amount of Fib time dates I have October is crazy , something big happens that month and as you can see the picture above of the bar patterns with cycle bottoms , October is 108days from cycle bottom which is when Bitcoin historically starts its massive momentum and will also be the moment USDT breaks the white trendline (Green circle) like it did to start the last rally.
Everything is lining up perfectly for these events to unfold just like last cycles. If i'm correct this rally will last 140days from October 2022 to February 2023 then it's time to short because its possible Bitcoin will start heading down for its second capitulation phase , check the TA below lines up with the Dow Jones rising wedge.

Bitcoin Scalping Signal for Day Trading🖥️ We have determined there is a 60% chance Bitcoin will rise from our current entry point.
📈 LONG BTC - Entry Price : $23,700 📉
💵 Length of trade: we are expecting BTC to hit a $300 scalp, with a high end of $500, and a minimum expectation of $175.
🕰️ Duration of trade: we are expecting this to occur in 3.5 hours of this signal, with a maximum duration of 9.5 hours . Sometimes weekends can drag out or have fast spikes up, more so than weekdays.

Bitcoin Scalping Signal for Day Trading🖥️ We have determined there is a 70% chance Bitcoin will Fall from our current entry point.
📉 SHORT BTC - Entry Price : $23,825 📉
💵 Length of trade: we are expecting BTC to hit a $200 scalp, with a high end of $700 and a minimum expectation of $125.
We Think there might be a Bounce at $23,650.
🕰️ Duration of trade: we are expecting this to occur within 2 hours of this signal, with a maximum duration of 7.5 hours .
we feel this trade could be a quick drop down, then retrace , so set take profits.
❗📰📈 Bitcoin Hit 23,000 on BitMex Friday, and only on BitMex. This might be a premonition for what could happen today, be mindful of this.

BITCOIN bottomed and prepares the post summer rallyAn increasing number of long-term indicators have been showing lately that Bitcoin (BTCUSD) is past its bottom for this Bear Cycle. On this analysis I am shifting to an even longer-term time-frame, the 4W, using an overlooked but often very powerful indicator: the Williams Alligator.
During the past two Cycles, the bottom was formed when the green trend-line (lips) crossed below the red trend-line (teeth). On both of then that took 15 bars from the Top of the previous Bull Cycle. Then the green trend-line Bearish Cross below the blue trend-line (jaws) ushered the Accumulation Phase and it wasn't until the red trend-line crossing below the blue that we had the final signal of the first strong rally of the new Bull Cycle.
This time the Green/ Red Bearish Cross took place on the current candle, 17 bars this time from the top. The Green/ Blue Bearish Cross has been formed on the September 12 candle, while the Red/ Blue on November 07 2022. As result this prints a quite reliable roadmap on how BTC's price action might trade in the coming months. It basically suggests that by late October, Bitcoin could be ready for a strong end-of-the-year rally.
At the same time, we shouldn't ignore the, always reliable on long-term projections, RSI indicator. This shows that it hit the Support, which has formed the bottoms of 2014 and 2018, two candle's ago and is now rebounding. Additional strong information is that when the RSI broke above its MA (yellow trend-line), the rally started.
Do you agree with the Williams Alligator that the bottom is behind us and we've entered the Accumulation Phase of the new Bull Cycle as BTC prepares for a Q4 rally? Feel free to share your work and let me know in the comments section below!
--------------------------------------------------------------------------------------------------------
Please like, subscribe and share your ideas and charts with the community!
--------------------------------------------------------------------------------------------------------

BTC finds resistance at $24,435Bitcoin has found resistance at $24,435.
A pull back here will be a healthy correction.
MACD and RSI are neutral at this point so there might be a slight push up.
ENTRY - $23,740
TP 1 - $22,825.40
TP 2 - $21,829.60
TP 3 - $21,024.90
SL - $24,435.00

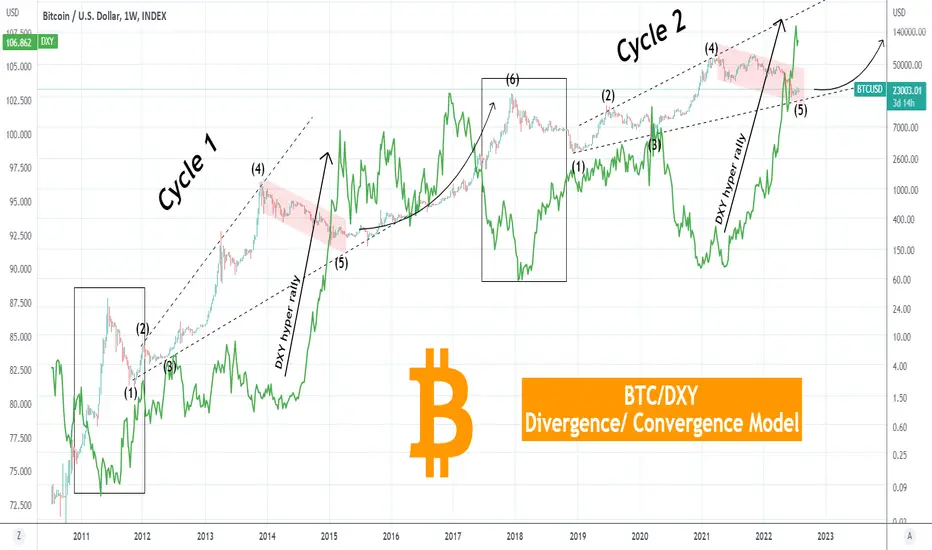
BITCOIN A mind-blowing approach to Cyclical Theory based on DXY This is an alternative representation of Bitcoin (BTCUSD) and its Cyclical behavior based on the long-term price action of the U.S. Dollar Index (DXY). A simple yet eye-opening approach that links BTC to the USD more than any other asset.
** Traditional Cycle Theory vs BTC/DXY Divergence/ Convergence Theory **
Traditional theory suggests that Bitcoin's current Bear Cycle is the 4th one. The 1st was in June - November 2011, 2nd in December 2013 - January 2015, 3rd in December 2017 - December 2018 and 4th (current one) in April 2021 - now. However this BTC/DXY Divergence/ Convergence Theory shows that Bitcoin could only be trading on its 2nd ever Historic Cycle and in fact preparing for the final rally that will complete it (curved arrow).
** DXY hyper rally and BTC Bear Phase **
How's that so? Well by looking at the DXY (green trend-line on your chart), we see that the hyper rally it has been trading on since May 2021 is identical to that of March 2014 - March 2015. Both started a few weeks after Bitcoin peaked (4) and started a Channel Down correction (Bear Phase) that would find a bottom (5) and prepare for the final rally. When that happened in mid 2015, the DXY had peaked and turned sideways for an extended period of time (almost a year). Bitcoin's final rally peaked (6) when DXY bottomed.
** The Cycle's Bullish Megaphone pattern **
But what led to this Bear Phase (4-5) and rally (6)? Well it was a period of volatility on DXY which formed a Bullish Megaphone pattern on Bitcoin. The early phase of the pattern (1-2-3) was accumulation after BTC's rally peak (6) when DXY had recovered from its April 2011 bottom and traded on high volatility and as this sideways move progressed, BTC gained power. Notice the huge Divergence (Rectangle pattern) where Bitcoin peaked (6) and DXY bottomed that was what paved the way for Bitcoin's Megaphone. The Convergence happened on Phases 1-2-3.
** This is Bitcoin's only 2nd Cycle **
As you have noticed, this is the exact same pattern that Bitcoin and DXY haven been trading in since December 2018. The Divergence led to the Convergence of the two and creation of the new Megaphone (1-2-3), which based on the model is just its 2nd Cycle ever. DXY's hyper rally that started in May 2021 following the crash of March - December 2020 due to the COVID trillion rescue packages, which distorted DXY's true bottom, gave rise to the April 2021 - now Bear Phase (4-5).
This is where we are today. With the DXY on a 1 year hyper rally, which has most likely reached its top as its identical March 2014 - March 2015 rally was completed in one year. If that's the case, then Bitcoin's Bear Phase has also bottomed and as discussed at the start of the analysis, it is entering the short accumulation phase that will initiate the final rally outside of the Bullish Megaphone, which validates being its only 2nd Historic Cycle.
But what do you think? Do you agree with the BTC/DXY Divergence/ Convergence Model indicating that we are only on Bitcoin's second every Cycle? And if so are we about to see the DXY turning sideways and a mega rally on Bitcoin? Feel free to share your work and let me know in the comments section below!
P.S. Because this chart has two assets together, it may appear distorted based on your screen's/ browser dimensions. The original looks like this below, so if yours doesn't, adjust the vertical axis in order to make it look like this and better understand what is illustrated:
--------------------------------------------------------------------------------------------------------
Please like, subscribe and share your ideas and charts with the community!
--------------------------------------------------------------------------------------------------------
Bitcoin monthly Timeframe in right place to longBINANCE:BTCUSDT
and now bitcoin in a right place to start buy and hold til around 80000$ .
mention : buy in 5 parts.

BITCOIN The ultimate Bear pattern slowly breaking to the upsideThis is a very interesting pattern that perhaps was ignored but paints Bitcoin's (BTCUSD) whole picture during this Bear Cycle.
** Mini Channels within Main Channel Down **
As you see the dominant structure has been a Channel Down but with the use of the Fibonacci Channel levels we can see that it can be divided into two secondary (mini) ones that seem to have almost the same trading pattern (the first (A) within the 0.0 and 0.382 Fibs and the second (B) within the 0.618 and 1.0 Fibs).
The RSI sequences tend to agree with that thesis and right now we are at the point after the mini Channel (A) broke above the 1D MA50 (blue trend-line), which following a pull-back to the 0.786 Fib, rebounded to the -0.236 extension. That happened to be on the 1D MA200 (orange trend-line) at the time and causing a rejection, kick-started mini Channel (B).
** The Bearish and Bullish extremes **
We may be missing an important detail though. By breaking above the 1D MA50 last week, BTC broke above the main Channel Down of the Bear Cycle. However it did a proportional break to the downside of the Channel on December 04, which I call (Bearish Extreme) and that came close to the -0.236 Fib. Similarly this may be the Bullish Extreme to the 1.236 Fib symmetry. A break above it, invalidates the bearish bias and breaks the main Channel Down completely to the upside, opening the way for a new pattern for the first time since the November 11 2021 All Time High (ATH).
As a result it would be ideal to break above the -0.236/1.236 Resistance cluster above as soon as possible to confirm the first pattern into the new Bull Cycle. Until then there seems to be heavy sell accumulation around 26k.
Do you think this is the ultimate pattern we've been ignoring for so long and if yes do you expect a break above the 1.236 Fib extension to take us into the new Bull Cycle? Feel free to share your work and let me know in the comments section below!
--------------------------------------------------------------------------------------------------------
Please like, subscribe and share your ideas and charts with the community!
--------------------------------------------------------------------------------------------------------

BTCUSDT important Fed meeting, FOMC Statement
P.S. Always do your own analysis before a trade. Put a stop loss. Fix profit in parts. Withdraw profits in fiat and reward yourself and your loved ones

Bitcoin Sell NowAccording to my chart analysis , bitcoin show strong signal to sell , sell btcusd Now

BITCOIN Closing of the month reveals the start of the rallyThis is Bitcoin (BTCUSD) on the 1M (monthly) time-frame. I am using various indicators to plot the current position relative to past Cycles and the more you add, the closer it looks that the market has bottomed.
** The importance of the LMACD **
As we have 1 week before the end of July, the monthly candle closing can reveal a lot, particularly in terms of the LMACD indicator. As you see in the past two Cycles, then the 1M LMACD histogram turned from dark red into light red, BTC had already priced its Cycle bottom. At the moment, the LMACD is exactly at the point where the past two Cycles bottomed. So giving a light red histogram next Monday (August 01) will most likely confirm the start of this Cycle's Accumulation Phase.
That Accumulation Phase, can be fast (2019) or slower (2015). It appears that closing above the 1W MA20 (blue trend-line) is the difference between having a faster or a slower phase into the new rally.
** The Gaussian Channel **
In any case, having held the 1W MA300 as Support as it did twice in 2019 and 2020, the price looks ready for accumulation. An indicator that I have never used on this time-frame, is the Gaussian Channel. However it provides excellent insight because, as you see on the chart, when the price (almost) touched its green trend-line on March 2020 and August 2015 (circles), a strong rally began. Right now this trend-line is closer than ever and if Bitcoin accumulates some more before breaking to the upside, it can hit it by November, if not sooner as it is aggressively rising.
In my opinion all the above paint a very promising 2nd half to the year for BTC that can end with an aggressive rally. Do you also see the LMACD as being the key for starting the new phase? Feel free to share your work and let me know in the comments section below!
--------------------------------------------------------------------------------------------------------
Please like, subscribe and share your ideas and charts with the community!
--------------------------------------------------------------------------------------------------------

Bitcoin next 6monthsI think it's possible that for the rest of the year Bitcoin plays out something like this , will know how close we are to playing this out if my by mid August we top out somewhere between 27-30k , I don't think we hit the 30k , I think most likely we close the CME gap at 27400 before heading back down.
This fakeout area is where everyone is going to be calling for that 12-15k Bitcoin and most likely the exact opposite will happen. momentum will start increasing. Just check out this recent discovery
On average from capitulation cycle bottom it takes Bitcoin about 108days before things start picking up , so if the same does happen October 2022 is the month.
Next we will have a 40-60day consolidation above or around 30k before we start the relief Rally going into the end of June 2022.

BITCOIN 1st step into the Bull Cycle successful. One left to go.This week's big development for Bitcoin (BTCUSD) has been the break above the 1D MA50 (blue trend-line) for the first time since April 21. On this analysis I compare the patterns of the current Bear Cycle and the past two in an attempt to find if this break can be a structured move into a sustainable recovery.
First of all, the time-frame on the candles is 1D (daily) but a lot of MA periods including the RSI and MACD indicators are displayed on the 1W because that prints a more complete picture. As you see the similarities of the current Bear Cycle with the past two are remarkable, despite it being an expanded flat correction as opposed to the other two which where sharp correction patterns.
** The Bear Cycle until now **
The RSI clearly shows that the top of the Cycle was in April 2021. That was followed by a sharp drop and rebound on the 1W MA50 (red trend-line), which is consistent with the past two Cycles. After the September - November 2021 pump that broke the sharp correction of the other two, the price quickly resumed the Bear Cycle model, was supported and rebounded near the 1W MA100 (green trend-line) to the 1W MA20 (yellow trend-line) where it was rejected. That initiated the final sell-off sequence of the Cycle, where the capitulation was again (as with the past two Cycles) evident by the 1W MA200 crossing below the 1W MA100. The June 18 bottom has been formed just above the -0.618 Fibonacci extension (counting as 0 the Low of the 1W MA50 test) and that caused a rebound that broke this week above the 1D MA50. As you see on the chart, all this has so far been remarkably consistent with the past Bear Cycles.
** What's next? **
To answer this we naturally have to look at how the past two Cycles traded. Following the 1D MA50 break-out, neither Cycle was able to post a sustainable rally. Instead, it was only when the price broke above the 1W MA20 and (especially in the case of 2015) above the 1W MA50 too, that the market was able to rally into the Bull Cycle. So naturally what we would like to see next to largely confirm a Bull Cycle turnaround, is a break above the 1W MA20, which currently is considerably higher, trading at 32700, but declining rapidly. Until then, we continue to be in an Accumulation Phase.
But what do you think about this comparison? Do you need to see a break above the 1W MA20 to confirm the recovery sentiment into a new Bull Cycle or feel that this week's break above the 1D MA50 is strong enough on its own? Feel free to share your work and let me know in the comments section below!
--------------------------------------------------------------------------------------------------------
Please like, subscribe and share your ideas and charts with the community!
--------------------------------------------------------------------------------------------------------

BITCOIN broke above both the 1D MA50 and 1W MA200! What's next?Bitcoin (BTCUSD) has now broken above both the 1D MA50 (green trend-line) and the 1W MA200 (orange trend-line). This is a critical benchmark as it last hit the 1D MA50 on April 21 (3 months ago exactly) and it has been trading below the 1W MA200 since the June 13 1W (weekly) candle (more than 1 month).
As I've mentioned before numerous times, since the 1W MA300 (red trend-line) held as Support as it last did during the early March 2020 COVID collapse, a break above those trend-lines would be the first and perhaps most decisive signal that the Bear Cycle has bottomed.
** The TSI and MFI **
Notice how the True Strength Indicator (TSI) and the Money Flow Index (MFI), two key indicators for Bitcoin, has printed the same sequences during both the March 2020 and December 2018 bottoms. The TSI now just needs to make a new Bullish Cross (first since August 2021) while the MFI a break above its Falling Wedge, in order to confirm a new rally similar to those of April 2020 - April 2021 (blue pattern) and February 2019 - June 2019 (green pattern).
** Two possible rallies ahead **
For comparison purposes I've plotted those two Rally Sequences on today's price action. Note that this is just an illustration in an attempt to project the trend's action if the same pattern is repeated. If this is indeed the bottom of the Bear Cycle and the beginning of a new Bull Cycle, then the price is more likely to post the less aggressive rally of early 2019 (which was still much stronger than the previous Bull Cycles) as Bitcoin tends to still accumulate after a market bottom and posts the aggressive rally of the Cycle after the Halving.
It is worth noting though that both projections show that they will make contact with the 1W MA50 (blue trend-line) almost exactly at the level they did when they originally played out. This is remarkable and goes to show that there is indeed a degree of symmetry between phases.
So do you think that the break-out above both the 1D MA50 and 1W MA200 has signalled the bottom of the Bear and start of a new Bull Cycle? If yes, what projection is more likely for you, the green to $80000 towards the end of the year or blue to $200000 by mid 2023? Feel free to share your work and let me know in the comments section below!
--------------------------------------------------------------------------------------------------------
Please like, subscribe and share your ideas and charts with the community!
--------------------------------------------------------------------------------------------------------

Bitcoin- Bulls must hold 22kOn Tuesday, after a consolidation day in resistance on Monday, Bitcoin managed to break above 22k important confluent resistance, given by the horizontal level and the falling trend line from April.
The main cryptocurrency is in a correction of this first leg up now and a new wave of buying could follow.
The levels to keep in sight are 25.5k and the important 28.5k resistance, but bulls must hold above support.

BTC Pump Coming - Target $24,42915M and 1H RSI has reset and looks to favour a pump.
TP 1 - $24,108.7
TP 2 - $24,429
SL - $23,319.9

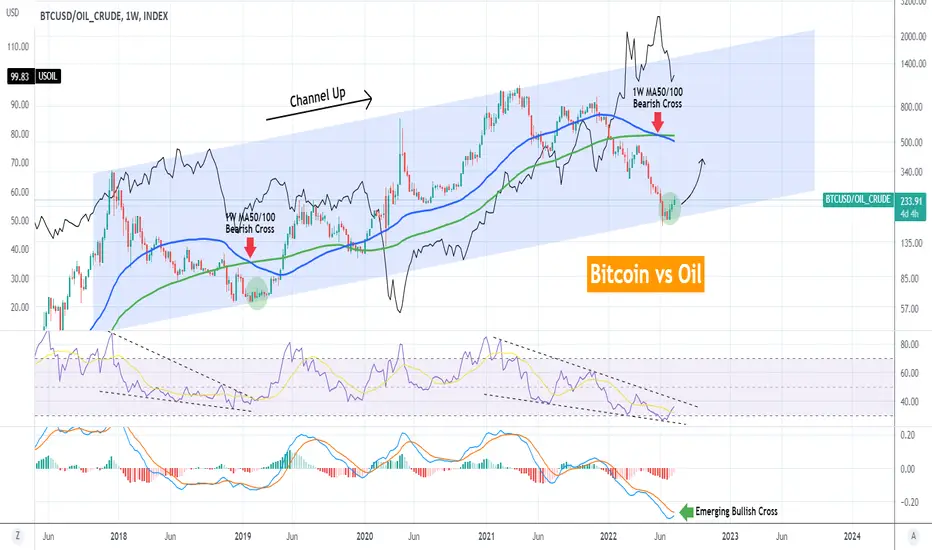
BITCOIN vs WTI Time to buy BTC and sell Oil. 4.5 year pattern!This chart represents the Bitcoin/WTI Oil ratio and reveals an interesting finding regarding where both markets could be headed. Since December 2017, the ratio has been trading within a Channel Up pattern. Following a 1W MA50/100 Bearish Cross (blue trend-line crossing below the green trend-line respectively) in January 2019, the symbol bottomed and started rising, indicating that Bitcoin gained strength against WTI Oil.
Today it appears we have a similar bottom behind us, as WTI Oil (black trend-line) has been dropping aggressively since late May, while BTC has been rising since June 18. Notably, that took place exactly on the Higher Lows trend-line of this 4.5 year old Channel Up. The 1W RSI is about to test the top of its Falling Wedge, just like in February 2019. A break above it, technically confirms the bottom bias and the sentiment for an upcoming rally on Bitcoin.
Basically this tells long-term investors that hold both BTC and WTI contracts, to ease on Oil and start growing their BTC portfolio holdings instead. Attention though, as despite its correction since May, this doesn't mean that WTI Oil has to drop more necessarily. This chart shows that BTC is more likely to outperform Oil during that time. They can both rise together just like it happened from Jan to April 2019 or October 2020 to April 2021.
--------------------------------------------------------------------------------------------------------
** Please support this idea with your likes and comments, it is the best way to keep it relevant and support me. **
--------------------------------------------------------------------------------------------------------