BITCOIN hit the 1DMA50 for the 1st time in 3 months! Whats next?Bitcoin (BTCUSD) hit today the 1D MA50 (blue trend-line) for the first time since April 21. There are various patterns and trend-lines to consider at the moment, but mostly I want to bring forward the similarities with the November 2021 - March 2022 drop.
** Fractal comparison **
That sequence broke its 1D MA50 when first tested but pull-back back near its bottom shortly after. However it recovered equally quickly and tested both the 1D MA100 (green trend-line) and the 1D MA200 (orange trend-line). The 1D MA200 proved to be the ceiling of that potential recovery as the price got rejected exactly there, which happened to be just over the 0.5 Fibonacci retracement level. It is worth noting that both sequences made their bottoms around the same time from their tops (75 and 82 days respectively). Also note the similarities on the RSI structures. The 1D MA50 test coming after the RSI broke above its most recent Resistance.
** Level's to consider now **
The 1D MA50 test on today's sequence, comes at exactly the same level with the Lower Highs trend-line from the top. That could add extra rejection pressure. In addition, it is exactly on the Higher Highs (top) trend-line of the small Channel Up pattern that has been formed since the June 18 bottom. As a result, that's technically a triple level Resistance.
A break above the 1D MA50, naturally targets the 1D MA100 and similarly above that, targets the 1D MA200. If the Nov-March fractal tells us anything, its that the market shouldn't be expecting a long-term bullish reversal before closing above the 1D MA200, which has been containing the price action below it since December 31 2021, so practically for the whole year!
Do you think its time to change that? Would a break above the 1D MA50 signal a bullish reversal, for the short-term at least? Feel free to share your work and let me know in the comments section below!
--------------------------------------------------------------------------------------------------------
Please like, subscribe and share your ideas and charts with the community!
--------------------------------------------------------------------------------------------------------
Bitcoinsignals

MATIC price analysisHey guys,
MATIC has been outperforming every other alt coins in this relief rally, as bitcoin is trading in the fixed zone from past 28 days currently it's heading towards the resistance zone while majority of the coins are forming bullish breakout conditions, coming days are gonna very crucial for entire crypto market. Irrespective of our thoughts, we have to move along with the market.
Moving to the MATIC chart, it's been in nice uptrend until it got struck in between the range $0.68 and $0.72, here what i am expecting, as it heading towards the local range support zone, we can observe that the sell pressure is decreasing, ofc anyone can say it by simply looking at the volume. Now what ?
I'm looking for the long entry opportunity here in this local support zone, not that i'm rigid to this plan, execution completely depends on the market sentiment at the time of entry.
End of the chart analysis, I'll post my trade setup on MATIC here soon.
Stay Updated - everything provided here is not a financial advice.

BITCOIN and S&P500 Can they both find support on the 0.382 Fib?This is an interesting comparison of Bitcoin (BTCUSD) and the S&P500 (SPX) index. As you see during their last market corrections, they both found Support on the 0.382 Fibonacci retracement level (December 2018) from the previous low, and formed bottoms (exception for S&P500 the COVID crash).
Both have been trading below their 1W MA50 (blue trend-line) for the majority of the year, making this correction, a 6 month Bear Phase so far. At the moment, they are both again on their respective 0.382 Fib levels, counting from their Dec 2018 Lows. So far the level has been holding for 4 weeks straight. Do you think the 0.382 Fib will work its magic again and put an end to this correction?
Feel free to share your work and let me know in the comments section below!
--------------------------------------------------------------------------------------------------------
Please like, subscribe and share your ideas and charts with the community!
--------------------------------------------------------------------------------------------------------

Magic (235k October 2026)There is 100% chance that this is going to be correct , in no way is this going to fail because im using magic .

BITCOIN The bottom is in based on RSI-Sine Wave structureThis is a very unique approach on Bitcoin (BTCUSD) where I take into consideration the wave length of the RSI on the 1W time-frame in an attempt to identify potential correlations with Cyclical behavior. The result is striking and aligns almost perfectly with Cycle Bottoms.
The first step is to turn to the 1W RSI and calculate the middle of the wave length that starts on one bottom and ends on the next. It is interesting to notice how the waves overlap as they contain all of the RSI action. This gives us the top of the wave which in candle terms it is far from the top of the Cycle. In fact it is at the start of the parabolic rise of the Bull Cycle.
If we take the Sine Wave tool and draw the peak on those RSI peaks, we see that the bottom of the Sine Waves on each BTC Cycle is almost on the actual bottom. And for the current Cycle that was on last week's (1W) candle. With the 1W MA300 (red trend-line) supporting so far, all the price action needs to do in order to confirm that is break above the 1W MA200 (orange trend-line) below which we're trading for the past month.
Do you think the bottom is in for Bitcoin? Feel free to share your work and let me know in the comments section below!
--------------------------------------------------------------------------------------------------------
Please like, subscribe and share your ideas and charts with the community!
--------------------------------------------------------------------------------------------------------

The most important chart in cryptoUSDT dominance continues to be the most important chart in crypto to look at. Its is so good and calling tops and bottoms and general moves in the market.
April 5th 2022 i posted this TA
The most important triangle of the year! guess what date the USDT dominance started its parabolic move April 5th 2022!
Bitcoin was 48k at the time, this is the most important chart to be looking at because it will call the exact time the relief rally will start or atleast a breakout into a higher range for Bitcoin maybe 22-30k range.
As it stands USDT seems to be hitting a wall of resistance , since July it has failed to break this level time and time again which is a very good sign that we are in fact bottoming out.
If USDT fails to break this resistance by 28th of July 2022 it will officially break the ascending channel which could trigger some sort of rally.
It is important to note that this ascending channel is within a much larger marco channel that I cover on other TAs.

Bear flag breakdown to 11.2k (BTC)Another bear flag with possible W formation on USDT dom chart ,hopefully its the last bear flag lol
Breakout USDT dom target would be previous all time high.

BITCOIN Clash of theories and the possibility of 10K as bottomBitcoin (BTCUSD) is on the 4th straight week of sideways trading following the mid June low. By doing so, it reached the bottom (Higher Lows) trend-line of a Channel Up pattern that fits perfectly BTC's price action since April 2013. With the LMACD hitting the Support trend-line of Feb 2015, all this looks like a Cycle bottom but let's examine this more carefully with the help of additional indicators.
** The Channel and its extremes **
As you see on this chart, the price action has broken above the Channel Up only twice these 9 years and that was during the formation of the November 2013 and December 2017 Cycle Tops. Those Bullish extremes took place exactly on the 1.5 Fibonacci extension. There hasn't yet been a break below the bottom of the Channel but it is possible to do so if the price action fails to hold the Higher Lows trend-line in the coming weeks.
** The Bearish extreme argument to $10000 **
If it does fail, then we may very well see the first Bearish extreme and what better candidate for a bottom than the symmetrical Fibonacci level of -0.5. Bottoming there makes a perfect fit for an approximately -86% drop from the Cycle Top, which is a consistent correction percentage with all previous Bear Cycles. That would pull Bitcoin down to marginally below the 10k USD level.
** The LMACD **
As mentioned before the LMACD is on the Support level that marked both previous Cycle Bottoms. If this fails, it could be a first indication that we will be going for that first Bearish extreme of the Channel. On the bullish side though, if it holds, it validates this historic pattern which on the upside has two Lower Highs trend-lines that shape Cycle Tops. The oldest one that started in June 2011 has projected all Highs below the last two Cycle Tops. Since Dec 2017 it is the Diverging Lower Highs trend-line that marks the actual Cycle Tops. As a result, if the LMACD Support holds, keep an eye for a rather vast visit to the 2011 LH line for a first rally high similar to June 2019.
But what do you think about that? Do you expect the Channel to hold or go for a -0.5 Fib Bearish extreme of around 10000 USD completing a -86% drop? Feel free to share your work and let me know in the comments section below!
--------------------------------------------------------------------------------------------------------
Please like, subscribe and share your ideas and charts with the community!
--------------------------------------------------------------------------------------------------------

Symmetrical Triangle breakdown can take Bitcoin price to $17,000Bitcoin price was unable to hold the support line & printed a low $19,221 yesterday. A clear breakdown & retest of symmetrical triangle can be seen on the chart. Previously, on June 4th a breakout & retest was witnessed & then price rallied all the way up & met the target of 17%.
This time the distance of symmetrical triangle is 11.54%. If it follows the same pattern then price call fall till $17,094. This structure will be invalidated if 4H candle of BTC closes above $20,080.
Today, CPI reprot will be released. Market ca be highly volatile. Overall, chart looks bearish.

Plan for the next 350daysThis year might be boring for Bitcoin but come January 2023 we will start a massive relief rally going to next summer.
This year it's time to buy as much as possible and stack then ride the wave up to the 0.618 to 48k , it's also the 8/1 Gann Fan.
The Date you get when the 0.618 Fib and 8/1 Gann Fann cross is late June 2023 , I do also have a Fib date around that time as well to back this theory up.
So now instead of spot buying I will be buying BTC x3 leveraged tokens on bybit and selling them once we hit 0.618 , far better than to keep a trade open and pay funding rate fees for months, it's simply not worth hassle especially if you were going to use x3 for your trade to begin with.
In around 350days Bitcoin will be back at 48k and everyone will be bullish and call the start of the bull market and at that point we will nuke to create the classic cycle double bottom that's when you spot buy for long term position at the end of July 2024.

BITCOIN Adam & Eve = a common bottom patternBitcoin (BTCUSD) failed to break above the 4H MA200 (orange trend-line) last week and the pull-back is testing the 4H MA50 (blue trend-line) today. Despite the short-term weakness, we have the completion of an encouraging pattern, the Adam & Eve (A&E).
I've displayed next to today's price action, three A&E patterns from recent history (Sep 2020, March 2020, Dec 2018), all of which formed bottoms on BTC. Notice the formation of a Golden Cross following the completion of all patterns. A new Golden Cross (when the MA50 crosses above the MA200) is close in today's sequence as well. In addition, the RSI sequences are also quite similar on all.
Do you think a break above the 4H MA200 confirms this pattern and essentially the bottom? Feel free to share your work and let me know in the comments section below!
--------------------------------------------------------------------------------------------------------
Please like, subscribe and share your ideas and charts with the community!
--------------------------------------------------------------------------------------------------------

Bitcoin- Up after confirmation of supportLast week, Bitcoin has broken above the descending trend line resistance of the symmetrical triangle and reached a high of 22.5k.
Now the main cryptocurrency is correcting this leg up and a new up move could follow.
20k zone is confluence support and in this zone, bulls can look for buying opportunities.
However, keep in mind that the trend is grossly down, and a break and close under this important support could lead to further losses and most probably to a new low under 17.5k

BITCOIN Bear Market ending this summer. Charting the next Bull.This is an analysis of Bitcoin (BTCUSD) on the 1M (monthly) time-frame where its long-term (historic) Cycles are best viewed. This is a combination of some previous studies of mine with adding the element of Cycle Channels instead of the Parabolic Growth Curve.
** The LMACD **
As you see those also effectively depict the notion of decreasing volatility and diminishing returns over time, which is a natural consequence of increasing adoption. This is also illustrated by the LMACD indicator (bottom pane), which shows slowing volatility and right now has completed 10 months in the red. During the previous Cycles, it recorded 10 and 12 months during the 2018 and 2014 Bear Cycles respectively before BTC formed the bottom. This shows that the bottom is either already in or should be priced by September.
** The Halvings **
Another factor that completely matches that date is the pre Halving nature of Bitcoin that during the previous two events, bottomed 17 and 18 months respectively for Halving 2020 and 2016. The next Halving (no 4) is expected for March 2024 and 18 months before the event, place the bottom this September as well.
** The MA Fibonacci multiples **
The added element of the MA multiples on this chart, gives a fresh idea of the huge Support offered by the 1.62X multiple (green line). Each Cycle though has found Support a Fib level higher each time. M21 (red trend-line) and M13 (orange trend-line), are the candidate levels for the Top of the upcoming Bull Cycle. That is currently within 107k and 173k approximately.
Do you also think the new Bull Cycle is closer than most expect? Feel free to share your work and let me know in the comments section below!
--------------------------------------------------------------------------------------------------------
Please like, subscribe and share your ideas and charts with the community!
--------------------------------------------------------------------------------------------------------

Bitcoin price actionBTCUSD showed a dead cat bounce after a massive sell-off.
Market eyes US Non-farm payroll for further direction.
Major support- $21000. Any break below will take the pair to next level $20000/

BITCOIN Gaussian Channel & RSI turning upwards. Bottom forming?Bitcoin (BTCUSD) is on the 5th straight week after the Gaussian Channel (GC) turned red on the 1W time-frame. In the past two Cycles, the market formed a bottom 6 weeks after the GC turned red on the December 10 2018 candle and 4 weeks on the January 12 2015 candle.
Additionally, the 1W RSI has reversed upwards after last week's double bottom. Those formation are consistent with all prior Cycle Bottoms. The 1W MA300 (red trend-line) is at 16790 and, as I mentioned numerous times, is the trend-line that supported BTC on March 2020, Aug 2015 and Jan 2015.
A case against the bottom can be made by the fact that the price is trading below the 1W MA200 (orange trend-line) for the 4th straight week. That has never happened before in BTC's history and is certainly a factor to worry about. In the event of a weekly (1W) candle close below the 1W MA300, the next trend-line that lastly supported a Bear Cycle was the 0.5 X multiple of the 1W MA300 on the October 17 and November 14 2011 Bottoms.
Do you think the above is enough evidence of a bottom being formed right not on BTC or you're expecting a break much lower than the 1W MA300? Feel free to share your work and let me know in the comments section below!
--------------------------------------------------------------------------------------------------------
Please like, subscribe and share your ideas and charts with the community!
--------------------------------------------------------------------------------------------------------

Bitcoin can rise to 25kAlthough the medium-term trend for BTC and Crypto market is bearish, at this moment bears seem incapable of a new low.
Since the recent 17.500 low the price is consolidating and a higher low could be in place at 18.500.
From a short-term speculative perspective, a rise to 25k is probable and has a comfortable R: R.
Buy dips under 20k can be a good strategy and a drop under 18k would negate this scenario

Bitcoin Trend Analytics July 7thBTC still runs within the box and forms a consolidation triangle in the downward channel.
The box: $22658.64~$18686.84
$18267.50 is the key support of the month
The consolidation range has narrowed down to $21699.20~$18686.84 ; centering $20300.
If the price stays above the center, it’s turning upwards and vice versa. (Reference at 8:00 UTC+8)
BTC flipped the center today (8.00 UTV+8), which then turned into a support.

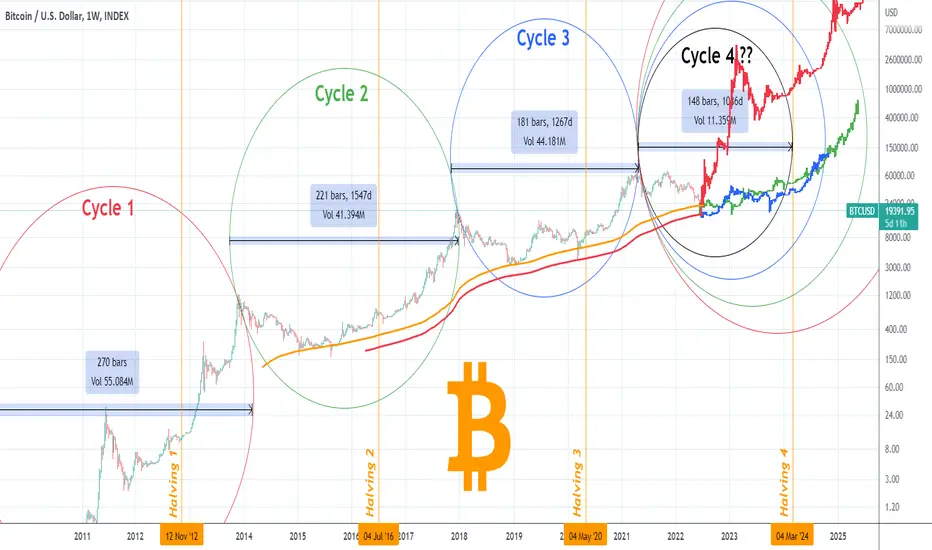
BITCOIN Hyper-Cycle model shows we're where every cycle bottomedBitcoin (BTCUSD) has started the 3rd straight week of consolidation above the 1W MA300 (red trend-line) after nearly hitting the level on the weekly candle of June 13. I've made extensive publications on the importance of this level as a Support and this time I want to elaborate on the Hyper-Cycle Theory (HCT) that reveals a progression on the extension of each Cycle and projects where we are now relative to each Cycle and how far we might go.
As you see each Cycle (Cycle 1 with the red, Cycle 2 with the green, Cycle 3 with the blue and Cycle 4 with the black trend-line) up to the April 2021 top is approximately 0.819 of the previous one. Based on that, Cycle 4 should be roughly extend for 148 weeks (1086 days) from the April High (181 weeks Cycle 3 / 221 weeks Cycle 2). That however puts the next Cycle Top exactly on the next Halving which is on March 2024. This comes in contrast to all prior Cycles that had their most aggressive Bull runs (parabolic rallies) right after the supply shock of each Halving. Of course if this theory of lower volatility for Bitcoin as adoption becomes greater in time, should at some point create fewer and fewer market extremes with smaller Cycles of Highs and Lows and break this Halving model.
For projection reasons, I've plotted each of the past three Cycles starting at the April 2021 High. Surprisingly, each candle projection roughly fills the remainder of their respective Cycle. This may indicate that in a symmetric way on this Cycle, we are at the point where all prior Cycles formed their bottoms proportionately. If that's the case, then BTC is still before the middle of the Cycle, even if the 0.819 progression model stands, giving plenty of time for the next Bull Run, even if it peaks before the Halving. Proportionately though, a repeat of Cycle 3 or better yet Cycle 2 would appear to be more fitting to the Halving model. But lets stick to the HCT model for now. Obviously a repeat of Cycle 1, that high that quickly especially, would be too unrealistic in market cap terms.
So which projection is more fitting according to you? Do you agree with the model predicting a Cycle Top before the next Halving? Feel free to share your work and let me know in the comments section below!
Important Note: Axis movements clearly distort the Cycles on the chart. If they get out of context on your monitor, try moving them to their original position based on the snapshot of the original snapshot of the chart:
--------------------------------------------------------------------------------------------------------
Please like, subscribe and share your ideas and charts with the community!
--------------------------------------------------------------------------------------------------------
Update on Weekly SpringBoardBitcoin always creates bullish divergence on the weekly time frame before a macro shift in momentum , it can take years to build this springboard setup.
If we take a look at the previous setups we can see that it's a very long process which requires a lot of patience from traders since it's normally a time where price will be most boring in the cycle, a lot of sideways consolidation movement followed by a barrage of negative news.
It's the same every cycle during this period , "Bitcoin goes to 0" these articles start coming out like clockwork , the masses are not interested in Bitcoin right now and that's exactly how market sentiment should be for a cycle bottom.
So Bitcoin is setting up like in 2018 , weekly springboard holding and LMACD same level it was in 2018 cycle bottom , it took 413 days to build this springboard , in the 2015 cycle it took 392 days .
It is possible that we might not even get that big relief rally everyone is waiting for this year, higher chance we see this rally play out from December 2022 -June 2023.

BITCOIN recorded the 3rd worst month ever! Bull or bear sign?Bitcoin (BTCUSD) has just recorded its third worst monthly closing in history amid high uncertainty not in just the crypto market but in the global economy as well, as the negative macro-economic outlook doesn't show signs of reversal yet.
This chart is (naturally) on the 1M (monthly) time-frame and as you see, the June candle closed on a -37.32% loss, with only February 2014 (-38.87%) and August 2011 (-38.58%) having recorded worse monthly losses. That said, it tied September 2011 for the 3rd spot. With the exception of the first Cycle in 2011, which was the shortest one, such huge red monthly candles tend to form either at the very start of a Bear Cycle or exactly at the end of it where the bottom gets formed.
For the current Bear Cycle (having that peculiar top in April 2021, slightly lower than November 2021), this is the second -30% candle. The first was the May 2021 (-35.38%) slightly after the Cycle Top. With the current candle coming a full year after that, it appears that the chances of that being near the bottom of the Bear Cycle and not the start are far greater. Especially considering the fact that the 1M RSI is trading exactly on the Lower Lows trend-line that has made three contacts prior to that.
But what do you think? Do you feel this -37.32% monthly candle is starting a Cycle far worse than thought or it is close/ at the bottom of it? Feel free to share your work and let me know in the comments section below!
--------------------------------------------------------------------------------------------------------
Please like, subscribe and share your ideas and charts with the community!
--------------------------------------------------------------------------------------------------------

BITCOIN An overlooked pattern and a Bearish CrossBitcoin (BTCUSD) is under heavy volatility as ever since the June 18 Low, the price attempted a short-term rebound only to be rejected on the 4H MA100. An overlooked parallel lines pattern as well as a Bearish Cross may give as a clue to where we are compared to the bottom of the previous Cycle.
** The peculiar pattern **
First of all, see the parallel trend-lines on this 1D chart. Those are of Higher Lows and Higher Highs. In 2018/19, Bitcoin had 4 perfect touches on the Higher Highs on its way to the final flush sequence of the Bear Cycle. Then had two contacts on the Higher Lows trend-line. The same pattern had the exact same amount of contacts made (4) on the Higher Highs and so far 1 on the Higher Lows.
** The CCI and RSI bottom sequences **
On top of that, the 1D CCI (black line) and RSI (light blue line) have formed sequences similar to the December 2018 bottom. This was the first contact on the Higher Lows trend-line of our pattern. Can a second and final contact be in hand here? Very possible especially if the price gets rejected on the 1D MA50 (one fake-out) as in 2018/ early 2019.
** The Bearish Cross **
Last but not least, the 1D MA200 (orange trend-line) broke today below the 1W MA100 (red trend-line). Last time that happened was on December 30 2018, exactly after the first rebound on that Cycle's bottom.
With all those indicators aligned perfectly to show that in comparison to 2018, BTC is currently past the Bottom, could it be the case that one last Higher Lows contact confirms this overlooked pattern? Feel free to share your work and let me know in the comments section below!
--------------------------------------------------------------------------------------------------------
Please like, subscribe and share your ideas and charts with the community!
--------------------------------------------------------------------------------------------------------

BITCOIN DOMINANCE giving us the right rally signalThis is an offer overlooked metric. The symbol BTC.D which represents the percentage of Market Cap BTC Dominance can be a reliable indicator for Bitcoin's (BTCUSD) long-term moves on a Cycle scale.
As this chart on the 1D time-frame shows, during the previous Bitcoin Cycle (pane below displayed in orange), the rally coincided with the BTC.D breaking above its 1W MA100 (red trend-line). On June 12 BTC.D approached it but fell sharply again below the 1D MA50 (blue trend-line), finding Support on the 1D MA200 (orange trend-line).
Right now the price is attempting another rebound, compared to late 2018 we can be anywhere within October - early December 2018, meaning that such volatility may be indicative of one last bottom before entering the new Bull Cycle. Regardless of that, crypto investors with patience in their mind can wait for the right opportunity to buy when the Bitcoin Dominance closes a week above the 1W MA100.
--------------------------------------------------------------------------------------------------------
** Please support this idea with your likes and comments, it is the best way to keep it relevant and support me. **
--------------------------------------------------------------------------------------------------------

BITCOIN Scenarios for recovery based on previous Cycle bottomsFollowing the high interest that my most recent analysis on Bitcoin (BTCUSD) and its Cycles comparison attracted, I decided to make one in the same tone on possible rebound scenarios based on the previous Cycle bottoms.
Before I begin, I want to make clear that this work is based on the assumption that the current bottom was priced two weeks ago or at least that it will be formed soon as long as the 1W MA300 (red trend-line) holds. This analysis is on the 1W (weekly) time-frame and I've divided it into four charts, each having a 'bars pattern' fractal of the first rally following a bottom, applied on the current price action.
Apart from the obvious Cycle bottom fractals of Nov 14 2011 - Jan 02 2012 (black bars), Jan 12 2015 - Nov 02 2015 (red bars) and Dec 10 2018 - June 24 2019 (green bars), I've also included the recovery from the COVID crash of March 16 2020 - August 17 2020 (grey bars). Obviously the aggressive and highly volatile nature of the first BTC Cycle (black) projects a sharp recovery of the 1W MA50 (blue trend-line) by August, which under the current macro conditions seems unrealistic. Same goes for the March-Aug 2020 fractal (grey), which also has it by the end of August. The 2015 fractal (red) has this target hit by early April 2023 and is the most pessimistic of all, while the remaining Dec-June 2019 (green) offers a more moderate projection by expecting a 1W MA50 contact by November 2022.
It is interesting to mention though that March-Aug 2020 is the only one that shows rejection and consolidation under the 1W MA50 for 2.5 months before a break higher a scenario that would be realistic too as the 1W MA50 is the initial Resistance of Cycles as they transition from Bear to Bull markets.
Below is an illustration of all fractals on top of each other:
As mentioned above, all these are mere projections based on past data. What matters most now is seeing the 1W MA300 hold and make all weekly candles that follow, close above it in order to maintain buying accumulation. Failure to do so, can make the price test the 13000 level as illustrated on a previous Fibonacci analysis.
So based on the original bottom assumption, which fractal do you feel offers the most realistic projection of a recovery? Or you think the bottom is way past the 1W MA300? Feel free to share your work and let me know in the comments section below!
--------------------------------------------------------------------------------------------------------
Please like, subscribe and share your ideas and charts with the community!
--------------------------------------------------------------------------------------------------------
