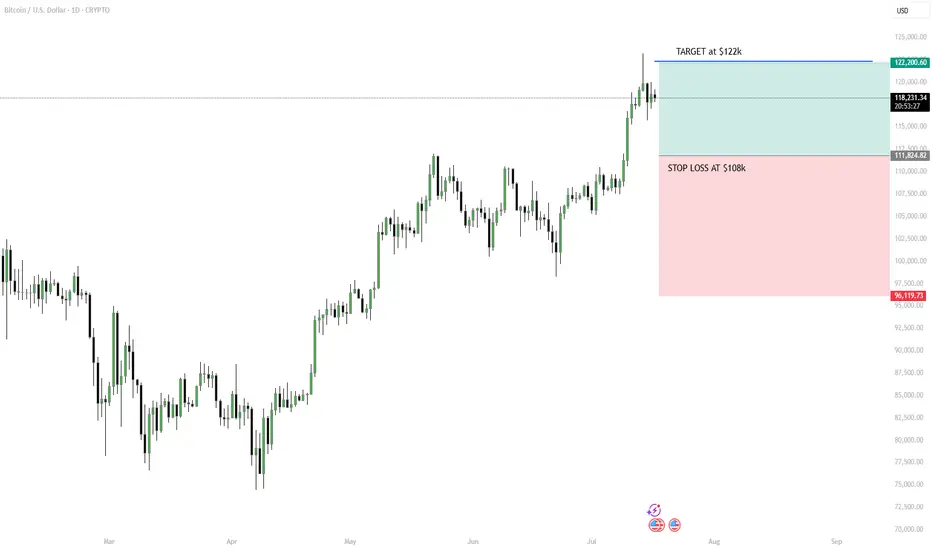
Strategy: “Breakout Bounce” – Buy the Retest, Ride the WaveHello Traders! BTC has broken out above $118K–$120K after a strong uptrend. Now it’s pausing, and a short-term pullback looks likely. Instead of buying the top, we wait for the price to retest previous resistance (around $112K–$114K), which could turn into support.
MY PLAN:
Wait for pullback to $112K–$114K zone.
Look for a bullish candle (daily or 4H) to confirm entry.
Target: $122K short-term or trail stop if trend continues.
Stop loss: Below $108K to manage risk.
Tip: Don’t chase. Be patient, follow the setup, and use proper risk management.
Please leave a comment and don't forget to support a fellow trader! Also, you can leave in the comments your target and plan ideas!
Have a great day y'all!
-Neo
Bitcointraders
Revisit to a BITCOIN idea posted in Mid March- TAKE OFF SOON ?
I first posted this idea on 19 March ( link at end of this post )
The idea is that because MACD on the weekly is still Falling bearish and is likely to remain doing so till at least Neutral is reached. This would Mean that PA had to Range in a region to allow that Drop
Things Excellerated though and that date of Mid Late April has now been pushed forward and Now, MACD reaches Neutral around 7th April - NEXT WEEK
Once MACD Neutral is reached, PA could rise with strength behind it....... This moment is getting nearer.... and so the original idea that this would happen over months got condensed in to Weeks and we now have DAYS to wait.
So, on the main chart, we wait to see if PA crosses that overhead resistance ealy next week
HOWEVER, we need to watch this Close as MACD could Drop below Neutral.
This would likely take PA down to that 618 retrace Fib line originaly arrowed.
Another thing backing a possible push is the BITCOIN DOMINACE cotined strength.
This, to the cost of the ALTS, has contained to rise and as long as it remains above that trend line, people shold buy BITCOIN more than ALTS.
It is that simple
So, lets see what happens next week. This cold be VERY GOOD

BTC live analysis and Prediction on 8/4/24 My overview is bullish in BTC as per current buyers and sellers activity.
if price test resistance and retrace not more than 50-60% then a bounce is expected.
If price fail to test resistance then this overview will consider as NULL (conditions not fullfilled)

BITCOIN ANALYSESWhere is bitcoin going after the pullback after the coin hit the all time high? are we still going to hit the all time high or what?

Bitcoin: Can buyers continue the fightback?Today's focus: Bitcoin
Pattern – Continuation
Support – 27,500, 28,700
Resistance – 29,450, 30,170
• Shib launched their highly anticipated Shibarium.
• Coinbase received approval from the NFA to allow US retail clients to trade crypto futures.
• Bitcoin briefly broke below 28K on some exchanges on Thursday
Hi, and thanks for checking out today’s analysis. Today, our focus is on Bitcoin. We’ve seen a rather exciting day so far with news hitting the market that looks to have created a bit of long-needed volatility. After a fast decline that continued the last two days, Bitcoin continues to fight back from session lows.
Will we see buyers come back into the market? Do you agree that the current retracement looks a lot like the last? Could this be a sign that a new leg higher could be building? A lot will come down to if price respects the main uptrend and if it can find support before making any new deeper declines.
Have a great day and good trading.

BTC short trade Plan Waiting for trendline breakdown for Short trade
Price Action Trade
Wait for perfect entry

Bitcoin 2018 Bear Market v 2022 Bear MarketThere is a striking similarity between the 2018 and 2022 bear markets in Bitcoin as illustrated on this chart. This is the same thing I have been discussing for months now on Twitter and YouTube while so many other large influencer accounts were screaming that it HAD to go below $12K. While there is no guarantee that the low is in yet (there are no guarantees in trading except that you WILL lose money at times), there are a number of signals that it very well may be. This is just one of them.
Break out impulsively above the weekly pivot and there should be no looking back.

Ending diagonal Bitcoin W1 chart?Reversal pattern continues to present on Bitcoins weekly chart.
Hi, we hope everyone is having a pleasant Friday. This morning while doing the rounds, I noticed a good-looking pattern on AVAX and Bitcoins weekly charts. The pattern looks like an ending diagonal, generally seen as a reversal pattern.
As noted in today’s video analysis, we would like to see prices continue to move higher and form a breakout. Bitcoin and Avax have both started testing the upper line and could break clear if momentum can continue. After that point, we would like to see highs and resistance tested and beaten to confirm we have a new trend underway.
A move back to the lower line is a warning and could signal the pattern is failing.

BTCUSDT 15 Min Chart Demand & Supply Zones#Bitcoin #BTC 15 Min chart Demand and Supply Levels.
Bullish Supply Range ( Go Long) - USD 20,646/-- to USD 20,673/-
(Blue Circle in Image)
Bearish Supply Range ( Go Short) - USD 19,842/- to USD 21,673/-
(Red Circle in Image)
#bitcoin #btc #cryptocurrency #crypto
Total BTC Longs - 103920.4/-
Total BTC Shorts - 2,729.3/-
Current Status - Movement Towards Bull Run.

Bart Simpson PatternBart Simpson's pattern usually lasts about 2-5days
it has been 2.5 days so far since Bart Simpson's pattern started forming
we will see pull back according to this pattern
The longest pattern last 5days so we will see the move down within 2-3days
---not financial advice----

BTCUSD <ONE DAY CHART TECNICAL ANALYSIS>For we trading BTCUSD this week it has a nice move tho
And it been measured and confirmed with different trendline strategies on many timeframechart
And we still expecting more bearish candle or if it breaks out the trendline it give comfirmation for buy also
Follow up for more and trade wisely. #LegendFXX

#bitcoin why am i bullish !!!!!Hello to all friends
I was analyzing bitcoin today
In the weekly chart I see a very strong uptrend
I have 2 scenarios
If Bitcoin is above $ 48,500 tonight, I see a growth scenario for next week and expect a rapid growth
But if not, do not worry, we will have a correction of up to $ 40,700 and we will stay in the range of $ 48,000 to $ 41,000 for another 4 weeks and then we will get out of this beautiful ascending triangle.
I am not a seller at all and I use fluctuations to add
Be profitable
@bitcoin @bitcoinnews @bitcoiner

#BITCOIN Ascending scenarioI explained the cases inside the chart
It is very important that Bitcoin be supported in the $ 42,500 area, we will see a strong growth
Please do not forget to like and comment
Your likes and comments motivate me

BTC USDT SHORTOur trend has failed
This is a good place to open a short position
Manage your risk
Do not forget to like and comment

#Bitcoin: The pump was not fakeSorry friends
Last night we saw a pump just after the candle was closed for 4 hours
It was more like a stop-hunting than an uphill move
But now that the candles have stabilized, we are convinced that this was a healthy move
Your own risk
Do not forget to like and comment

Bitcoin Stop HuntingAfter closing the 4-hour candle, we saw a bitcoin pump and a large number of short positions liquid.
I consider this a sign of decline, simply because the pump did not happen at the right time

#bitcoin UsdtBitcoin has three areas of support
I expect a minor correction
I drew three support points and due to purchasing power, it is possible to pump upwards from each of these areas (green Arrow)
I always put the worst case scenario in red so you can remember, bad accidents can happen (red Arrow)
If Bitcoin returns below $ 40,000, we will see a downtrend and break the uptrend

The B word conference is not enough to pump BTCElon Musk, Cathy Wood, Jack Dorsey, are all very notable names, however, they still do not have the capabilities of pulling BTC out of a bear market on video conference alone. A crash is necessary and inevitable, what you see is temporary, and this pump is only going to be short-lived.

BTC USDT Update 1hWe have two ascending scenarios for bitcoin
I announced a few days ago that the market trend is changing and rising
We have two ascending scenarios
I announced a few days ago that the market trend is changing and rising
Do not forget to like and comment


BTC/USDThis is a short trade I entered last night. I do anticipate it to hit my TP. There are many factors I am taking into play for this but one of them is the Bitcoin dominance has been on a downtrend for a long time now, and it's almost dropped below 50% dominance for the first time in over 3 years.
With Altcoins becoming more and more popular, this is resulting in bitcoin demand slowly weakening.
PLUS on the technical side of things, it has respected my zone rather well and isn't showing any TRUE signs of continuation.

BTC/USDT NEXT LEG UP 🔥Hey hey my friends and good morning!
Quick BTC update... We are breaking out of the sym-triangle here
Bullish continuation pattern, we are looking for our next leg up onwards to 50k 💰
Will have more soon!

BTC/USDT Prediction Analysis Good Morning for All Respected Investors and Traders!
I made a simple analysis for Bitcoin/USDT for 2 February 2021
Buy at my sign "entry"
Happy trading y'all!!
Best Regards,
PS: This is not financial services or even education.
DYOR please!
