TUSDT Forming Descending Channel TUSDT is currently trading within a clearly defined descending channel pattern, which is a classic bullish reversal signal when identified in the right market context. After a prolonged period of correction, the price is now consolidating within the lower boundary of the channel, signaling that a potential breakout could be near. Historically, descending channels often precede strong bullish reversals, especially when accompanied by rising volume and increased investor interest—which we’re now starting to see in TUSDT.
The volume profile has remained consistently good during the consolidation phase, indicating that buyers are gradually absorbing supply at lower prices. This accumulation zone within the channel adds strength to the probability of a breakout. Once the upper resistance of the channel is breached with conviction, technical targets point toward a 60% to 70% move to the upside, making this a highly attractive setup for short-to-mid term traders.
Market sentiment is shifting, and as investor focus returns to quality altcoins, TUSDT’s setup becomes even more compelling. With more traders scanning for high-reward plays in the altcoin space, TUSDT's technical pattern places it in a strong position to capture breakout momentum. The alignment of price action, pattern structure, and investor participation creates a high-probability trading opportunity.
For those watching the altcoin market closely, TUSDT should be on the radar. A breakout from this descending channel could act as a catalyst for significant gains, aligning perfectly with the broader recovery trend forming in the crypto market.
✅ Show your support by hitting the like button and
✅ Leaving a comment below! (What is You opinion about this Coin)
Your feedback and engagement keep me inspired to share more insightful market analysis with you!
Bitcointrading

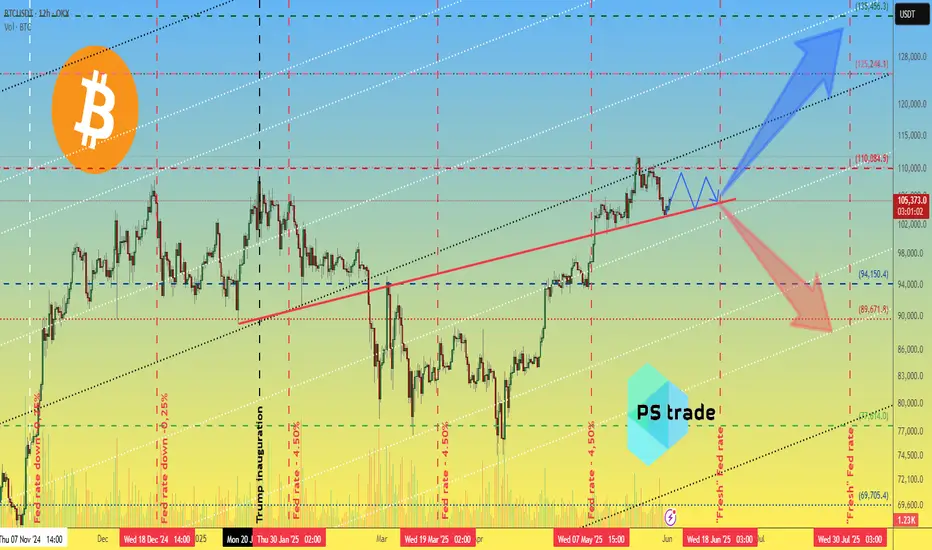
Bitcoin BTC price analysis🍿 At the OKX:BTCUSDT chart, we show one of the scenarios that could play out in the first half of June.
Much will be decided today with the opening of the US market. It is very likely that there will be a downward movement at the opening in response to the new tariffs announced by Trump on Friday after the markets closed.
🕯 Well, then we'll have to “keep our fingers crossed” that market players show their strength and hold on and buy back the drop — like say: we're tired of shaking with every crazy statement from Trump.
💰 If the price of CRYPTOCAP:BTC stays above $103k, there is a chance that it will be “stuck” in the $103-110k consolidation. The market needs to digest and redistribute the results of two months of #BTCUSD price growth from $75k to $112k.
And considering the position of the BTC.D and USDT.D indices, there is a chance that the “little bit” of capital will pass to the altcoins, and they will shoot up a little.
⁉️ Probably, the safest thing to do would be to watch the altcoins and buy only those that have started a significant upward movement with volume.
What do you think?
BMTUSDT Forming Strong BullishBMTUSDT is demonstrating a strong bullish structure following its breakout from a descending wedge, which typically signals a reversal of trend. After consolidating for several weeks in a falling wedge pattern, the breakout to the upside—supported by increasing volume—marks a clear shift in momentum. Buyers are reclaiming dominance, and the price is now holding above a strong support zone highlighted in purple, which has acted as a solid accumulation area.
The chart shows a projected upward move with two target levels, suggesting potential gains of 30% in the near term and over 100% in the mid-term. These targets are realistic given the size of the breakout and the bullish price action. The pattern breakout is accompanied by bullish candles and consistent higher lows, adding credibility to the breakout setup. Technical traders watching this pair may interpret the current setup as a high-reward, low-risk opportunity.
What makes BMTUSDT especially interesting is the timing—it's breaking out while the broader market is showing signs of recovery and renewed interest in altcoins. As sentiment shifts across the crypto landscape, projects like BMT that show real-time technical strength tend to draw in both retail and algorithmic interest. Combined with healthy trading volume, this can fuel a rapid price climb toward the highlighted targets.
This setup places BMTUSDT on the radar for breakout traders and swing investors alike. With strong support levels, bullish breakout confirmation, and significant upside potential, BMTUSDT could offer one of the most promising mid-cap opportunities in the current market cycle.
✅ Show your support by hitting the like button and
✅ Leaving a comment below! (What is You opinion about this Coin)
Your feedback and engagement keep me inspired to share more insightful market analysis with you!

BTCUSD: Nowhere near a top yet.Bitcoin remains neutral on its 1D technical outlook (RSI = 47.257, MACD = 443.000, ADX = 29.912) due to high volatility recently but the bullish long term trend is intact and even more so, hasn't yet started the year-end rally. The Mayer Multiple Bands have always priced a Cycle's Top on their red trendline so no matter how high that may seem from the current market price, the TP zone should be between the orange (2 Stdev above) and red (3 Stdev above) trendines. Minimum TP = 200,000 for this Cycle.
## If you like our free content follow our profile to get more daily ideas. ##
## Comments and likes are greatly appreciated. ##

BTCUSD: 1D MA50 and 100k form a strong support base.Bitcoin has turned neutral again on its 1D technical outlook (RSI = 45.783, MACD = 629.200, ADX = 20.857) and is about to get bearish as it hit its 1D MA50 today, erasing the gains of the last 3 days. The 1D MA50 has held two times since June 5th and another one might be what Bitcoin needs to justify the next rally. Besides this however, we got a heavier Support on the P1 trendline, which on the previous ATH (Dec 17th 2024) was a Resistance and since May 12th 2025 it turned into Support. Technically, as long as 100,000 holds, we expect a strong rebound into August that may repear the inverse of December 2024 - March 2025 (-31%) and rise by +31% (TP = 132,000).
## If you like our free content follow our profile to get more daily ideas. ##
## Comments and likes are greatly appreciated. ##

SOLUSDT Forming Bullish FlagSOLUSDT is currently forming a classic bullish flag pattern on the chart, which is often seen as a continuation pattern indicating the potential for a strong breakout to the upside. The price has consolidated within a tight range following a significant upward move, creating a flag-shaped formation that typically precedes the next wave higher. This structure is being supported by solid volume behavior, which is an essential confirmation for bullish breakouts. Based on historical performance and technical projections, a 50% to 60% gain could be on the horizon if this pattern resolves upward.
Solana (SOL) has remained one of the strongest-performing layer-1 blockchain projects in the market, and current investor sentiment is highly favorable. With recent developments in its ecosystem and increased institutional interest, SOL continues to attract substantial inflows. The bullish flag pattern aligns perfectly with the broader market optimism and technical indicators such as RSI and MACD that are showing early signs of renewed momentum.
Traders should watch closely for a breakout above the flag's resistance line, as this could trigger a new wave of buying pressure. Key levels to monitor include the breakout point and potential price targets around the previous highs and Fibonacci extensions. The market structure remains bullish, and if confirmed by volume and market momentum, SOLUSDT may offer one of the most attractive risk-reward setups in the current crypto landscape.
In summary, SOLUSDT is technically poised for another rally, supported by a bullish flag and growing interest from both retail and institutional investors. With a favorable risk profile and strong fundamentals, this is a setup that many traders will be watching in the coming days.
✅ Show your support by hitting the like button and
✅ Leaving a comment below! (What is You opinion about this Coin)
Your feedback and engagement keep me inspired to share more insightful market analysis with you!

BTCUSD: Can it repeat the U.S. elections rally?Bitcoin is on a slight pullback, being only marginally bullish on its 1D technical outlook (RSI = 56.024, MACD = 1611.500, ADX = 23.439). Based on the 1W RSI we may be on the October 30th - November 4th 2024 pullback that preceded the U.S. elections. The decisive test will be on the 1D MA50 again, but as long as the S1 level holds, chances are we will see a similar +106.40% rally. We remain bullish on BTC, TP = 150,000.
## If you like our free content follow our profile to get more daily ideas. ##
## Comments and likes are greatly appreciated. ##

ASRUSDT Forming Falling WedgeASRUSDT is gaining strong bullish traction after a successful breakout from a falling wedge pattern. This setup is widely recognized in technical analysis as a bullish reversal structure, and the breakout here is backed by consistent price action above the key resistance zone highlighted in red. ASR has now flipped this zone into support, and the trendline structure suggests a continuation move is underway.
The recent candles are forming a clear uptrend, and the momentum is being supported by healthy volume flow, indicating that accumulation might be happening behind the scenes. With the breakout fully confirmed, a potential 40% to 50% upside move is projected based on the measured target approach, aligning with price ranges between $2.5 and above. Traders should watch for continuation patterns or bull flags as the uptrend evolves.
The ASR token is part of a growing fan-token economy that has started to attract fresh attention in 2025. As investor interest increases, demand for utility-driven and fan-based tokens could fuel further upside. This positions ASR as a strong candidate for both speculative and long-term plays. If the broader altcoin market continues to move positively, ASR could outperform thanks to both technical strength and thematic interest.
With its current setup, ASRUSDT looks set to rally further and may present a compelling opportunity for traders who position early. Keep an eye on pullbacks to key support levels as potential re-entry zones if missed on the initial breakout.
✅ Show your support by hitting the like button and
✅ Leaving a comment below! (What is You opinion about this Coin)
Your feedback and engagement keep me inspired to share more insightful market analysis with you!

ARDRUSDT Forming Descending TriangleARDRUSDT is showing a powerful breakout from a descending triangle pattern, indicating a strong bullish reversal in progress. The breakout candle is backed by solid volume, reinforcing the strength of the move and hinting at a potential trend shift. Historically, this pattern signals the end of consolidation and the start of a significant upward rally, especially when confirmed by a volume surge as seen here.
With the price currently above key resistance levels, ARDR is now poised for a sharp move to the upside. The projected gain stands around 90% to 100%+, based on the height of the triangle formation and historical breakout behavior. This makes ARDRUSDT a high-reward setup for swing traders and mid-term holders who are looking for undervalued assets with upside potential in the altcoin space.
The Ardor blockchain project has continued to evolve in the background, with real-world use cases and innovative multi-chain architecture. As the market begins to price in utility-driven growth, coins like ARDR tend to outperform during bullish cycles. Moreover, increased investor interest in lower-cap, fundamentally strong altcoins is starting to reflect in the current price momentum.
Given the technical breakout and rising community engagement, ARDR could attract more attention in the coming days. Keep an eye on this pair as it potentially leads the next wave of altcoin rallies, especially if Bitcoin maintains stability or trends upward.
✅ Show your support by hitting the like button and
✅ Leaving a comment below! (What is You opinion about this Coin)
Your feedback and engagement keep me inspired to share more insightful market analysis with you!

BTCUSD: 4H Golden Cross kickstarting $119,000 rally.Bitcoin remains bullish on its 1D technical outlook (RSI = 58.982, MACD = 1643.700, ADX = 1643.700) despite today's high volatility. This volatility displays similar attributes to the Accumulation Phases that were formed since the April 7th bottom. If it follows the symmetry of the first two bullish waves around the first Accumulation Phase, expect a +10% rise from the Phase's bottom. Assuming today is the bottom, the next target of this pattern is 119,000.
## If you like our free content follow our profile to get more daily ideas. ##
## Comments and likes are greatly appreciated. ##

BTCUSD: H&S neckline invalidated! Heavily bullish.Bitcoin turned bullish again on its 1D technical outlook today (RSI = 58.910, MACD = 1101.600, ADX = 21.447) as it crossed over the neckling of the Head and Shoulders pattern and invalidated the bearish sentiment. This now targets the 2.0 Fibonacci extension to the upside on the short term, TP = 123,500.
## If you like our free content follow our profile to get more daily ideas. ##
## Comments and likes are greatly appreciated. ##

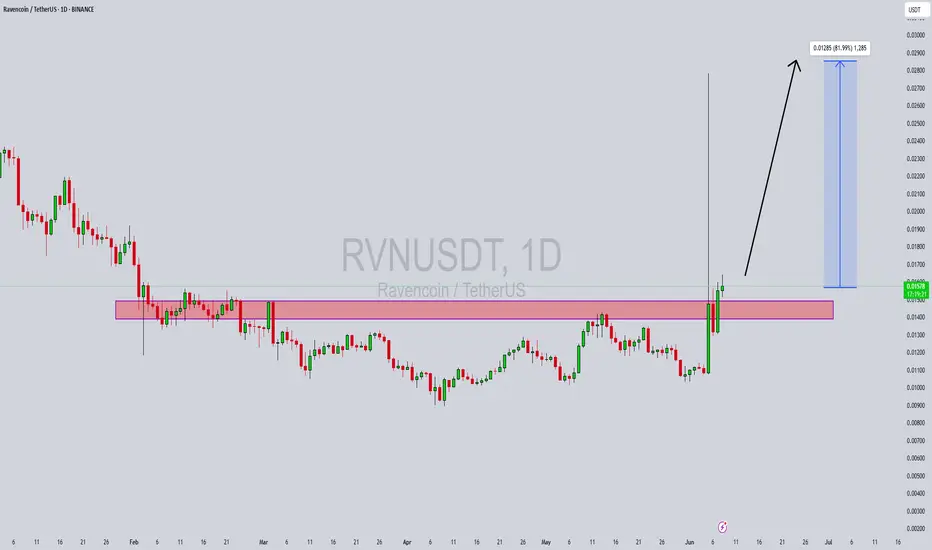
RVNUSDT Forming Bullish ReversalsRVNUSDT is currently showing a promising technical setup after an extended period of consolidation. The price has formed a strong base, supported by steady volume growth, which indicates renewed interest from both retail and institutional traders. This consolidation phase appears to be nearing completion, and a breakout from this level could trigger a powerful bullish rally. Based on the current structure and market momentum, a 70% to 80% gain is anticipated in the upcoming weeks.
Ravencoin (RVN) has maintained relevance in the blockchain space due to its unique focus on asset tokenization. It enables the creation and transfer of real-world assets on the blockchain, which is a growing narrative in the Web3 and DeFi sectors. As more investors seek alternative platforms to tokenize assets and explore decentralized finance, RVN is positioned to benefit from the increased use case demand and adoption.
Technically, RVNUSDT has respected key support zones, and the price action suggests accumulation by long-term holders. A confirmed breakout above recent resistance could catalyze the start of a bullish wave, with price targets aligning around historical resistance levels. The volume uptick further validates the possibility of a breakout, hinting at increased buyer activity and confidence in the project’s future.
Overall, RVNUSDT presents a compelling risk-reward setup for traders and investors watching altcoins with real utility and strong community backing. With the chart structure, fundamentals, and volume all aligning, this crypto pair could be preparing for a significant upward movement.
✅ Show your support by hitting the like button and
✅ Leaving a comment below! (What is You opinion about this Coin)
Your feedback and engagement keep me inspired to share more insightful market analysis with you!
GPSUSDT Forming Bullish Impluse legGPSUSDT has recently shown a bullish continuation setup after forming a strong impulse leg, followed by a textbook falling channel—typically a bullish flag pattern. This price structure is often seen in trending markets as a consolidation phase before the next leg up. With the current breakout attempt supported by rising volume, technical indicators suggest that the market is preparing for a potential surge. A breakout from this falling channel could initiate a powerful bullish wave, targeting gains of 50% to 60% or more.
The growing interest from investors further validates the current technical outlook. GPS is drawing attention in the altcoin space as market participants begin positioning ahead of potential announcements or development milestones. The improving sentiment around mid-cap altcoins is also contributing to a rotation of capital into undervalued projects like GPS, which are now showing early signs of momentum. Price action traders and swing traders should monitor this breakout closely, as the risk-to-reward setup appears highly favorable at these levels.
From a market structure perspective, this breakout may push GPSUSDT toward the $0.036–$0.038 resistance range, which aligns with the height of the previous impulse leg. If buyers sustain pressure and trading volume continues to build, the coin could even outperform the projected move, making this setup one of the more attractive technical plays on the daily chart. This aligns well with broader altcoin market cycles, where coins that consolidate after an initial push often deliver extended rallies once accumulation completes.
With a strong bullish flag formation, solid volume backing, and clear investor interest, GPSUSDT is well-positioned for a sharp upward move. This could present a timely opportunity for both short- and medium-term traders looking to capitalize on a technical breakout in an emerging project.
✅ Show your support by hitting the like button and
✅ Leaving a comment below! (What is You opinion about this Coin)
Your feedback and engagement keep me inspired to share more insightful market analysis with you!

BTCUSD: Just hit the 1D MA50 and is rebounding.Bitcoin turned neutral on its 1D technical outlook (RSI = 51.000, MACD = 923.400, ADX = 25.014) as it hit its 1D MA50 for the first time since April 19th. That is a straight up buy signal, especially since the the current Channel Up with its 1D RSI HL structure, resembles September - December 2024. TP = 165,000.
## If you like our free content follow our profile to get more daily ideas. ##
## Comments and likes are greatly appreciated. ##

EDUUSDT Forming Descending TriangleEDUUSDT has recently broken out of a descending triangle pattern on the daily timeframe, which is typically a bullish signal when confirmed with volume. The breakout has occurred with notable strength and solid green candle momentum, indicating a potential trend reversal and the beginning of a strong upward move. With price currently trading near $0.1499, this technical breakout opens the door for a projected gain of 60% to 70%+ in the coming days or weeks.
EDU, the native token of the Open Campus project, is gaining attention as the Web3 education narrative grows stronger. As traditional sectors like education integrate blockchain, EDU stands out as a project with real-world utility and adoption potential. The fundamentals are aligning well with the technical picture, and the increased investor interest is starting to reflect in both volume spikes and social media chatter.
If EDUUSDT maintains support above the breakout trendline, traders could see a continuation toward the $0.25 to $0.27 region — aligning with the chart projection of nearly 80% upside. This setup is further supported by increasing market sentiment, and EDU’s strategic partnerships in the education sector make this move fundamentally sound.
This is a high-potential setup for traders looking to ride breakout momentum in trending altcoins. EDU is not just riding the wave of hype but is backed by utility, strong technical structure, and market interest — making it a standout in the current altcoin rotation.
✅ Show your support by hitting the like button and
✅ Leaving a comment below! (What is You opinion about this Coin)
Your feedback and engagement keep me inspired to share more insightful market analysis with you!

BTCUSD Rejection Brewing? OB + 79% Fib Tap Could Trigger Short!Bitcoin (BTCUSD) | 30-Min Sell Setup – Order Block + Deep Fib Confluence
This is a classic Smart Money short setup. Price swept lows, rebounded into premium pricing, and is now approaching a high-probability rejection zone — just the way institutional traders like it. 🧠💰
🔍 Breakdown:
Market Structure:
Recent move formed a lower low ➝ market structure is bearish
Current retracement is corrective, moving toward premium sell-side levels
Key Confluences:
🔴 Order Block (purple zone): ~105,200–105,300
🔴 Fib Confluence:
61.8% = 105,178
70.5% = 105,298
79% = 105,388
🔴 Price is tapping OB + 70.5–79% fib zone = sniper territory for shorts
Liquidity Perspective:
Earlier liquidity grab below 104,500 triggered this move
Now climbing back into premium pricing — potential trap before drop
Above the OB: resting liquidity + stop hunts expected
Execution Strategy:
✅ Entry confirmation: Look for M5–M15 bearish engulfing / BOS in OB zone
🎯 Entry area: 105,280–105,388 (limit or confirmation-based)
🛡 SL above 105,400 (above OB & 79%)
💰 TP zone: 104,500 (liquidity pool + fib 0%)
⚠️ Risk-to-Reward Ratio: 1:3+ potential — ideal for scalpers and intraday traders alike
🧠 Chart Ninja Notes:
You’re not chasing highs — you’re stalking where Smart Money sells to the crowd. This is premium pricing in a bearish leg, and BTC is approaching the kill zone. Patience = profit. 😤💸
📈 Game Plan Summary:
🔹 Entry Zone 105,280 – 105,388 (OB + 70.5–79% fib)
🔻 SL Zone Above 105,400
📉 Target 104,488 zone (fib 0%, equal lows)
🎯 RRR Potential 1:3+
💬 Pro Tip:
Wait for price to enter OB and stall before pulling the trigger.
The best trades happen after liquidity is swept — not before.
You’re not a retail trader. You’re a sniper. 🥷💥
📥 Save this setup & review it post-trade
🔁 Share your entry plan in the comments
⚡️ Follow @ChartNinjas88 for daily Smart Money BTC plays

BTCUSD: Consolidation is about to be over.Bitcoin remains neutral on its 1D technical outlook (RSI = 52.429, MACD = 1547.600, ADX = 23.123) as so far it is failing to stage a proper breakout from the consolidation of the last few days. Based on the long term comparison with the previous Channel Up at the time of the 1D Golden Cross, the consolidation could be over soon, resembling November 4th 2024. As long as the 1D MA50 holds, stay bullish, TP = 165,000.
## If you like our free content follow our profile to get more daily ideas. ##
## Comments and likes are greatly appreciated. ##

BTCUSD: This part may be the most exciting of all.Bitcoin is on an excellent bullish 1W technical outlook (RSI = 65.366, MACD = 6742.800, ADX = 33.478) unphazed by the recent short term pullback. This is because the Cycle is only now starting is strongest phase, at least based on the historic price action of the former Cycles. After the U.S. elections in November 2024, we've crossed above the Bear Cycle neckline and on all previous Cycles, that is where the parabolic rally started. How high it can go is anybody's guess and depends largely on fundamentals (adoption, ETF, Rate Cuts) but we can agree that we will see at least 150,000 before this Cycle ends.
## If you like our free content follow our profile to get more daily ideas. ##
## Comments and likes are greatly appreciated. ##

BTC/USDT Analysis: Development of a New Range
Hello everyone! This is the daily analysis from a trader-analyst at CryptoRobotics.
Yesterday, the scenario for the leading cryptocurrency remained almost unchanged. No buyer anomalies were observed within the $104,200–$102,300 area (accumulated volumes). Volume remains low.
The primary scenario is the development of a sideways range between two volume zones: $104,200–$102,300 (accumulated volumes) and $107,000–$109,800 (accumulated volumes). If the recently formed low is retested and buyers fail to defend it, we expect a moderate short toward the next selling zone at $100,000.
Selling zone:
$107,000–$109,800 (accumulated volumes)
Buying zones:
~$100,000 (initiating volumes),
$98,000–$97,200 (local support),
$93,000 level,
$91,500–$90,000 (strong buying imbalance)
This publication is not financial advice.

Bearish Divergence on Bigger tf
CMP 105228.47 (02-06-2025)
Bearish Divergence on Bigger tf (Cautious
approach should be taken).
However, if 109350 is Crossed, we may
witness 115000 & then 120000 - 121000.
and if 112000 is crossed & sustained, be ready
to get New Highs :-)
Lets be more cautious & dig out 3 Important
Support Levels.
S1 around 103000 - 102500
S2 around 97800
S3 around 93400 - 93500.

BTCUSD: Neutral but long term still intact.Bitcoin has turned neutral on its 1D technical outlook (RSI = 50.968, MACD = 1795.700, ADX = 23.670) a direct consequence of last week's correction. That correction is though just a pullback on the 1W timeframe, which is more bullish than ever as it's coming off a May 1W MACD Bullish Cross. Since the 1W MA50 supported April's bottom and produced the current rebound (even ATH has been made) that also respected the powerful P1 trendline, this is a bullish wave similar to all prior since the late 2022 Bear Cycle bottom. As all 3 rallied by +100%, we can stay bullish aiming for 150,000 towards the end of the year.
## If you like our free content follow our profile to get more daily ideas. ##
## Comments and likes are greatly appreciated. ##

ACAUSDT forming a falling WedgeACAUSDT is currently displaying a strong falling wedge pattern—a historically bullish reversal structure that typically precedes sharp breakouts. After a prolonged downtrend, the price has formed lower highs and lower lows within a narrowing channel, suggesting decreasing selling momentum. The recent price action bouncing off the wedge's lower boundary, combined with a solid spike in volume, indicates a potential bottom formation and growing buyer interest.
Acala (ACA), known for its role in the Polkadot ecosystem as a decentralized finance hub, continues to show fundamental promise. With DeFi narratives heating up again and more liquidity flowing back into the Polkadot parachain ecosystem, ACA is regaining the attention of crypto investors and traders alike. Technical and fundamental convergence here is strong—making it a potential high-reward candidate for short- to mid-term bullish plays.
If this breakout confirms with strength above the wedge resistance, the projected price move could reach up to 90% to 100%+ based on measured move theory. Such breakouts often accelerate quickly due to short covering and renewed speculative interest. This is supported by rising trading volume and increased chatter among crypto communities, pointing toward renewed bullish momentum for ACAUSDT.
From a risk-reward perspective, the current zone near the wedge support offers an attractive entry for swing traders aiming to capitalize on the upcoming breakout. With multiple confluences lining up technically and fundamentally, this setup is one worth watching very closely.
✅ Show your support by hitting the like button and
✅ Leaving a comment below! (What is You opinion about this Coin)
Your feedback and engagement keep me inspired to share more insightful market analysis with you!

BTC/ USDT DOM.. more downside? This is USDT on the weekly.. as you can see last June and July even before this is a big level of support for USDT DOM.. Wont be surprised for some more down side here for the crypto market. I know its easy to say now after it lost 111k but I just got home and wanted to look deeper into it. Play it level by level obviously.. fib by fib but don't be surprised to see some down side.. Also you're only down if you bough in the last 2 days and that being said don't buy something that ran up to ATH and think its time to buy.. you kinda deserve it.. but lets see what happens. I hope I'm wrong
