BTCUSD: About to explode to 135k by July.Bitcoin is about to turn neutral again on its 1D technical outlook (RSI = 57.730, MACD = 3423.900, ADX = 23.501) as it is expreriencing the strongest pullback since the start of its April bottom. Having completed a 1D Golden Cross like on October 27th 2024, this pullback seems a lot like the one that suceeded that Cross, which tested the LH trendline and marginally crossed under it and as it held the 1D MA50, resumed the uptrend and exploded to the 3.382 Fibonacci extension. That is our target on a July horizon (TP = 135,000).
## If you like our free content follow our profile to get more daily ideas. ##
## Comments and likes are greatly appreciated. ##
Bitcointrading

BTCUSD: 1M turned overbought and that's not alarming at all! Bitcoin has turned bullish even on its 1M technical outlook (RSI = 70.030, MACD = 16,156.720, ADX = 38.100) but that's not a reason to expect any strong corrections as this is the part were it technically rises more during Bull Cycles. The basic structure of the Cycle is an Ascending Triangle which breaks when the parabolic rallies begin. Based on the ratio of the last two Cycles, the new rally should be around +130% from the top of the Ascending Triandle. That gives a $160,000 fair estimate as far as the Cycle top is concerned.
## If you like our free content follow our profile to get more daily ideas. ##
## Comments and likes are greatly appreciated. ##

BTC at Crossroads: Rejection from ATH or Breakout.Key Zones Highlighted:
🟥 Recent ATH and Resistance Level (~$111,000 - $112,000)
The price recently tested this area, forming a new All-Time High (ATH).
This zone has acted as a major resistance, causing a pullback.
A break and close above this range would indicate bullish continuation.
🟩 Support Zone (~$105,000 - $106,000)
Price previously bounced from this zone.
Currently acting as a mid-level demand/support.
Likely to be tested again if bearish pressure continues.
🟩 Strong Supply Zone (~$102,000 - $103,500)
A more significant support area, where previous buying pressure emerged strongly.
If the upper support fails, this becomes the next possible bounce zone.
Price Action and Projection:
Price is currently at $108,209 and moving within a correction phase.
Two potential scenarios are highlighted on the chart:
Bullish Continuation:
Price rebounds from current level (black circle) and breaks above the resistance zone.
Targets new highs beyond $112,000.
Bearish Pullback:
Price fails to sustain above current level and dips into the support zone (~$105K).
If strong buying interest appears, a bounce back to the ATH zone is expected.
Technical Outlook:
Ichimoku Cloud: Price is testing the Kumo (cloud), indicating neutral to slight bearish momentum.
Volume: Slight uptick in volume during the recent drop suggests sell pressure is increasing.
Structure: Price is forming a higher high and potentially a higher low, maintaining a bullish structure as long as support holds.
Conclusion:
BTC is in a critical zone with mixed signals. A decisive move from the current level will likely set the tone for the next 24–48 hours. Watch:
A bounce at ~$108K for bullish continuation,
A dip toward $105K for potential re-entry opportunities.
Let me know if you’d like trade setup suggestions based on this.

LongTerm BITCOIN LINEAR chart & NUPL tells a story -August Top
We can start with the main chart.
This is a LONG TERM LINEAR chart, showing the price action Directly, unaltered by mathmatics,
Long Term charts usualy are shown by logarithmic charts.
Linear and logarithmic trading charts differ in how they represent price changes. Linear charts display equal price changes the same, making them suitable for short-term traders focusing on exact price movements. On the other hand, logarithmic charts show percentage changes, which makes them better for long-term investors or volatile assets, as they help in analyzing trends and patterns more clearly over time.
This chart starts just before the 2017 ATH and you can easily see the line that rejects ATH and how PA is up near that area right now.
Things to note are the day count from 2017 ATH to 2021 Final ATH and the day count between that double Top in 2021.
These numbers are projected to our current cycle and show we are near the projected Top using this style of Chatr, The Log charts project further into the year.
It may also be worth noting how the 50 EMA (red) was used by PA after the Drop after the first ATH, to bounce back up to the next ATH at the end of that year.
We have just done exactly the same again, PA was rejected by that long term Line and Dipped down to the 50 EMA and has since bounced back up to the rejecting line.
IS REJECTION LIKELY NOW? [/b
This is something that is impossible to answer with any real Fact But we can look at data and make eductaed projections.
PA has the ability and strength right now, to range high, running up under this line of rejection until it becomes overbought on the long term MACD, RSI , TSI etc
But something that will absolutely decide when the top is in is the Profit taking by Holders.
We are currently seeing Selling taking place and we can see the potential profit by looking at NUPL
NUPL, or Net Unrealized Profit/Loss, is an indicator used in trading to measure the difference between unrealized profits and losses in the Bitcoin market.
Here is the chart from all the way back to 2010
Lots to see here but to summerise.
See how there are Peaks each cycle of Maximum available profit. The point where profit taking Tops out is arrowed. This area, up to the red line, shows us the TOP zone.
What is VERY noticable this cycle is how we have not yet reached that upper Red line.
Sellers appear to be taking theor profits earlier.
The upper day counts have been consistant in the past, with 2 double tops of potential profit before the selling sold it all off.
Many people, including me, have been saying "This time is different" and this is VERY clearly shown here by the fact that we have already had the 2 peaks of potential profit and we are currently climbing to the 3rd
This has NEVER happened before and, technicaly, this could continue.
The Lower day counts are from Mid Double Tops to the Next Mid double top of potential profits mentioned above,
The Next "Mid point" is projected to be around July.
This NUPL also shows ua how the high level of potentia profits was reached Quicker this cycle than previously. This was helped by the Corporations buying Early and Massive amounts, putting Large numbers of coins into profit
In Conclusion [/i
We have the Linear Bitcoin chart pointing towards a JULY / August Top
We have the NUPL also pointing towards a July / August Mid point of Potential profits.
If you loo cloely, BOTH charts, using differnet data, suggest 28 July
What also maybe worth considering here is how we see that Potential profits are reducing in availability. As the asset becomes more expensive to buy, it also gets harder to push the price higher and so make more profit. I,E. It was eaier to double the price of Bitcoin when it was $50 a coin
Of course, non of this may play out, Things ARE DIFFERNT but I have now decided to have another plan ready for August and we need to wait and see what happens Next
BE PREPARED FOR ALL POSSIBILITIES

BTCUSD: Urgently needs to break above this trendline!Bitcoin is bullish on its 1D technical outlook (RSI = 65.624, MACD = 4011.100, ADX = 25.476) but not overbought anymore as the aggressive weekly rallies since the 1W MA50 rebound have been decelerated. The next heavy obstacle is the HH trendline that runs on top of the January 20th 2025 and December 16th 2024 Highs and got hit last week. So far the price hasn't crossed above it but it needs to urgently in order to avoid a rejection with snowball effects.
The last time Bitcoin faced a similar HH trendline Resistance was on the October 23rd 2023 1W candle and it succesfully smashed through it, completing a +79.23% rise before consolidating again. If it breaks again above it, we expect the same minimum rally, which gives us a TP = 133,500.
## If you like our free content follow our profile to get more daily ideas. ##
## Comments and likes are greatly appreciated. ##

BTC shorts will get liquidatedHello everyone!
As we all witnessed, BINANCE:BTCUSDT experienced a sharp drop following Trump's announcement of new tariffs starting June 1st on all European Union . The big question now is: is this the end for Bitcoin, or just a temporary dip?
In my opinion, BTC is likely to move as follows:
It will retest the long wick on the 1-hour chart, which previously bounced from a 1-hour Fair Value Gap (FVG) , and then continue its upward movement.
Don't worry, everyone, BTC remains very strong!

BITCOIN (BTCUSD): The Next Resistances
As Bitcoin is trading in the no man's land again,
violating a resistance cluster based on a previous ATH,
here are the next potentially strong resistance to watch.
Resistance 1: Narrow area based on 115000 level - the closest strong
psychological level.
Resistance 2: Narrow area based on 120000 level - the next
psychological level.
Resistance 1 is going to be the next goal for the buyers
and will most likely reached soon.
Its breakout will push the prices to Resistance 2.
❤️Please, support my work with like, thank you!❤️

Just a quick word of WARNING for BITCOIN- Local resistanceEasy to see and understand line od resistance here.
This is trhe line of rejection from 2017 and could well pose a problem in the short term
Technically, PA has the ability to break through this line but we need to see if it does.
BITCOIN is at a crossroads and this is just one of about 3 things that stand in ts way.
As mentioned earlier today, we have crossed one major hurdle today, this is the next one.
Hold on tight Guys and Gals, things could get very interesting but, for now, my preferred move for BTC is to range across for a little longer and come back to this next month
Unless the next 8 days are a strong push above this line and then try and stay above it

BTCUSD: Made new ATH on Genius Bill vote. 1D Golden Cross formedBitcoin just made new ATH today pas 109,500 as the U.S. Senate officially advanced the GENIUS BILL for consideration. This has turned the 1D technical outlook overbought (RSI = 75.442, MACD = 4135.600, ADX = 30.728) but as mentioned before, Bitcoin tends to thrive on such a state. On top of the very bullish fundamental news, the market just formed a 1D Golden Cross the first since the U.S. elections one (October 27th 2024). That signaled the extension of the bullish trend to +122.18%. If we apply that on the current bullish wave along with the Fibonacci retracement level, we can see that the price is insde the 0.382 - 0.5 Fib range, exactly where it was on the 2024 Golden Cross. If this plays out exactly this way, expect $165k by late July.
## If you like our free content follow our profile to get more daily ideas. ##
## Comments and likes are greatly appreciated. ##

BTCUSD: Going for the decisive breakout that opens path to 155,0Bitcoin is almost overbought on its 1D technical outlook (RSI = 69.391, MACD = 3884.400, ADX = 20.801), which during rallies is the starting condition that fuels bullish breakouts and continuations. Such a breakout is about to take place right now as the price is on the LH trendline coming from the ATH. As this chart shows, once Bitcoin breaks over a LH trendline on this Cycle, it has always delivered (much) more upside. Assuming we are currently on the 0.5 Fibonacci level of that breakout, the pattern gives a TP = 155,000.
## If you like our free content follow our profile to get more daily ideas. ##
## Comments and likes are greatly appreciated. ##

Bitcoin BTC price analysis - be careful📉 The cryptocurrency market is forming an "order" for "Red Monday".
On the OKX:BTCUSDT chart, the "Triple Top" pattern is probably nearing completion - its recognizable feature is the more lower central top and the right “powerful shake out” (for more details, if you are interested, you can read Encyclopedia of chart patterns/Thomas Bulkowski)
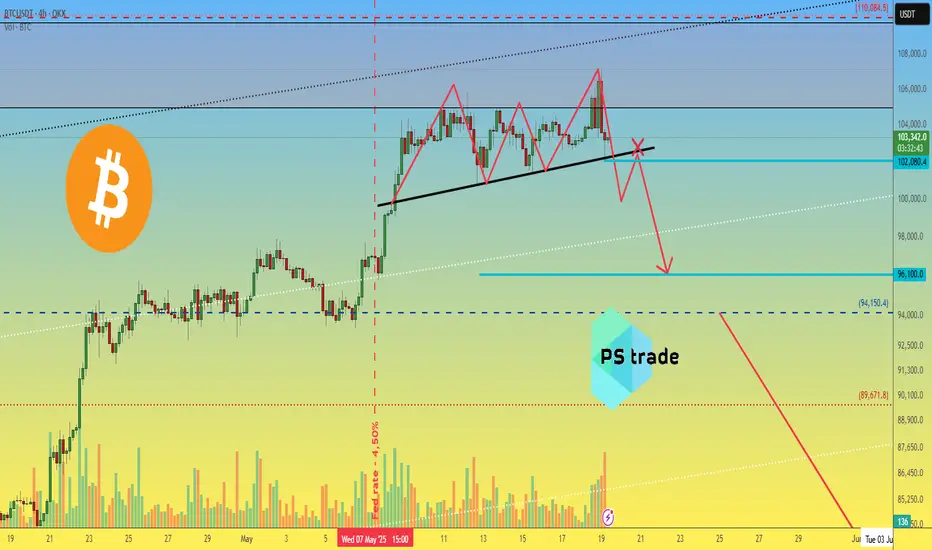
🆗 So, the minimum target for this pattern is $96100 per CRYPTOCAP:BTC
❗️ Confirmation of the "Triple Top" pattern development - after the base breakout and the inability to consolidate higher on the retest.
💰 Globally, we wrote our thoughts on the possible price of #Bitcoin in May/June a week earlier 👇
Also, to make trading decisions and determine which direction to trade, you need to analyze the situation on the charts:
1️⃣ BTC.D 👇
and
2️⃣ USDT.D 👇
_____________________
Did you like our analysis? Leave a comment, like, and follow to get more
$BTC Bearish Divergence Confirmed | Correction ImminentBitcoin has formed a clear bearish divergence on the daily timeframe, accompanied by declining volume, an inverted hammer candlestick at resistance, and a MACD crossover to the downside. Price has also retested the upper trendline but failed to break higher.
Key levels to watch:
First support: $96,000
If broken, further downside to $80,000
Ultimate support around $60,000 if market sentiment weakens further
Also, be cautious as today's Moody's downgrade of U.S. credit may increase market volatility.
This presents a solid short opportunity if BTC fails to reclaim key resistance levels.

Buy Idea Rounding tops and bottoms can be reversal patterns.
Looking at this daily chart, there's rounding bottom.
Third touch of the boundaries with a bullish candlestick will mean buy for me.
Bitcoin Trajectory for Q1 and Q2 2025Hey everyone, it’s been a while! 👋
Let’s dive straight into the Bitcoin outlook and my vision for the months ahead. 🚀
Key Observations 📊
Patterns : Rounding Top & Bottom.
Rebound Levels:
Alt. 1: $101,000
Alt. 2: $82,000
Moving Averages : EMA50 & EMA188.
Target Area : $135,000+ 🔥
Pro Tip 💡
I'm setting an alert for the EMA188 cross on BTCUSDT to stay ahead of the game.
Stay tuned for more updates and insights! 💬

BTCUSD: is far away from its Sell Zone.Bitcoin remains overbought on its 1D technical outlook (RSI = 70.017, MACD = 4154.600, ADX = 16.535) but still in the middle of the Cycle's Channel Up. After a 1W MA50 rebound (April 7th) on the bottom quarter, it is aiming for the blue Sell Zone of the top quarter of the Channel Up where the last two tops were priced. A +93.64% rise has been the most common inside this pattern. Based on that the minimum TP for this run is 140,000.
## If you like our free content follow our profile to get more daily ideas. ##
## Comments and likes are greatly appreciated. ##

BITCOIN BTC Is Entering Into The Correction Read Caption Bitcoin Chart Analysis: Potential Correction Incoming
In my opinion, Bitcoin (BTC) is showing signs of entering a correction phase. The price is approaching its previous all-time high (ATH), and historically, such levels often act as strong resistance. With the market exhibiting signs of exhaustion and profit-taking behavior, a short-term pullback or consolidation could be expected before any further bullish continuation.
---
Would you like a more technical version with indicators (like RSI, MACD, or Fibonacci levels), or a visual chart to accompany

BTCUSD: This is a one way trip to $150k.Bitcoin is rising towards the overbought barrier on its 1D technical outlook (RSI = 68.126, MACD = 4169.000, ADX = 23.891) and that has rearely been a problem in the past as the market tends to thrive on overbought conditions. The minimum rally it delivered after a 1W MA50 rebound (like the one it is on now) has been +100%. TP = 150,000 by the end of summer.
## If you like our free content follow our profile to get more daily ideas. ##
## Comments and likes are greatly appreciated. ##

BTCUSD; Heikin Ashi IdeaBINANCE:BTCUSD
Possible continuation at marked area, or we will have a correction to lower daily demand area where impulsive move started.

BTCUSD: The 1W MACD Bullish Cross eyes $160k.Bitcoin is on excellent bullish levels on its 1D technical outlook (RSI = 67.904, MACD = 4228.900, ADX = 24.411) and even better on 1W where the MACD just formed a Bullish Cross. All such formations since October 2022 led to at least a + 72.93% rally from the moment of the formation. This suggests that Bitcoin's next high on this Channel Up pattern can be around $160,000.
## If you like our free content follow our profile to get more daily ideas. ##
## Comments and likes are greatly appreciated. ##

Bitcoin BTC price analysis - READ the text !There was some positive news: "The US and China have agreed to reduce tariffs for 90 days."
The price of CRYPTOCAP:BTC has entered the zone of total sales - $105-110 thousand.
🕯 Metrics show that large wallets are now opening short positions worth hundreds of millions of dollars, and on the other hand, no less large wallets that organized this rebound in the OKX:BTCUSDT price are very tempted to launch the final stage of cascading liquidations of shorts.
🍿 So, stock up on popcorn - it's going to be "fun" today/tomorrow, and then we'll go to the stronger side!)
Globally, before the growth wave begins, we want to see the final "shake-up" of the longs who have survived everything and still held their positions and didn't give up.
1️⃣ Weak correction in the range of $90-91k - to close the GAP that formed on this rebound and then continue to confidently update ATH with a clear conscience.
2️⃣ A strong correction to the range of $80-82k - during which it will be very interesting to watch the capital flow and dominance.
Which scenario is closer to your heart? Write in the comments!
_____________________
Did you like our analysis? Leave a comment, like, and follow to get more

Bitcoin, MACD and what we may get over the weekend - STILL BULLS
Just a quick post to explain how Ia m looking at this weekend with Bitcoin and I will use the MACD as amajor player here.
The BTC chart above is Daily, we can see the "Cuo " pattern, we can see the Long term rising Libne of support, we can see the red 236 Fib circle we shot through and the up coming 618 fib circle, that may or may not be trouble.
And that 2.618 Fib extension I can easily see us returning to to test as support.
WHY ?
The MACD on numerous timeframes...
What is MACD ?
MACD, short for Moving Average Convergence Divergence, is a technical indicator used in the analysis of securities prices. It was developed by Gerald Appel in the late 1970s and is widely used to identify changes in the strength, direction, momentum, and duration of a trend in a stock's price
OK, So, Lets start witht he 4 hour MACD -
I zoomed out on this a little so we can get a long term look at this and you can clearly see, we are already gettign near the High side, overbought levels where, historically, MACD turns Bearish, crosses over the Signal line ( red) and heads back down to cool off befoe heading higher again.
We are not yet as high as we were in Late April but it is not far off. Safe to assume this will turn down.
So now, lets see the Daily MACD
This is the daily MACD from around Nov last year and, again, we are heading into an area where it is prudent to be Bullish and Cautious.
Remember, the moves in the 4 hour are a lot quicker than the daily.
Go back and Look at the 4 hour, see where MAY began and what the MACD did in that time
See what that was on the Daily ? It was that little Blip on the rise up , that we are now continuing.
So, we have more room to go on the Daily.
and now the Master MACD, The WEEKLY ,the one that told us we were going to range in 2024, 2025 and will once again tell us when PA has reached Exhaustion later in this run
In this chart, you can see the 2 ATH's in 2021, you can see the Bear market and the recovery and everything ever since.
And you can also see that we have Still to cross the Signal line here to really enter a bullish state.
We have SO FAR to go here.....BUT with the high price now now have with BTC, it take more to push it higher. See how high MACD had to go to push PA up this last time ? The same height as it had to go in the 2024 push and yet we went twice as high on PA.
So, th be realistic here.....We are entering a bullish push but a $1 million BTC is NOT going to happen just yet.
SO, back to this weekend, the shorter term.
the 4 hour is high, already starting to turn as I write.
I can see BTC PA ranging or, maybe, as I said, testing the 2.518 as support at around 98K.
What people also need to watch os that BTC.D I talled about yesterday to guage if ALTS will Dip back lower or not.
Some alerady seem to be Dipping
SO, Bullish Caution for the weekend....Hang in there.....We only just begun

Scenario #BTCUSDT long📉 LONG BYBIT:BTCUSDT.P from $104,353.0
🛡 Stop loss: $103,572.0
🕒 Timeframe: 1H
✅ Market overview:
➡️ The price confidently broke above $103,729 and held, confirming the uptrend.
➡️ The next target zone is $104,720–$105,090 — nearest movement objectives.
➡️ Volume increased during the impulse, indicating strong buyer presence.
➡️ A local support level formed around $103,729 — on a pullback, this zone may hold the price.
➡️ POC at $94,479 remains far below — the market has left the balance zone and is trading in an impulsive phase.
🎯 TP Targets BYBIT:BTCUSDT.P :
💎 TP1: $104,720.0
💎 TP2: $105,090.0
💎 TP3: $105,275.0
⚠️ Important: current structure BYBIT:BTCUSDT.P suggests possible correction (wedge breakdown), requiring caution or exit on key level loss.
⚠️ Despite the initial long from $104,353, a breakdown below $103,572 (stop loss) invalidates the long setup.
📢 If H1 closes below $103,572 — better to exit, scenario invalid.
🚀 Scenario BYBIT:BTCUSDT.P valid while holding above $103,729 — below that, correction likely toward lower targets!

BTCUSD: Reclaimed 100k after 3 months! Next wave to $190k.Bitcoin has turned overbought on its 1D technical outlook (RSI = 73.178, MACD = 2904.000, ADX = 30.769) as it reclaimed the $100,000 marke after exactly 3 months. This is a very structured bullish pattern that consists of a Bullish Wave that peaks and leads to a Megaphone consolidation, which in turn starts the next Bullish Wave. Both waves so far have been around +16.30%. As the 8H MA50 perfectly held Tuesday's low, the pattern has already started the new Bullish Wave, which technically aims for yet another +16.30% rally (TP = 109,000).
## If you like our free content follow our profile to get more daily ideas. ##
## Comments and likes are greatly appreciated. ##
